I joined CNBC’s Squawk on the Street this morning to discuss markets and our view that stocks will rally in front of a strong October earnings season.
https://t.co/mecaFRPvcY
In this week's Macro Minute: Nvidia and Marvell earnings, a possible Anthropic S-1, and Kevin Warsh's Jackson Hole speech.
I'll also explain why I think interest rates have peaked and how that sets equities up to move higher through year-end.
In this week's Macro Minute, I preview retail earnings from Walmart, Home Depot, and TJ Maxx after a weak retail sales report and soft consumer confidence. I remain bullish on equities due to tech and believe Fed rates will hold steady through year-end.
Momentum in tech is ready to reignite this week; SpaceX debuts its first earnings report as a public company, while Friday's jobs report and Iran headlines round out the catalysts.
Watch my latest Macro Minute to get ahead of it all.
I joined CNBC’s Power Lunch yesterday to discuss our bullish view on the hyperscalers and momentum tech and why they can start working together. Check it out below!
https://t.co/guuqxQ0Dde
In this week's Macro Minute: tech earnings and a historic momentum unwind, our bullish view on semis, and why the latest inflation data confirms our view that the peak is behind us.
There are several signs of short-term capitulation in semis. This includes South Korea, where the double-levered SK Hynix ETF is down over 75% from its highs amid massive volume, which likely triggered forced liquidations.
Chart source: Bloomberg
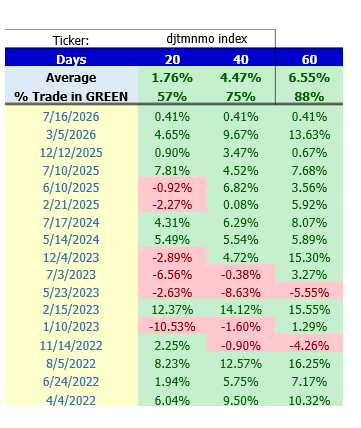
We turned bullish on the momentum factor this morning for many reasons, including our back test shown below. When the momentum index RSI closes below 40, the average 60-day returns are 6.55% and green 14 out of 16 times.
It's a busy week for markets. CPI, PPI, Fed testimony, and Q3 earnings are all landing. My Macro Minute this week runs through the gamut - inflation has peaked, earnings estimates have room to run, and hyperscalers are our contrarian call.
Watch below for the full breakdown.
A big tailwind for all asset classes has been M2 money supply growth, which has continued to show YoY growth above 4% — recently hitting a local high of 4.7%.
Source: Bloomberg
With equity supply likely going up over the next year, let's reexamine current cash levels.
This chart reflects money market assets and checking accounts divided by the market cap of the Wilshire 5000 going back to 1989, showing it at a 35+ year low.
Source: Bloomberg, Cantor
Bitcoin is now below a 20 RSI. This has happened 7 other times in its history. Since dropping below 20 yesterday, it is down a further 2.2%. How did it perform the other 7 times?
Data below shows it was higher 20 trading days later in 6 of the 7 instances.
Image source: Cantor
The wealth effect is alive and well, and still a major tailwind.
S&P 500 +10% YTD. Equity allocation at historic highs. Net worth well above long-term trend.
But it's also a double-edged sword. When it turns, it'll be as self-fulfilling going down as going up.
Image: Bloomberg
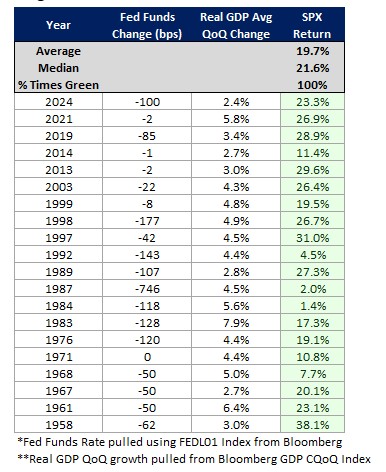
Since 1955, there have been 20 years in which GDP averaged above 2.25% and the Fed didn't hike rates. Stocks were green in all 20.
Average return: +19.7%.
We think both conditions are highly likely to be in place today.
Image source: Cantor
Headline inflation will likely move above 4% due to oil and AI capex.
History shows: when inflation is above 2.7%, and the Fed isn't fighting it, stocks are strong — up 94% of those years with a median return of 17.3%.
Image source: Cantor
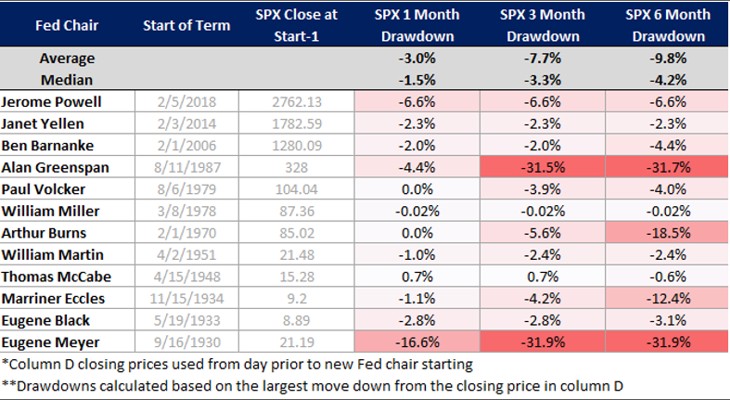
Kevin Warsh is the new Fed Reserve Chairman, a transition that often brings a bit of uncertainty.
Historically, the median drawdown from the price level when a new Chair took office was 4.2%, while the average drawdown over the next six months was 9.8%.
Image source: Cantor
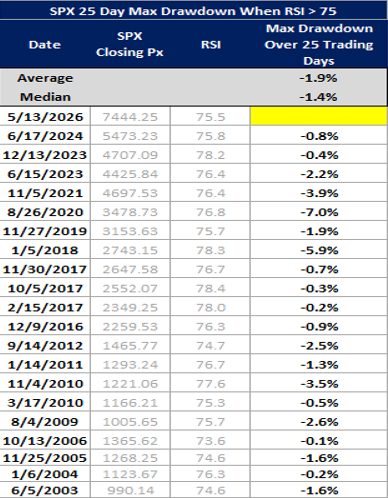
The S&P 500 crossed 75 RSI on May 13.
Looking at the past 20 instances where it closed above a 75 RSI and measured the maximum drawdown (from the closing price that day), history shows:
• 50% of the time, a drawdown of 1.5%+
• 30% of the time, a drawdown of 2.5%
Data below: