⚡ $INTC — a monster run taking a breather. Bullish, but only 23% confluence (mixed: 2 bullish vs 1 bearish family): the long-term trend is strong while the short-term wobbles.
📊 The breakdown: zoom out and it's a powerhouse — price $112 sits above the 50-DMA ($90) and 200-DMA ($52, price has more than doubled off it), with a golden cross and a heavy ADX 40. But it just lost the 20-DMA ($115) and momentum is flat (MACD < signal, RSI 54). The real flag is volume: OBV falling + MFI 32 point to distribution into the highs. A Hammer candle shows buyers tried to step in. ⚠️ ATR 7.85% — a fast, volatile mover.
🎯 Game plan: it's pulling back from the $133 high. Bull case = reclaim the 20-DMA $115 and let momentum catch up. Bear case = lose the 50-DMA $90 and the run cools hard. My take: 🟡 powerful trend, but distribution + a lost short-term average = a "let it prove it" pullback, not a chase. NFA #INTC #Semiconductors #StockMarket #ChartAnalysis #SwingTrading
🤔 $IBKR — a coiled, indecisive tape. Sentiment leans bullish but at just 13% confluence it's basically a coin flip (2 bullish vs 1 bearish family): a tug-of-war right under resistance.
📊 The breakdown: the big picture is still up — price $84 sits above the 50-DMA ($79) and 200-DMA ($71) with a golden cross — but it just slipped under the 20-DMA ($85) and ADX 19 says the trend is weak/choppy. Momentum is the drag: MACD < signal, RSI a dead-neutral 52, Stoch falling. Volume's a shrug (OBV flat, MFI 47). The bull tell: a Hammer candle printed inside a rising channel.
🎯 Game plan: this is a range fight. Bull case = reclaim the 20-DMA $85 and break $88.44 resistance. Bear case = lose the 50-DMA $79 and the uptrend stalls. My take: 🟡 structurally bullish, but momentum is missing — a "prove it" setup that needs $85 back before it means anything. NFA #IBKR #StockMarket #ChartAnalysis #SwingTrading #PriceAction
1/ 🚀 $HPE is in beast mode — 94/100 momentum and an ADX 56 uptrend that's left every moving average behind. Full technical read 🧵 #HPE
2/ 🧠 Thesis: 85% bullish confluence, 3 of 4 families green. Price $49 is in blue sky — above the 20, 50 AND 200-day averages with a golden cross. Trend leaders look like this.
3/ 📈 Trend: textbook stack — price > SMA20 $39 > SMA50 $32 > SMA200 $25, golden cross, ADX 56 (+DI). One of the strongest trend readings you'll see.
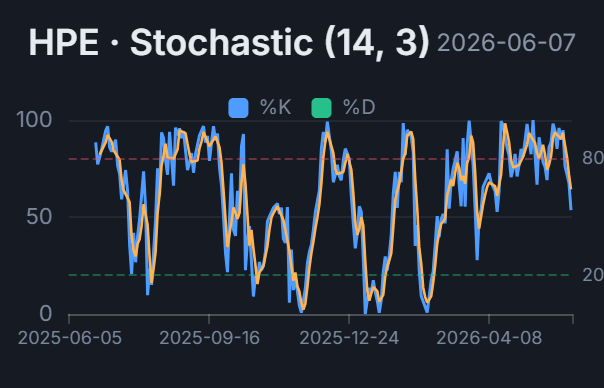
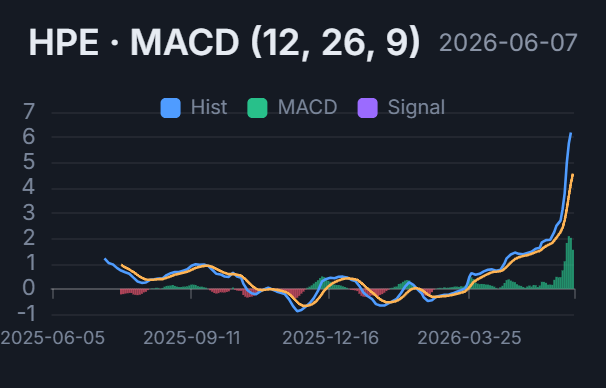
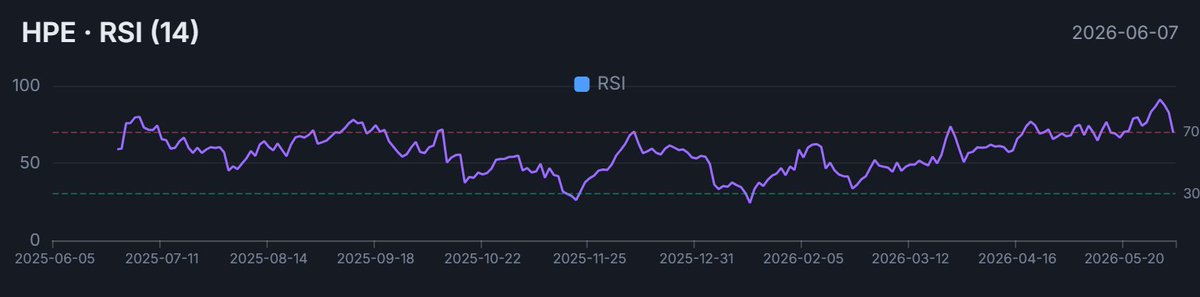
4/ ⚡️ Momentum: MACD > signal, RSI ~70, momentum 94/100. Powerful — but RSI at 70 + Stoch rolling over say the short term is getting hot.
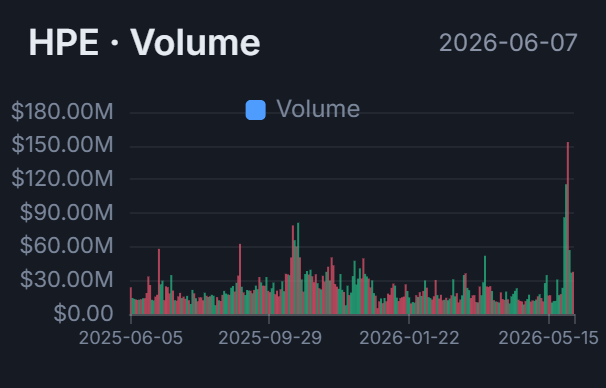
5/ 💰 Volume: OBV at $1.18B and rising, MFI 71. Real accumulation is fueling this — not just price drift.
6/ 🕯️ Caution flag: an Evening Star candle printed up here — possible short-term exhaustion inside the bigger uptrend. Worth watching.
7/ 🌡️ Extended: ATR 6.6% and BB width 86% — volatility is wide and price sits ~26% above its 20-DMA. Strong, but stretched.
8/ 🎯 Game plan: no overhead resistance — it's price discovery. This is about holding the rising averages, not breaking a ceiling.
9/ 🐂 Bull case: hold the 20-DMA ($39) and buyers stay in control — continuation as long as it rides above it.
10/ 🐻 Pullback risk: lose $39 and the 50-DMA ($32) is the next support shelf. A healthy reset, not a trend break, unless it cracks.
11/ 📌 Bottom line: 🟢 85% bullish, elite trend (ADX 56) but extended near-term. ⚠️ ATR 6.6% = fast mover. Buy the dip or chase? 👇 NFA #StockMarket #Momentum #Breakout #PriceAction #AI
$67.6B in Net Worth. $6.6B Market Cap. The market is pricing a fortress like a liquidation sale.
Our daily watchlist scan flagged $FMCC (Freddie Mac) this morning. Not because of a price drop, but because of a volume anomaly disconnected from fundamentals. While the street chases AI high-flyers, the most profitable machine in America is trading at ~2x earnings and 0.1x book value. This isn’t a “value trap”—it’s a regulatory hostage situation nearing a breakout.
THE ASYMMETRIC SQUEEZE
📉 Valuation Disconnect: Latest 10-Q confirms Net Worth hit $67.6B in Q3 2025. That’s up from $56.4B a year ago. The stock price? Flat. The “Value Gap” has widened to over $60 billion.
🏛️ Macro Catalyst: The Trump administration is officially “opportunistically evaluating” a conservatorship exit by end-2025. This moves the thesis from “if” to “when.”
💰 Earnings Power: $3.1B in Net Income for Q3 alone. Annualized run rate of ~$12B against a market cap of ~$6.6B. You are buying the engine for the price of the tires.
🔍 Insider Signal: Zero open-market sales. The capital structure is locked, and the smart money knows the only exit is a recapitalization that unlocks the common.
My Take
This week’s decision-quality review highlights a rare “fat pitch.” Most investors are over-analyzing rate cuts while ignoring capital structure catalysts. The risk here isn’t business quality—delinquencies are near historic lows and the guarantee book is pristine. The risk is political timing. But with the Net Worth chart going parabolic (see below) and the political wind shifting, the “conservatorship discount” is the most mispriced risk premium in the market. We are effectively holding a call option on the US housing finance system with no expiration date.
The math is simple: The government needs the money. The shareholders own the equity. Eventually, the two align.
Bullish 🦅
📉
Stock picking isn’t dying. It’s being outsourced to indices.
A projected -$605B in outflows from active equity funds this year, with cumulative -$3.1T over 11 years, is not noise it’s regime change. When only 29% of large‑cap managers are beating the benchmark, versus a long‑term average of 37%, allocators are doing the rational thing: they are firing humans and hiring the S&P 500.
THE GREAT ROTATION
This is what the active‑vs‑passive shift really means in flows and structure:
📉 Structural Redemption: Outside of a few niches, active equity has logged net outflows in 10 of the last 11 years, culminating in the current record. That is not a cycle; it’s a melting ice cube.
📈 Passive as Default: Over the same window, passive equity funds have absorbed trillions in inflows and now dominate new capital, with 2025 likely adding ~trillion‑plus yet again. The benchmark is no longer the yardstick; it’s the product.
🎯 Alpha in the Tail: With only ~1/3 of managers beating after fees (and less in US large caps), investors are deciding that stock picking is an occasional satellite, not a core holding.
MY TAKE 🎯
Active management isn’t “dead,” but it has become a niche skill sport in a world that prefers cheap beta. The paradox: as more capital crowds into passive vehicles like $SPY and $VOO, index construction itself becomes the biggest active decision in markets. For truly active strategies that are unconstrained, concentrated, and genuinely different from the benchmark, this may quietly be the best hunting ground for alpha in 20 years because the competition is bleeding AUM and career risk is forcing everyone else into closet indexing.
Bullish 📉
Ignore the “China is dumping” fear porn. Total foreign holdings are still near record highs ($9.2T). The demand for the US Dollar as a collateral layer is untouched. What we are seeing is Geopolitical Structuring countries are moving their stack from “Direct Ownership” to “Custodial Proxies” to protect against potential asset freezes. The plumbing is changing, but the water is still flowing to Treasury.
This 50.4 print is the green light for the Fed to panic. They cannot keep rates restrictive when the consumer is screaming “Depression.” Bad news is about to become the ultimate buy signal for duration assets $TLT .The equity market $SPY might hate the earnings recession, but it will love the liquidity injection that comes to fix it. We are at peak pessimism, which is usually exactly when the money printer turns back on.
This slide is the purest expression of the current AI regime: tech is swapping variable cloud flexibility for locked‑in, utility‑like obligations. In portfolio terms, $ORCL is no longer just software; it’s a quasi‑infrastructure name with embedded power and utilization risk. The market is still valuing many of these names like high‑margin software while they quietly morph into capital‑intensive utilities. That mispricing cuts both ways: if the AI demand curve is real, earnings power is being structurally underpriced; if not, this is how an AI bubble turns into a margin recession.
🖨️
The Fed is loud. The PBoC is lethal.
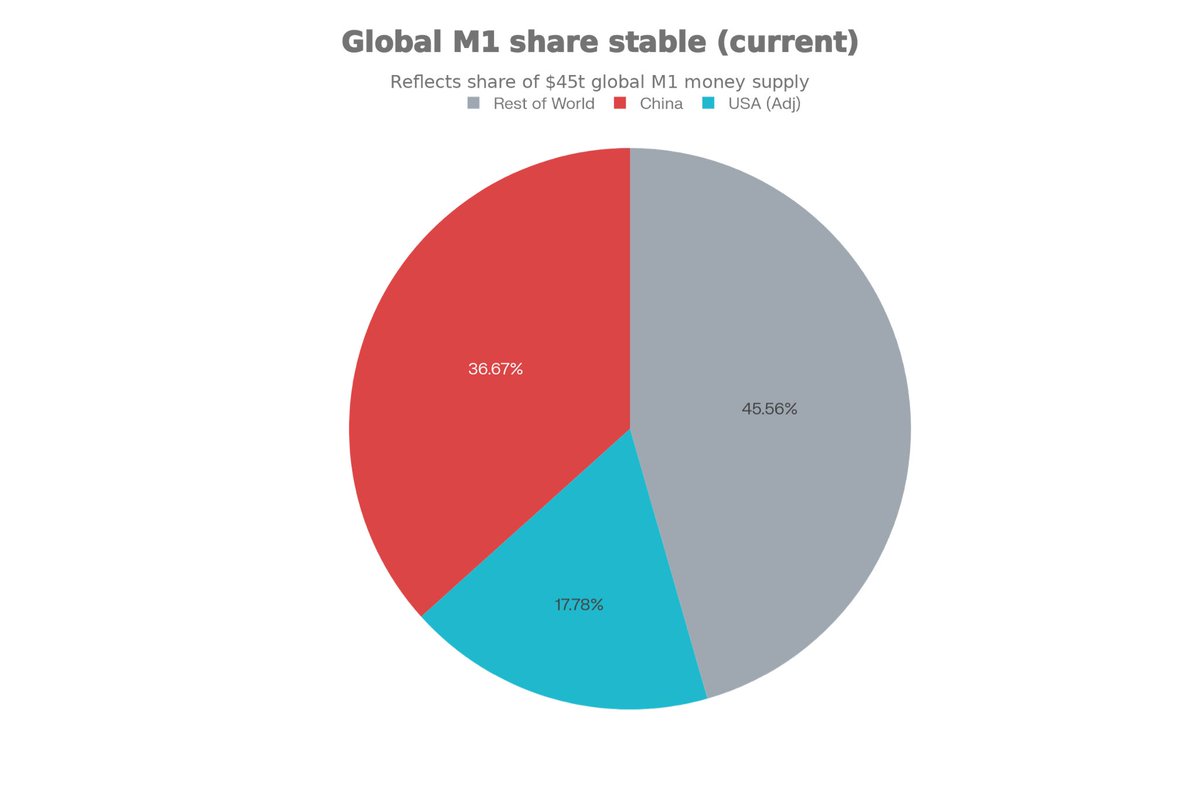
Everyone is obsessed with Jerome Powell’s 25bps cuts, but they are watching the wrong central bank. The real liquidity hose is now in Beijing. With China’s M1 hitting an all-time high of $16.5T, they are effectively printing a new “Germany” worth of cash every few quarters. The US is no longer the main character in the global liquidity story; we are the supporting actor.
THE GREAT ROTATION
Global M1 hitting $45T isn’t just a number; it’s a signal that fiat debasement is now a competitive sport.
🧲The 2:1 Ratio: For every dollar of “narrow money” the US creates, China is creating nearly two. This explains why Chinese equities ($FXI) are waking up despite their deflationary macro data.
🧲The Silent Inflation: We look at US CPI and think we won. But global liquidity always finds a home. If it’s not in US goods, it flows into hard assets.
🧲The Shadow Stimulus: While the US fights over “fiscal discipline,” China is flooding the plumbing. This money doesn’t stay behind the Great Firewall; it leaks into commodities, crypto, and luxury assets globally.
My Take 🎯
We are witnessing a “Liquidity Handover.” The US is fiscally constrained by debt interest, but China is desperate to reflate. This specific $8.5T gap between China and US M1 is the bullish case for scarcity. When the world is drowning in paper, you buy the things they can’t print. The next bull run won’t be funded by Wall Street; it will be funded by the People’s Bank of China.
Bullish 🖨️
We are witnessing a “Liquidity Handover.” The US is fiscally constrained by debt interest, but China is desperate to reflate. This specific $8.5T gap between China and US M1 is the bullish case for scarcity. When the world is drowning in paper, you buy the things they can’t print. The next bull run won’t be funded by Wall Street; it will be funded by the People’s Bank of China.
This is financial engineering at its peak. If this executes, $TSLA stock stops trading on auto margins and starts trading as a holding company for the Musk Economy. The “insane amount of work” Musk mentions is just code for regulatory hell, but the signal is clear: The walls between Musk’s companies are coming down. Long-term holders are about to get paid in rocket fuel.
🌉
Banks are closed. The blockchain is open. Interactive Brokers just built the bridge.
While J.P. Morgan sleeps on weekends, $IBKR just solved the biggest friction in global capital markets: settlement speed. By allowing clients to fund accounts directly with $USDC, they aren’t just adding a “crypto feature.” They are effectively declaring that stablecoins are superior to SWIFT for moving money. This is the first major brokerage to treat crypto not as an asset to trade, but as a rail to run on.
THE 24/7 LIQUIDITY PIPE
Legacy finance is terrified of what $IBKR just did. They turned the $320B stablecoin market from a “casino chip” into immediate buying power for the S&P 500.
⚡ Zero Friction: You can now move liquidity from a Solana wallet to a stock portfolio in minutes, bypassing the T+2 settlement dinosaur.
🛑 The Weekend Gap: Banks lock your cash from Friday at 5 PM to Monday at 9 AM. The blockchain doesn’t. $IBKR clients can now position capital before the Monday open.
🌊 The Floodgates: Global investors in hyper-inflationary zones (Argentina, Turkey) hold savings in $USDT and $USDC. $IBKR just gave them a direct on-ramp to US Equities without touching a correspondent bank.
My Take 🎯
This is a structural shift in market plumbing. $IBKR is capturing the “unbanked” wealthy who live on-chain. By the time $SCHW and $HOOD figure this out, Interactive Brokers will have already absorbed the liquidity of the crypto-native economy. They are essentially becoming a DeFi protocol with a banking license. The spread between “crypto” and “finance” just collapsed to zero.
Bullish 🌉
🥇 Banks Raise 2026 $Gold Targets – Consensus Breaks Higher 🥇
The Setup:
Macro Overwhelms Mean Reversion
Gold is no longer speculation territory. Every major bank $Goldman, $BAC, Deutsche, $JPM has lifted 2026 targets to the $4,450–$5,200 range. This isn’t exuberance. This is structural. Central banks bought 760 tonnes in 2025 alone, up 2.5x the pre-2022 baseline. Emerging markets, led by China, remain vastly underallocated to gold. The Fed is cutting, the dollar faces gravity from fiscal deficits approaching 7% of GDP, and Western ETF inflows hit $33 billion in eight weeks.
💰 Why Banks Are Synchronized (And Why That Matters)
🔸 Central bank diversification from USD reserves into bullion 95% of central banks surveyed expect global holdings to rise
🔸 ETF demand structural: $14 billion flowed into gold ETFs in September alone, 880% higher year-over-year
🔸 Fed rate cuts by 100 basis points expected by mid-2026 non-yielding gold becomes relative value
🔸 Fiscal backdrop unchanged under Trump: deficit spending, tariffs, debt issuance all gold-supportive
🔸 $JPMorgan Private targets $5,200–$5,300, the outlier high end, signaling how far optimism extends
Where the Consensus Cracks
Not everyone agrees. $HSBC remains defensive at $3,950 assuming faster stabilization. Commerzbank caps upside at $4,100. Their case: tightening fiscal policy could emerge, Fed could stay hawkish if inflation re-accelerates, and equity markets could re-attract capital. Lease rates elevated. Physical supply squeezed. Manipulation risk exists. Real rates could turn positive again, crushing gold’s runway.
My Take 🎯
The macro case for gold is airtight: devaluation cycle, reserve diversification, monetary ease. But $5,000+ assumes no policy shock or equity capitulation doesn’t reverse the central bank bid. Consensus at $4,800–$5,000 reflects pricing power that needs to hold without the structural drivers fracturing. Watch Fed communications Q1 2026 a pivot kills momentum fast. The risk isn’t the target. It’s velocity and mean reversion when positioning peaks.
Bullish 🥇