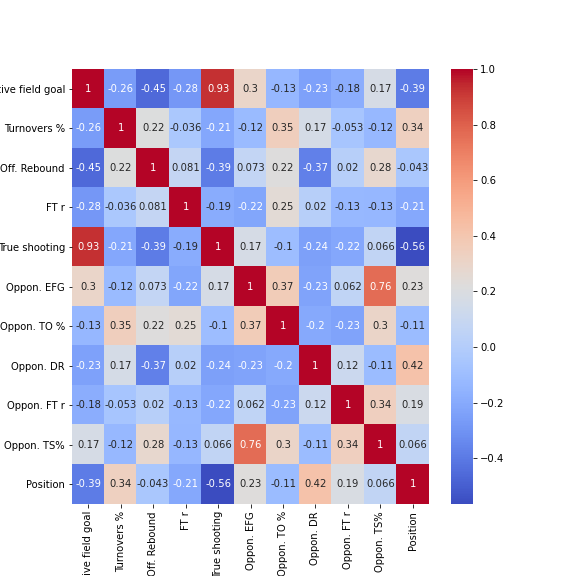
Correlation heatmap for @EuroLeague week 6 with most common team factors. Notice that some times are missing games due to COVID, which can mess with results, but true shooting, effective field goal and opponent defensive rebound are the highest correlated. #stats#basketball
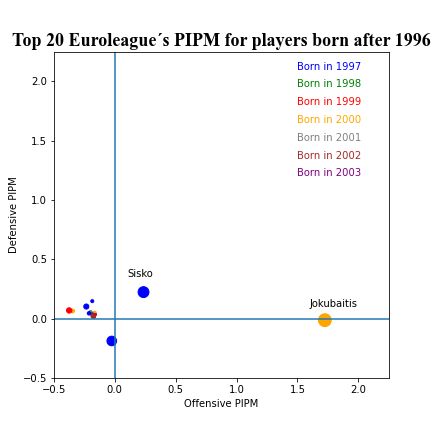
For youngsters in @EuroLeague's 20/21, after 4 weeks, only 2 players with positive impact. Rokas Jokubaitis (@bczalgiris) is the best so far due to his offensive skills, followed by Zan Sisko (@FCBBTogether). We´ll see how this evolves once we have a larger sample.
Top 20 young players (born 97 or beyond) for @EuroCup after week 3 in terms of PIPM. @Penya1930 and @AquilaBasketTN are tied with 3 players each on the top 6. @Neno_D7 is, so far, the young player with a higher impact.
@EuroLeague Day 2: @cskabasket vs @MaccabitlvBC had a cold cold shooting night (48% for CSKA and 42.5% for Maccabi). Take a look at individual performances and see how Mike James handed that W for CSKA.
@EuroLeague Day 2: @RMBaloncesto vs @valenciabasket four factors. Valencia shot an amazing 60% on effective Field Goal %. They were also better at turnovers % and offensive rebound %, thus +16.
Quick thread on @EuroLeague ´s Day 1. Teams played an average of 70.6 possessions per game (with a standard deviation of exactly 3). Highest paced game was @MaccabitlvBC - @albaberlin with over 75 poss/team, slowest game was @olympiacosbc - @bczalgiris at 66.2 poss/team.
Last season, Gudaitis had the highest free throw rate of the entire @EuroLeague playing for @OlimpiaMI1936. On Euroleague´s Day 1, Milano got a 0.37 FTr. Only teams with higher FTr in Day 1 were @Khimkibasket (0.38) and @Baskonia (0.40). Interesting trend to follow on Milano.
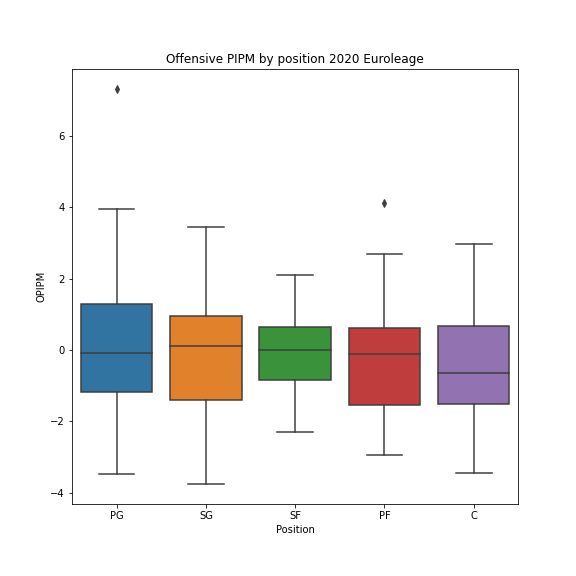
More on player impact for 2020's @EuroLeague. In this case, offensive PIPM by position. 4 takes: 1) Larkin and Mirotic only two outliers; 2) SF are transitioning to the NBA 3&D role, 3) Centers are top on defense, not great on offense; 4) OPIPM doesn´t correlate with position.
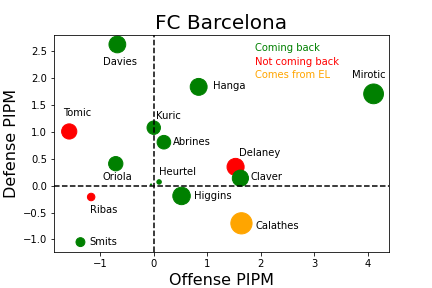
I will be using PIPM to analyze Euroleague rosters for 20/21 season. I will start with @FCBbasket . Dot size represents minutes played. Who is coming back and who is not? What other rosters would you like to see?
Free throw rate for players taking +4 shots per game for 2020 Euroleague. Gudaitis gets, on average, a free throw for each shot he takes! Crazy. Ideally, you´d like a high FTr combined with high FT %. @OlimpiaMI1936@EuroLeague
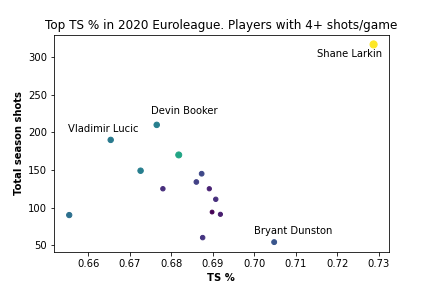
If we look at true shooting %, Larkin's Euroleague 2020 season has been even more insane. Best true shooting percentage shooting way to more than the rest of them. Devin Booker had a good shooting season too. @EuroLeague@AnadoluEfesSK@Khimkibasket
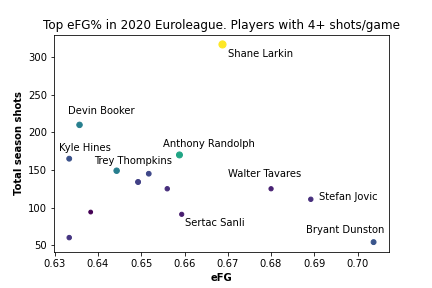
Another example of the insane season Shane Larkin has had in 2020 Euroleague. Size dot and color represent shots per game. He was 4th in eFG shooting +12 times per game! No one even close!
@EuroLeague@AnadoluEfesSK
Another example of the insane season Shane Larkin has had in 2020 Euroleague. Size dot and color represent shots per game. He was 4th in eFG shooting +12 times per game! No one even close!
@EuroLeague@AnadoluEfesSK
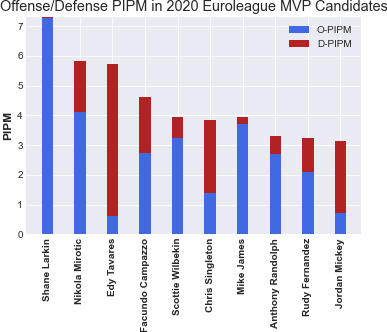
Last plot from the PIPM series. Where does PIPM come from? Larkin, Wilbekin, Randolph and James, just offense. Mirotic, Facu and Rudy bring some defense to the table. Tavares, Singleton and Mickey, mostly defense. You can dominate the game many different ways! @EuroLeague
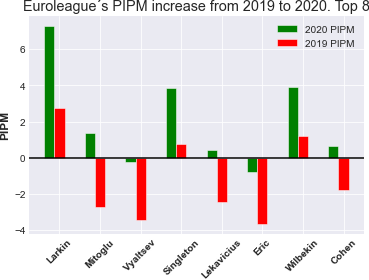
Still working with Goldstein´s PIPM for 2020 Euroleague, I´m plotting the possibility of a Most Improved Player. I present the top 8 candidates. Who´s your MIP for this season? @EuroLeague
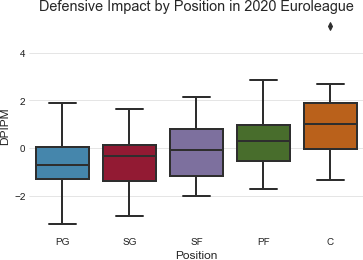
Following with the defensive impact work, this time we take a look at it by position in 2020 Euroleague´s. Looks the the biggest spread is in the SF group and guards have the least impact. The center's outlier is, again, Walter Tavares. @EuroLeague
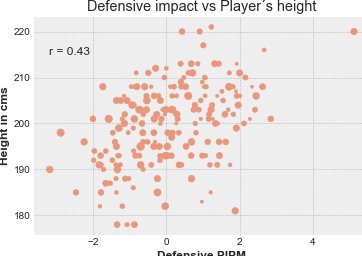
Still working on Goldstein´s Euroleague PIPM, I´ve plotted the correlation between height and defensive impact. The outlier on the top right corner is Walter Tavares, which is clearly DPOY (if there was one). Size of dots represent minutes played.
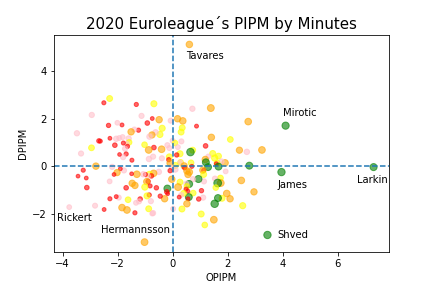
Using the same metric, Goldstein´s PIPM, here I plotted O-PIPM and D-PIPM for all 2020 Euroleague players. Dot size and color represent the total minutes played in the season. The x=-y imaginary line would represent the limit between positive (right) and negative (left) PIPM.