The “climate crisis” is the biggest scam in scientific history.
Not one doomsday prediction has come true in the last 40 years.
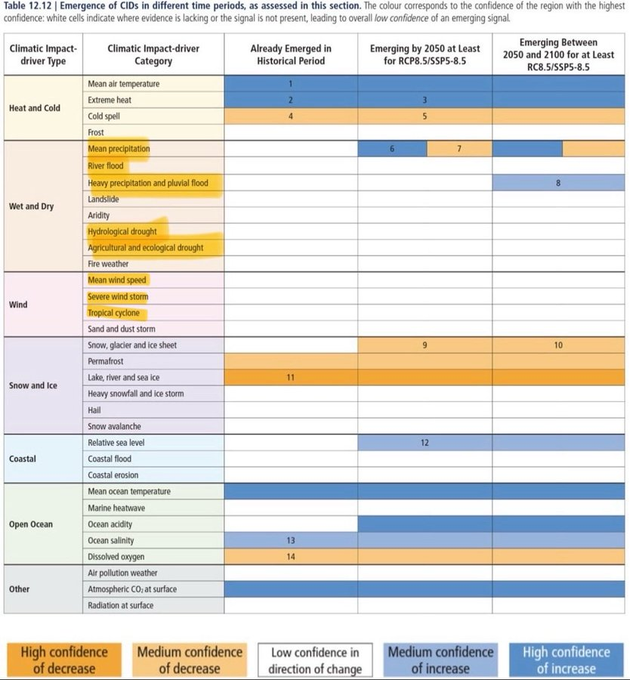
There has been little increase in the vast majority of extreme weather phenomena.
Tropical cyclone frequency and intensity have not increased since 1980 or 1900 globally.
Tornadoes have not increased in the U.S. since 1954. The increase in tornado outbreaks is largely an artifact of better detection from the advent of the WSR-88D radar in the late 1980s / early 1990s. Since 1990, there has been little change in tornado outbreak occurrence.
Despite predictions of larger hailstones, there has been no statistically significant increase in severe or very large hail reports since 2000 in the U.S.
River flooding has not increased globally since at least 1961. There are just regional and local increases and decreases within the bounds of internal variability.
Cold waves have decreased since 1900 virtually everywhere in the Northern Hemisphere, and especially since 1990.
Meteorological droughts have not increased in frequency or intensity since 1950 globally, or in the U.S. and Canada since the late 19th century.
Only heatwaves and heavy rainfall events have increased since 1950, and those increases are largely regional. Heatwaves have not increased since 1900 in either the U.S. or Canada, and there is evidence that heatwaves in Australia were worse than recent years prior to 1910.
Increases in hydrological and agricultural droughts are primarily due to poor water resource management and land use change. Obviously, that can be an issue, but it’s perfectly manageable.
Global wildfire burn area has decreased by over 90% since 1900, mostly due to fire suppression. But even since the early 2000s, it has continued to decrease. Forest fire burn area has not increased since at least 2002. Increases in, say, the western U.S., are primarily because of poor forest management.
Great Barrier Reef coral cover has made a significant recovery in recent years, even being at a record high in 2024.
Arctic sea ice extent / volume have not changed much since 2007, despite predictions that the Arctic Ocean would be “ice-free” by 2008, 2010, 2012, 2013, 2014, 2015, 2016 (that was even in a peer-reviewed study), 2017, 2018, 2019, and 2020.
Climate models in the CMIP5 and CMIP6 suites have warmed the bulk atmosphere twice as much as real observations from NASA satellite data (from UAH and NOAA STAR) show.
In 1985, the EPA predicted that global mean sea level would rise 26.2–39.3 cm (10.3–15.5”) by 2025. Satellites, however, estimate that sea level only by ~11.8 cm (4.6”) over that time. They were off by more than a factor of two.
In 2006, Al Gore said that there would be no more snowfalls on top of Mount Kilimanjaro in Tanzania by 2016. But as it turns out, it still snows there.
The 2001 IPCC report predicted that we would see a decrease in heavy snowstorms in the mid-latitudes. That did not happen, and some scientists now claim we’ll see more.
And in general, apart from the cumulative inflation crisis, the quality of life on Earth has never been better.
Global average life expectancy has more than doubled on every inhabited continent since 1850.
The number of people living in poverty is at an all-time record low.
The number of people malnourished is at an all-time record low.
Global crop production and yields are at all-time record highs.
Total deaths from extreme weather or weather-related phenomena have decreased by 96.2% since 1920 despite worldwide population increasing by over six billion persons since then.
Our ability to adapt outweighs any kind of adversities Mother Nature may throw at us.
The only person full of it is you. 🫵
Earth is in the Late Cenozoic Ice Age — the global temperature of 15°C is still far colder than the long-term historical baseline of 24°C.
Yet this week the United Nations launches COP31 in Türkiye, a lavish two-week gathering that puts the climate agenda back on the world stage. But this is only temporary. The world no longer cares. This global warming agenda has been running for 40 years and brought little more than fear, of economic collapse and industrial chaos.
However, the physical reality remains: Earth is technically in an ice age, defined by permanent ice at both poles year-round. Humans evolved and still live within the Quaternary Glaciation, which began 2.58 million years ago. And 10% of the world's land area remains covered by glacial ice.
By comparison, the combined footprint of every town and city on Earth accounts for only 1 to 3% of total land area. Glacial ice covers 15 million square kilometers (5.8 million square miles) — roughly a third of its extent during the peak of the Last Glacial Maximum (26,000 to 19,000 years ago), when ice sheets reached their most recent maximum.
The Antarctic is the largest and thickest ice structure on Earth by far, reaching up to 4.8 kilometres in depth (3 miles) and holding 90% of the world's ice volume. It accounts for around 85% of total global glacial ice and remains the planet's single largest source of fresh water. Spanning roughly 14 million square kilometers (5.4 million square miles), Antarctica covers about 9.3% of Earth's total land surface.
Overall, land covers only 29% of Earth's surface, while oceans cover 71% to an average depth of 3.7 kilometers (2.3 miles). Forests cover roughly 31% of land and the deserts 33%. Critically, the oceans hold roughly 86% of the active global carbon reservoir and 91% of retained heat energy; by contrast, the atmosphere holds a mere 1 to 2%.
For four decades, public policy has been driven by forecasts of soaring temperatures and runaway crisis. Yet these predictions are still only scenarios. In the real world, outside the newsroom narrative, planetary dynamics continue.
The Late Cenozoic Ice Age has endured for 34 million years, initiating the original glaciation of Antarctica. The primary drivers were tectonic shifts across interconnected continents. These crustal plate movements redirected ocean currents and fundamentally altered global thermal distribution.
Orbital anomalies — the Milankovitch cycles of eccentricity, tilt, and precession — combined with the thermal isolation of Antarctica as Australia and South America drifted northward, locked in these cool planetary conditions.
Modern human civilization and every major agricultural breakthrough developed entirely within the current Holocene interglacial, which began just 11,700 years ago.
World temperatures were almost 2°C higher than today and sea levels 6–9 meters higher during the Eemian interglacial, 129,000–116,000 years ago.
This protracted warmth was not driven by carbon dioxide; a paradox that exposes the fiction of treating the pre-industrial CO₂ baseline of 280 ppm as a planetary thermostat. If CO₂ were truly the climate control knob, the Eemian could not have been significantly warmer than our current era of 420 ppm.
Tectonic movements, ocean currents and orbital cycles are the ruling heavyweights of climate. Current UN policy continues to distort the atmospheric properties of CO₂ by ignoring such rich lessons from the past.
Historical warm periods — the Roman and Medieval climate optimums — occurred without carbon management, just as the 500 years of the Little Ice Age in Europe unfolded with virtually no change in CO₂.
This contrasts sharply with the UN's 'Code Red' crisis mentality. Civilisation thrived during previous warm peaks without centralised UN oversight. Dismantling the 'CO₂ as primary lever' narrative highlights the natural variability that defines the Quaternary glaciation.
History and physics did not just begin in 1850. We are 2.58 million years into the severe Quaternary glaciation, and our current warmth is simply a standard warm interglacial. The IPCC ignores these precedents because acknowledging them would render their centralised economic solutions irrelevant — like net zero. By 2050, this reasoning risks costing the world $275 trillion while achieving nothing for the planet — an indictment of a flawed climate ideology, designed to promote a UN led One World Government.
IMAGE: The four most recent interglacials over the past 450,000 years (Antarctic temperature proxy and CO2, after R. Hannon 2017).
MIS 1 (11.7 ka–present) – Holocene
MIS 5 (130–115 ka) – Eemian (last interglacial)
MIS 7 (243–191 ka) – Aveley
MIS 9 (337–300 ka) – Purfleet
MIS 11 (424–374 ka) – Hoxnian/Holstein