The largest move in the last 7 days was: Sweden 10Y. G10 bond yields that had 2 standard deviation moves during the period include: Sweden 10Y, Sweden 20Y
The largest move in the last 24 hours was: Swe. 2s10s. G10 bond yields that had 2 standard deviation moves during the period include: Swe. 2s10s, Sweden 10Y, Sweden 20Y, Japan 10Y, Japan 5Y, China 5Y, Japan 2s10s, German 10Y (among others)
Over the last 20 days, we have generally seen the S&P index outperform the signals from global assets correlated to risk sentiment. The S&P has outperformed the model by +1.84% cumulatively during the period.
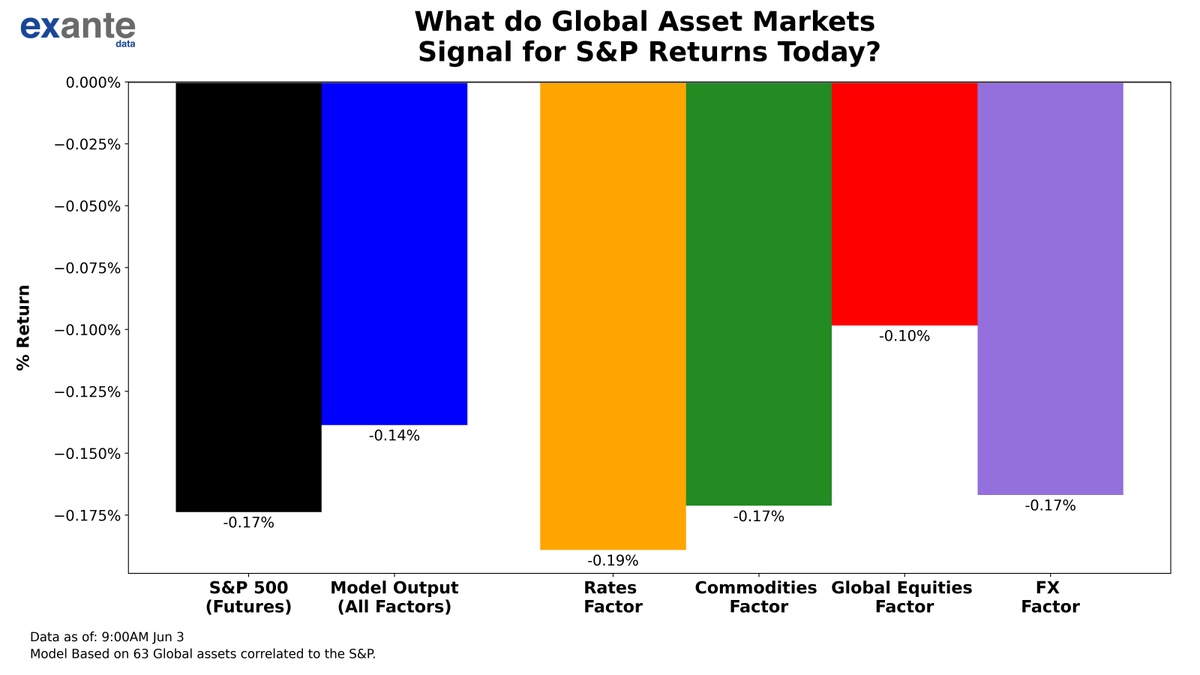
2 Hours ahead of the NY Open, our cross-asset model indicates a -0.14% loss for the S&P (while futures are down -0.19% since prior close). The signal from Global Equities is most bullish (-0.10%), while the signal from Rates is least bullish (-0.19%).
Looking at notional #ETF flows to monitor sector rotations within US Equities: currently the sectors experiencing the largest inflows compared to their averages include Large Cap and Broad Debt, while outflows are being seen in Broad Equity and Treasury.
Over the last 20 days, we have generally seen the S&P index outperform the signals from global assets correlated to risk sentiment. The S&P has outperformed the model by +1.86% cumulatively during the period.
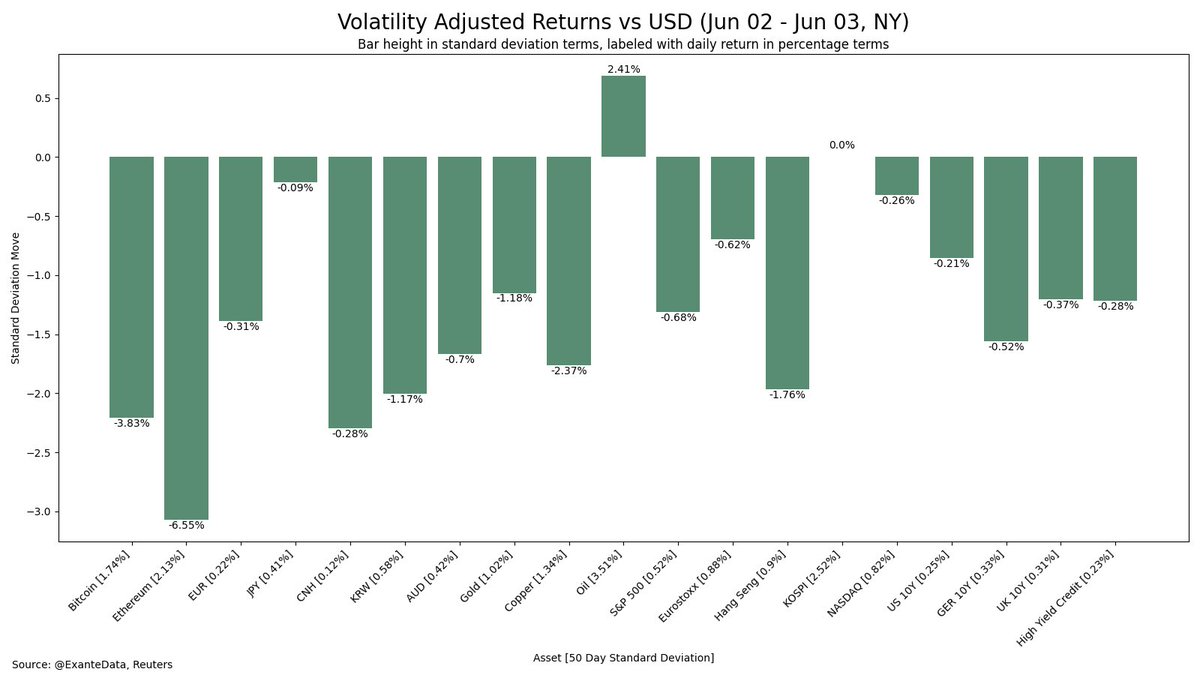
The biggest movers in global FX overnight, based on volatility adjusted returns were #USDMYR, #USDIDR, #NOKSEK, #EURSEK, & #USDSEK. For USD crosses, 25 out of 28 had positive returns. For EUR crosses, 6 out of 13 had positive returns. #Forex
5 Hours ahead of the NY Open, our cross-asset model indicates a -0.09% loss for the S&P (while futures are down -0.11% since prior close). The signal from Global Equities is most bullish (-0.02%), while the signal from Commodities is least bullish (-0.20%).
The largest move in the last 7 days was: Japan 2s10s. G10 bond yields that had 2 standard deviation moves during the period include: Japan 2s10s, Japan 10Y, Japan 5Y
The largest move in the last 24 hours was: Japan 2s10s. G10 bond yields that had 2 standard deviation moves during the period include: Japan 2s10s, Japan 10Y, Japan 5Y, Japan 30Y
Over the last 20 days, we have generally seen the S&P index outperform the signals from global assets correlated to risk sentiment. The S&P has outperformed the model by +2.15% cumulatively during the period.
2 Hours ahead of the NY Open, our cross-asset model indicates a +0.09% gain for the S&P (while futures are down -0.19% since prior close). The signal from Global Equities is most bullish (+0.11%), while the signal from FX is least bullish (+0.06%).
Looking at notional #ETF flows to monitor sector rotations within US Equities: currently the sectors experiencing the largest inflows compared to their averages include Large Cap and Broad Debt, while outflows are being seen in Broad Equity and Health Care.
Over the last 20 days, we have generally seen the S&P index outperform the signals from global assets correlated to risk sentiment. The S&P has outperformed the model by +2.25% cumulatively during the period.
5 Hours ahead of the NY Open, our cross-asset model indicates a +0.10% gain for the S&P (while futures are down -0.11% since prior close). The signal from Rates is most bullish (+0.13%), while the signal from FX is least bullish (+0.06%).