#EXEXapplication is already working! Download, install, and go trading!
🚩AppStore for Apple & IOS: https://t.co/PngO0074yX
🚩GooglePlay market: https://t.co/4fld0Q0zPp
#EXEX is an easy and safe way to increase your income! JOIN!
#BTC#Investments#earncrypto#EXEXplatform
What is the Hanging Man? 🤔
It's a single candlestick pattern found in uptrends and indicates a potential reversal. Picture this: a small body at the top of the trading range, with a long lower shadow and little or no upper shadow. It looks like a… https://t.co/MMuQVlcROf
Today, let's delve into the world of trading indicators and shed some light on the Relative Strength Index (RSI) – a game-changer in market analysis. 🚀
RSI is like a compass guiding us through market fluctuations, and understanding its zones can make… https://t.co/y1qbsm1m3k
Ever wondered how to catch the wave of an Uptrend? 🚀 Let's decode the art of spotting this upward momentum for profitable trading. Here's your guide:
💡 Higher Highs: Keep an eye on successive peaks. In an Uptrend, each high should be higher than the… https://t.co/HGdXpC0ToR
Let's dive into the art of trading with a spotlight on CONFLUENCE, a key ingredient in making well-informed decisions. Today, we're unlocking the secrets behind a powerful trading setup – the Confluence Trade with the Hammer Candlestick! 💹
1️⃣ 4th… https://t.co/606V2VfSSR
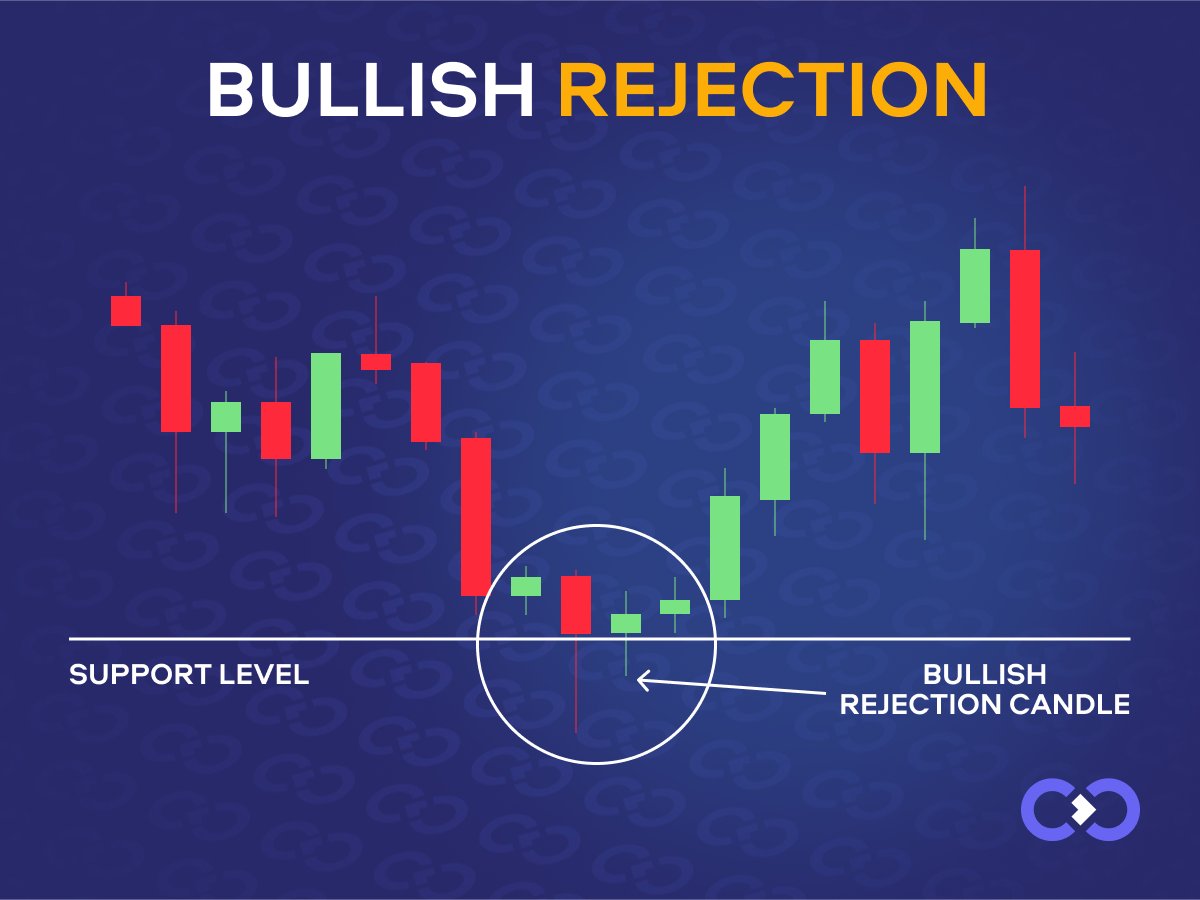
Today, let's delve into the Bullish Rejection strategy, where the market rejects a downtrend, signaling a potential upward reversal. Here are a few steps on how to capitalize on this moment👇
1️⃣ Spotting Rejection: Identify the moment when the price… https://t.co/20avaIj32A
Today, let's explore various entry strategies for trading the Head & Shoulders pattern. The approach you choose depends on your trading style and risk tolerance 💡📉
1️⃣ Aggressive Early Entry with Trendline Retest: Enter after an early breakout of… https://t.co/vUmdVKbl2k
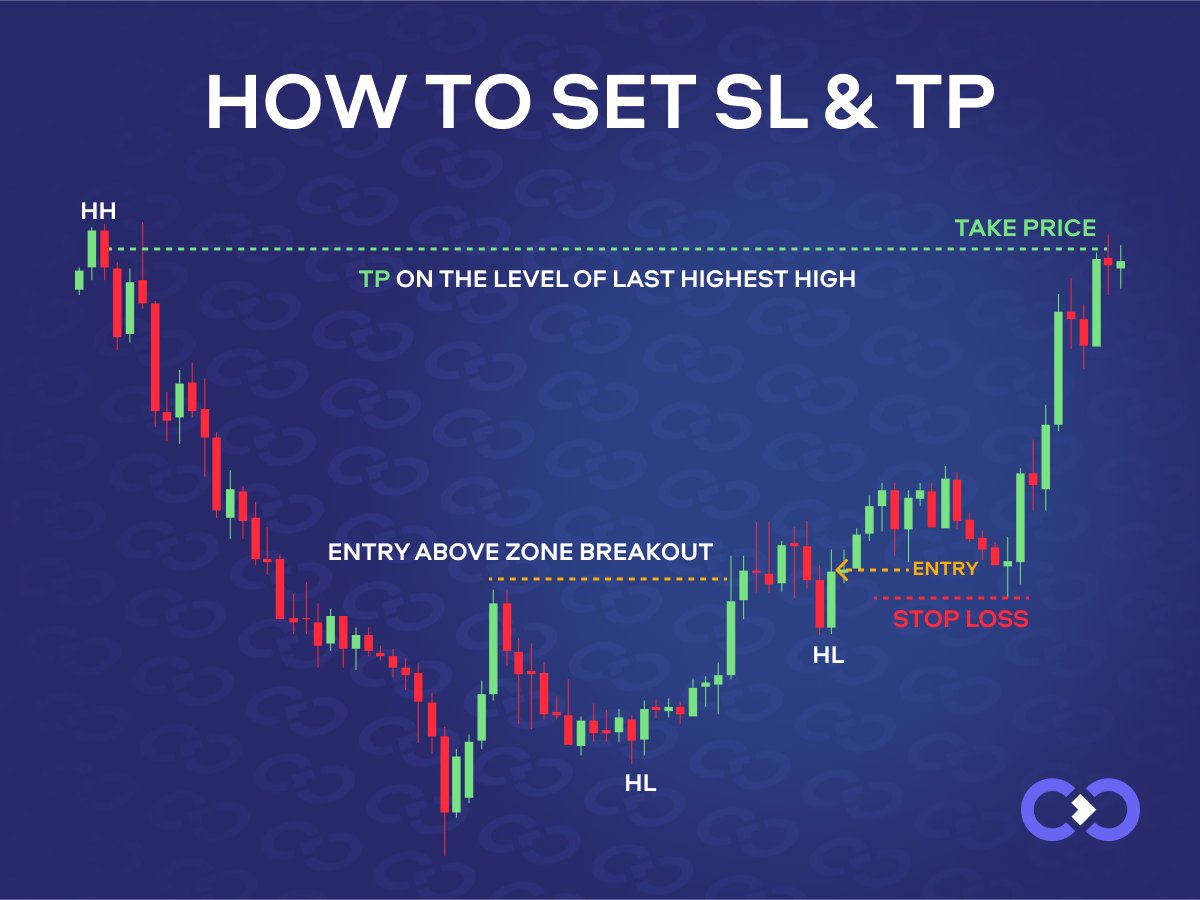
Today, let's delve into a crucial aspect of trading – setting Stop Loss (SL) and Take Profit (TP) using the Break and Retest strategy. This method revolves around breaking and retesting market structure, confirmed by support/resistance zones with wick… https://t.co/XyYMdlTADx
1️⃣ Major Support & Resistance: Pillars of Strength! 🏛️
Major levels are like bedrock – robust and influential. Identify major support as areas where the price historically bounces up, and major resistance as levels where it struggles to break… https://t.co/8Rr9lpINrp
1️⃣ Aggressive Entry 🚀
Ready for momentum? Enter right after a breakout. Set a tight stop-loss below the breakout point for risk management. Aim for a dynamic take-profit based on the new trend's potential. 📈🎯
2️⃣ Confirmation Entry ✅
Prefer… https://t.co/0HtW4b2tG1
1️⃣ Descending Triangle:
This pattern signifies the strength of a bearish trend, where prices test a support level. Paying attention to the breakdown of the lower line is a crucial moment that may foreshadow a potential acceleration downward.
2️⃣… https://t.co/SyQMwUIU7N
🔍 What are Retest Chart Patterns?⠀ Retest patterns occur when the price returns to a significant level it previously broke through, testing it as support or resistance before continuing its trend. These patterns often signal potential entry or exit… https://t.co/kfHa3zxqmQ
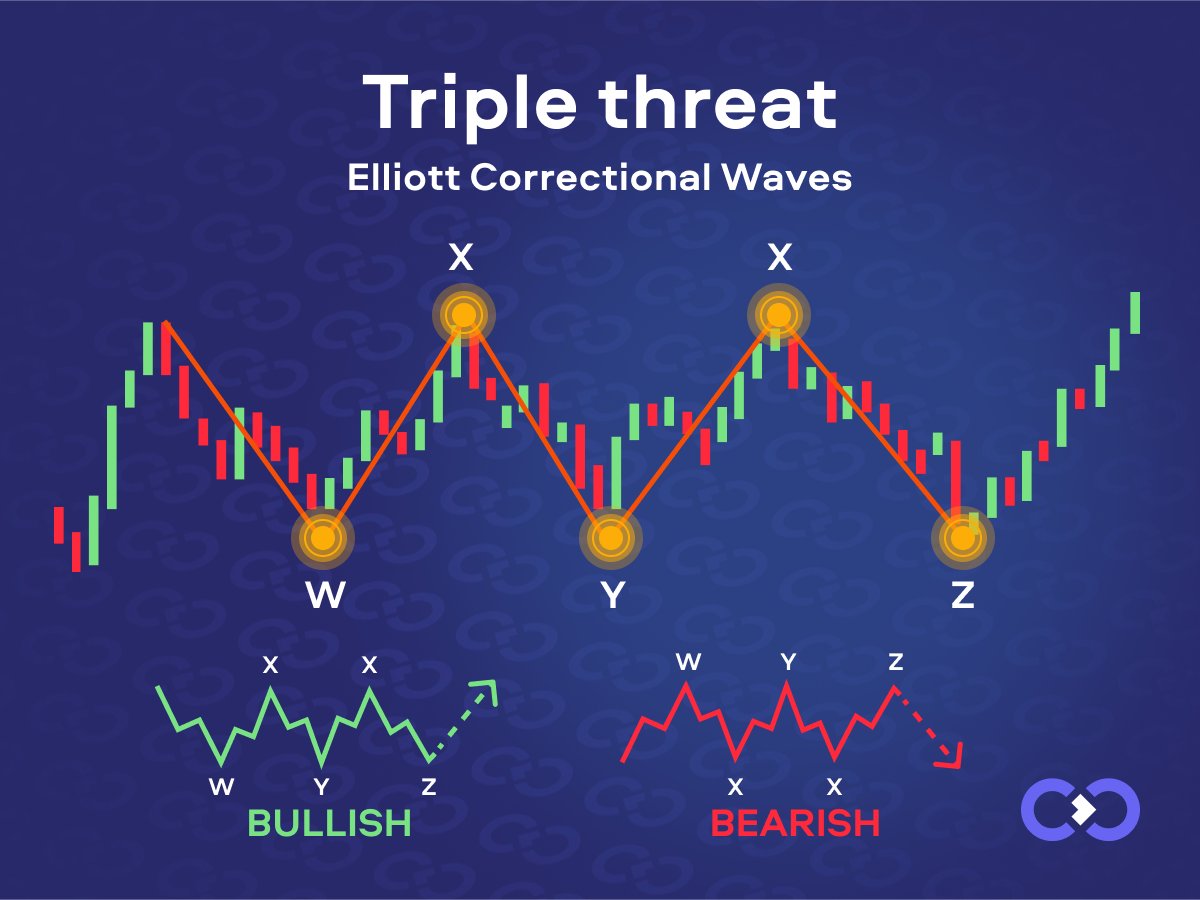
🔍 What are Triple Threat Elliott Correctional Waves?⠀
These waves are a subset of Elliott Wave Theory, delving deeper into corrective price action. They consist of three corrective waves within a specific correctional structure – zigzags, flats, and… https://t.co/EolTRXtyTt
🔍 What are Bollinger Bands?⠀
Bollinger Bands consist of a middle line (typically a moving average) and two outer bands that dynamically adjust based on market volatility. They showcase potential price levels and volatility ranges.⠀
⚙️ How to use… https://t.co/sxFyrIaQkt
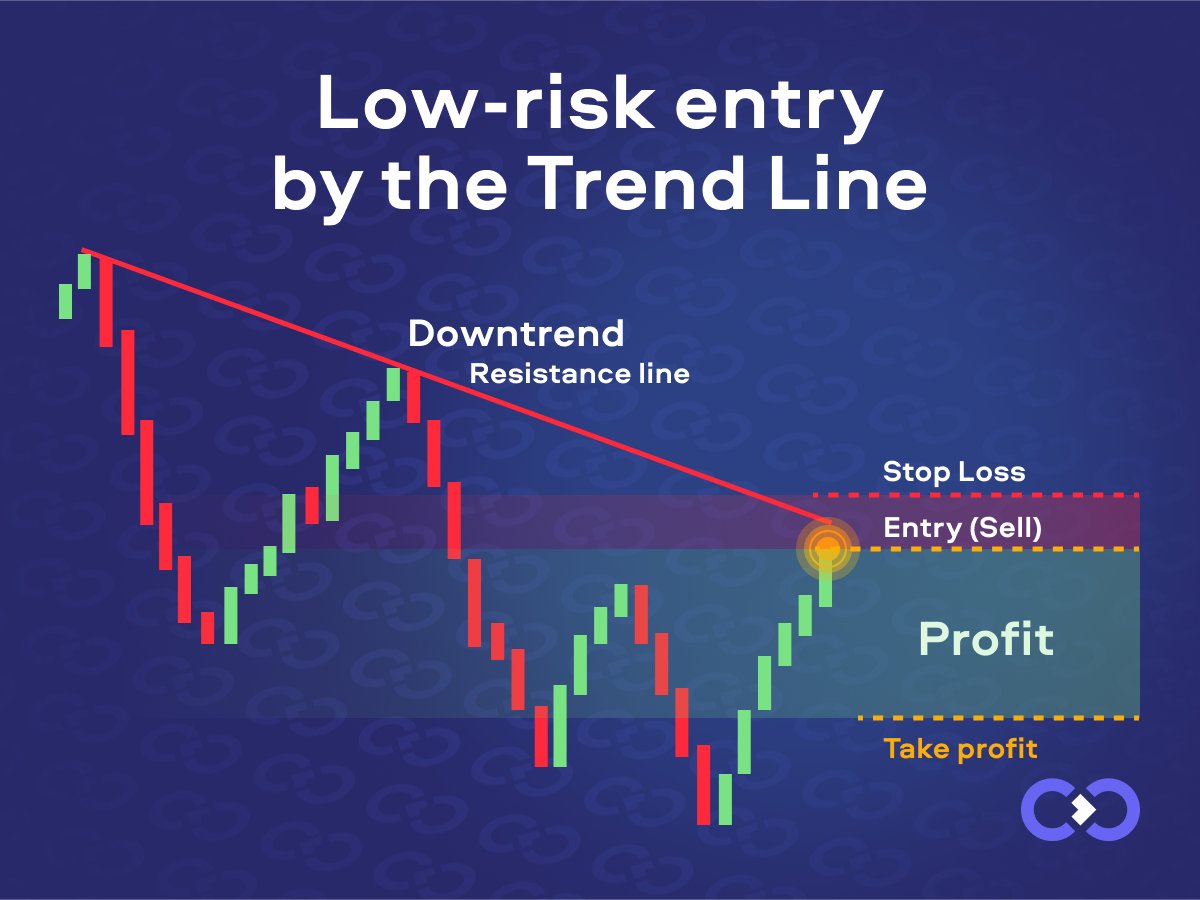
Trend lines act as a map guiding us to find entry points into the market with minimal risk. They reflect the price direction, helping identify moments when a trend is maintained or altered.
Understanding that trend lines not only indicate direction but… https://t.co/8c868SGs5O
The concept of compression in trading acts as a magnet, drawing traders' attention as it holds the keys to understanding market dynamics. It revolves around the idea that markets typically oscillate between periods of high and low volatility, forming… https://t.co/7U9NMKRhjt
The Morning Star is a pivotal pattern used in technical market analysis. This pattern consists of three candles and typically emerges during a trend reversal.
It's crucial to remember that the Morning Star should be confirmed by other indicators and… https://t.co/Zw6mDCwQ4i
There are two primary types:
1️⃣ Regular Divergence: This occurs when price forms higher highs or lower lows while the indicator shows the opposite. It could signal a potential trend reversal.
2️⃣ Hidden Divergence: Here, the price makes a higher… https://t.co/wJAErcZM4g
Understanding bullish Candlestick patterns is key when navigating an upward trend in the market. These patterns can provide insights into potential entry points or the continuation of an ongoing upward momentum.
Recognizing these patterns can help you… https://t.co/HEMBC4K6r8
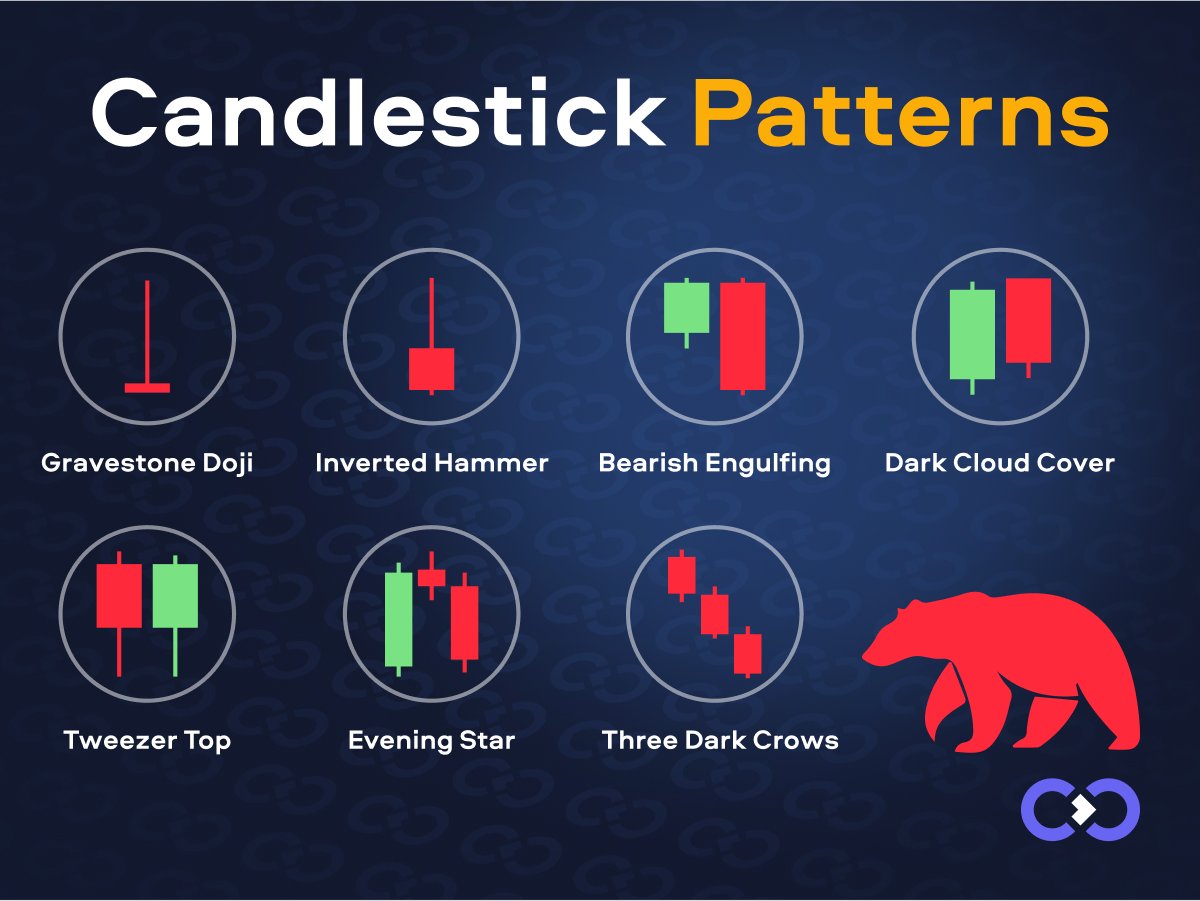
Bearish Candlestick patterns are powerful tools for analyzing the market during a downward trend. They help identify potential reversal points or continuations of the current price movement.
Understanding these patterns will help you spot moments when… https://t.co/nHFii3LBiA