Democratizing Data Science by providing a simple & modern UI for data access, data wrangling, visualization, analytics, and reporting (dashboard & note).
Data Science has changed.
The old: Statistics × ML × Programming
The new: Statistics × AI × Prompt
We wrote a deep-dive on why this shift matters, and how Exploratory’s AI Function brings Generative AI into real analytics workflows.
👉 Read here: https://t.co/b1rrX6fzfb
Just published a blog post!
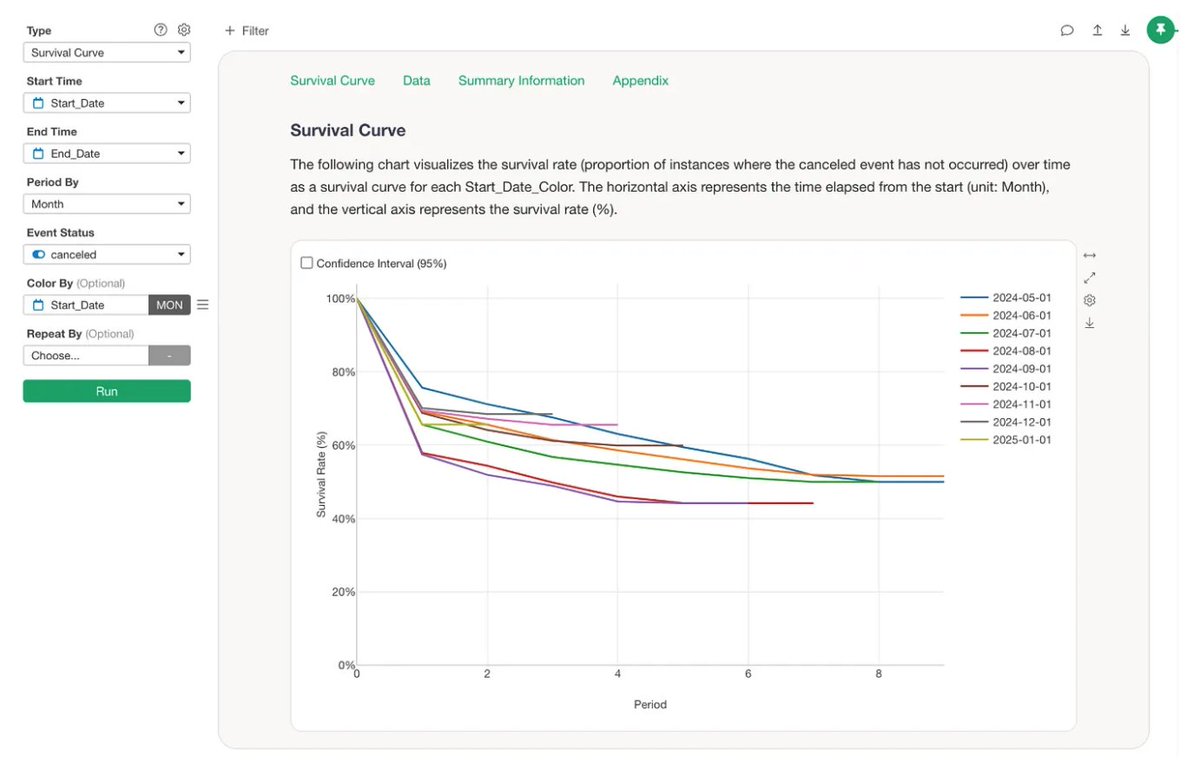
"The 5 Essential Charts for SaaS Growth (Beyond Just MRR)"
- Cohort Analysis
- Layer Cake Chart
- DAU/MAU
- Power User Curve
- RFV Analysis
https://t.co/oKevt6Q1ko
📊Struggling to keep your KPIs in check?
Exploratory’s Number Chart makes it simple to track metrics, compare against the past, and keep your team aligned.
Watch how!
We have released Exploratory v13.8!
The biggest enhancement is the performance improvement for Dashboard.
Not it's much faster!
https://t.co/rFfxaPljLW
5/
For other enhancements and bug fixes with Exploratory v13.5 / v13.6, you can check out the release notes: https://t.co/rjuNS7d1Qc
Upgrade Now to Exploratory v13.6!
https://t.co/6mJgTZ8G0I
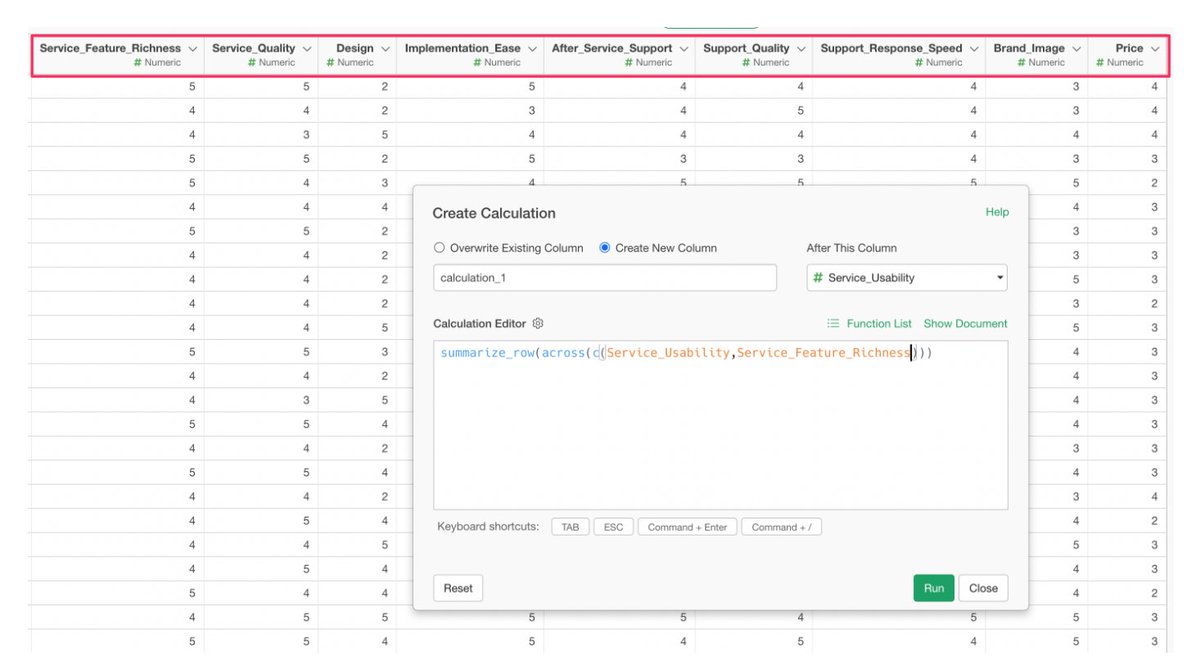
Last week, we introduced 5 essential SaaS KPIs
& demonstrated how you can create them quickly
with the new Data Wrangling with AI Prompt feature in Exploratory!
Check out the video!📺 (Link below ↓↓)
We released Exploratory v12.3 this week! 🎉
We added a new Preview pane for AI Prompt.
Got an error? Just click Auto Fix — and let AI resolve it for you! 🔥
Download & try it today!
https://t.co/6mJgTZ8G0I
#AI#DataScience#DataWrangling
🚀 Exploratory v12.3 is here!
New Preview Pane for AI Prompt — instantly see what your data will look like while you’re still in AI Prompt dialog.
Make data wrangling faster, smarter, and easier.
Try it today! 👇
https://t.co/6mJgTZ8G0I
#AI#DataWrangling