Markets are quiet at the moment, but anxious - like horses at the starting gate and ready to bolt. But unlike horses, we don't know which way. So it's a good time for reflection and the strategic thinking in this discussion.
https://t.co/S4WV9K1Hu1
The #USTreasury just issued 30-yr #Tbonds at a 5% fixed rate - first time since 2007. Chart shows long-term rates are rising slowly on gov'ts across the globe, which is bullish for #gold, the opposite of conventional wisdom, but look at the evidence. One of the greatest gold bull markets was the 1970s, which was a decade of rising #InterestRates. Then consider how gold began rising after the collapse of #SiliconValleyBank & others when rates rose post Covid. Now consider the logic. Higher rates mean lower #Tbond prices on existing #debt owned by banks, creating a gap between the declining value of bank assets & the unchanged amount of their liabilities. To bring their balance sheets into balance, liabilities have to shrink (think 1930's or #SVB) or asset values have to rise, i.e., the only asset that can rise is gold on central bank balance sheets, as my Fear Index shows. The chart suggests global rates are poised to go much higher, which is bullish for gold. Detailed explanation here: https://t.co/6ayeJgu1tL
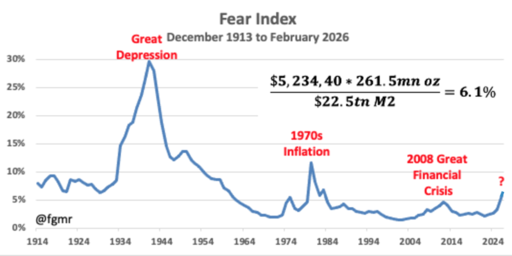
My #FearIndex ended February at 6.1%, the highest since Jan 1983 when #Volcker was saving the #dollar with sky-high #InterestRates to lower the 1970s double-digit #inflation. While this index has been rising for months, I used a “?” label b/c the fin’l crisis has not yet started or been named, unlike the 3 previous crises. Resist the temptation to put “war” as the label, even though there is plenty reason to be fearful. But war is not the reason the Fear Index is climbing. Note both World Wars had no impact. This chart starts at 1913 purposefully, the year the #FederalReserve was created. It is responsible for directly causing or failing to prevent the crises on this chart. #EndTheFed & eliminate all #LegalTender laws to allow currencies to compete, enabling the return to money of the #American #Constitution, #gold & #silver coin circulating digitally or hand-to-hand - or whatever else the buyer & seller agree, not what the federal gov't forces us to use.
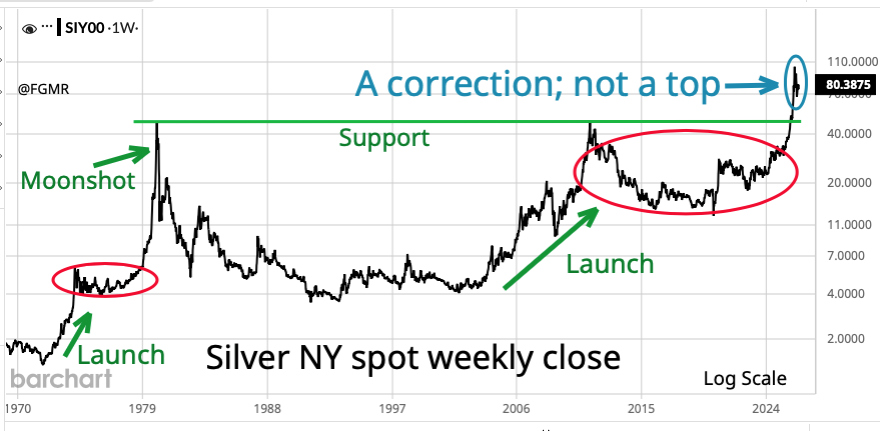
Updating this tweet from 3 weeks ago. "A 6.7% gain last week put #silver back above $80, concluding the 5th major test of support in the $70s since its record high price 15 weeks ago. Is it enough to restart silver’s uptrend? Or is more testing needed?"
Updated answers to those questions are: yes & no.
It looks like the uptrend is resuming; there may be more dips below $80, but likely to be short/quick - not like this 3-week one just ended. Overhead resistance in the gold/silver ratio above 60 looks solid, with the ratio now at 58.7. Look for it to start heading lower, with silver outpacing #gold, up 2.3% last week. Two things that haven't changed: 1) focus on the big picture revealed by this chart, which remains bullish, 2) there are no guarantees when it comes to markets.
A 6.4% gain last week put #silver back above $80, concluding the 4th major test of support in the $70s since its record high price 12 weeks ago. Is it enough to restart silver’s uptrend? Or is more testing needed? More dips below $80 are likely, as are more tests of overhead resistance above 60 in the gold/silver ratio, now at 59.8. But the outlook is bullish for both silver & #gold, up 1.8% last week.
Focus on the big picture revealed by this chart. The bullish factors are (1) multi-year consumption of aboveground stocks because annual mine supply is less than what it used by industry & (2) the multi-decade accumulation of silver by strong hands saved by people to protect their buying power.
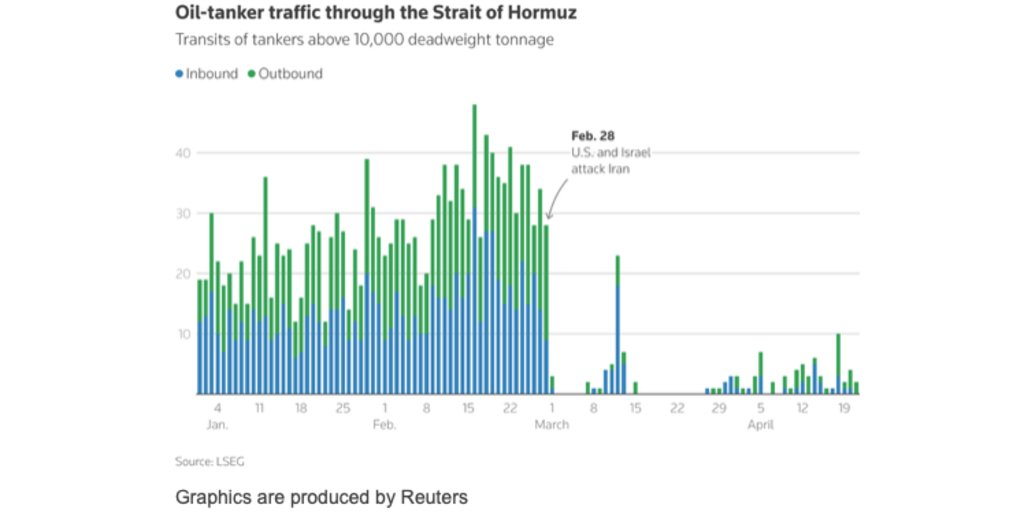
Shortages are starting to appear & the prices of #diesel #jetfuel #fertilizer & #gas are climbing in a normal market response reducing demand as available supply tightens. The last tankers to leave #Hormuz before the war started have arrived & unloaded their crude #oil. There are next to zero ships leaving the gulf to refill storage tanks. Last week #WTI crude #oil rose 12.6%. The global economy needs #Hormuz to open now before shortages worsen, driving prices higher.
In 20 weeks the #FederalReserve has eased by $171.6bn. From its creation in 1913, its total assets have grown from zero to $6.7tn. In 1913 $20.67 could be exchanged for an ounce of #gold, the same rate as in 1792 when Pres Washington signed the Mint Act. It now takes $4,727 to exchange for that gold oz. Therefore, Fed easing = #dollar debasement = higher gold. #EndTheFed
Don't trade; accumulate. All markets have risk, even when volatility is low. That's why since launching #Goldmoney in 2001 I have consistently recommended a strategy of dollar-cost averaging to accumulate physical #gold & #silver too if you are willing to accept the risk/volatility that comes with silver. It is a strategy based on value. Accumulate undervalued assets, sell overvalued assets, which gold will someday again reach like it did in 1974 & 1980. My #FearIndex provides a useful valuation guide.
@FGMR based upon the end of year projections I think I will just hold my position and not try to trade this volatility. Its too risky knowing where we are going.
A 6.4% gain last week put #silver back above $80, concluding the 4th major test of support in the $70s since its record high price 12 weeks ago. Is it enough to restart silver’s uptrend? Or is more testing needed? More dips below $80 are likely, as are more tests of overhead resistance above 60 in the gold/silver ratio, now at 59.8. But the outlook is bullish for both silver & #gold, up 1.8% last week.
Focus on the big picture revealed by this chart. The bullish factors are (1) multi-year consumption of aboveground stocks because annual mine supply is less than what it used by industry & (2) the multi-decade accumulation of silver by strong hands saved by people to protect their buying power.
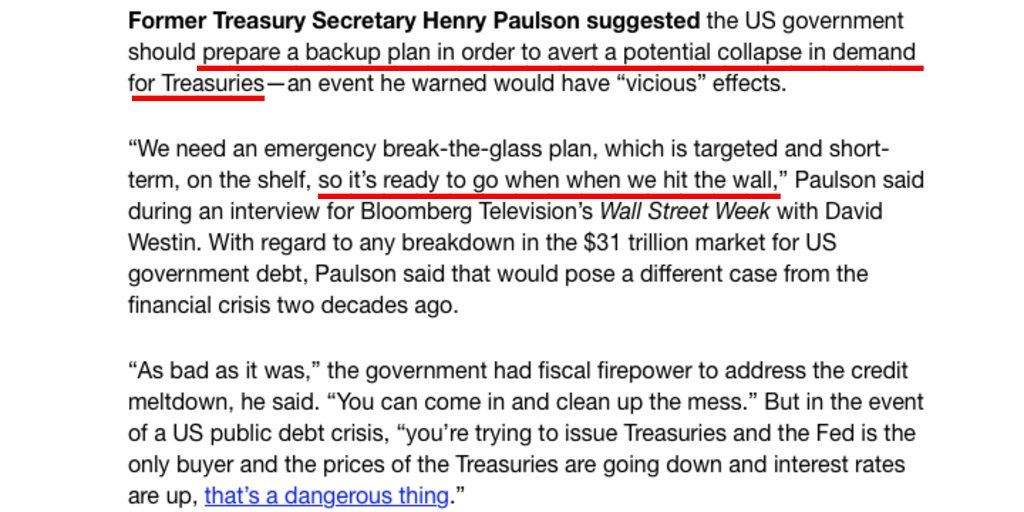
Don’t ignore this warning from former Treasury Secretary #HenryPaulson. If the gov’t should be preparing, so should you. Here’s my analysis of the US govt’s financial position & the inescapable math of #overindebted gov’ts. Own physical #gold#silver to help prepare.
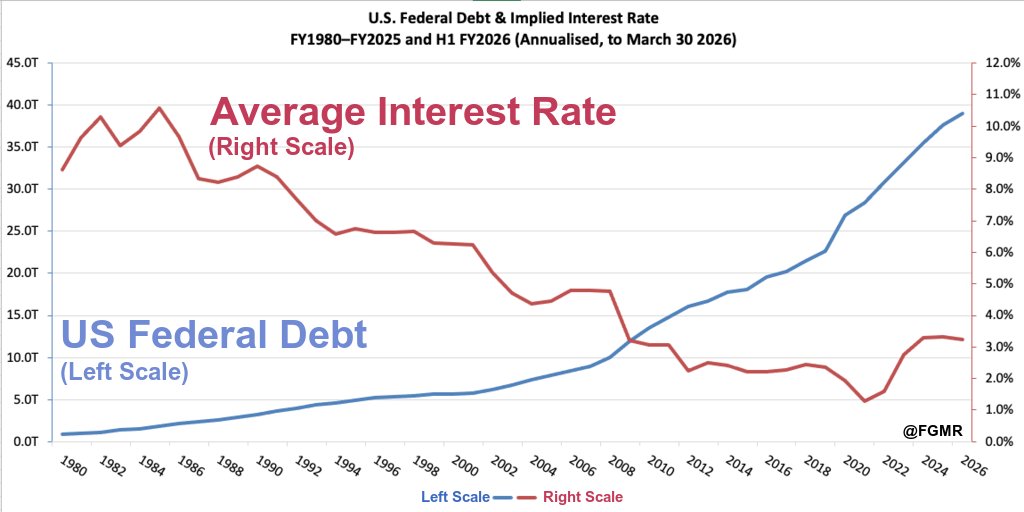
This chart reveals how the #US#government managed to increase the national debt by 43X from $908 billion in 1980 to $39 trillion (and growing) with only an18X increase in the amount of interest paid by it annually on the debt. That trick ended in 2020 when interest rates could not be manipulated any lower by the #FederalReserve & started rising. An overindebted US gov’t is now hurdling toward the #TippingPoint, historically the mathematical trigger to #monetary chaos & gov’t #insolvency when interest expense is more than 30% of revenue, as explained here:
https://t.co/3HeysAbZdr
Is #Bitcoin about to launch into Step 5? Note the symmetry of its recurring accumulation patterns in this weekly chart.
Remember the hype that surrounds #BTC each time it was at a new high, most recently last year when it was $120k/#coin? Since then attention to it dropped with its #price but what hasn't moved is #BTC's potential as a game-changer in cross-border #currency & #payments (usefulness > demand > #value). Recent news about #Hormuz refers to #crypto being used but fails to mention BTC, which is the best crypto for secure payments.
Let’s see if BTC holds support at $60k & then breaks above the 6-month downtrend line. If it does, that might be a signal for the beginning of a new uptrend into Step 5, the odds of which improve if BTC closes above $76k, last month's high.
Near record 1-day drop in Brent #oil is welcome relief to soaring prices. Both #Brent & #WTI are up +40% ytd. Hopefully ceasefire holds until peace is agreed. But even if it does, infrastructure rebuilding likely means to expect oil $90-to-$100 for now, but eventually higher.
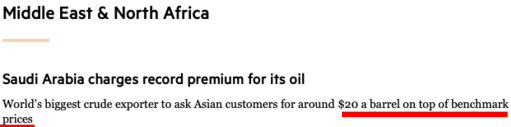
A $20 premium puts #Saudi#oil above $130/barrel. More evidence of 2 oil markets - one for actual barrels of oil for refining into usable product. The other for paper barrels for trading & gov't propaganda, based on promises for future delivery. Same is true for #gold#silver.
The real #Brent#oil#price is $141. Hat tip to this journalist for explaining there is a difference between paper prices that are just a speculative promise vs the real price, & also the difference between actual ownership v promises. The same observation applies to physical #gold #silver. Own the real thing to avoid counterparty #risk.
The real #oil price rise shows no sign of letting up. Supply disruption is real. Next - look for today's severe backwardation in oil to diminish as markets begin to grasp the long-term implications to supply from infrastructure damage in the Gulf countries & amount of re-building needed once the fighting stops.
One of the biggest expenses for #PreciousMetal#miners is #energy. Given the likelihood that #oil costs will rise in the months ahead & that #gold's #PurchasingPower of oil is near historic highs, miners should be thinking about buying forward their oil needs, just like airlines do. #WTI for Dec2026 closed Friday at $77.36 & Dec2027 is $70.96, low prices that will lock in future expenses at attractive levels. Don't hedge revenue, which is a proven mistake. Instead hedge operating costs.
Since the 2008 #GFC, we've been living in an era of cheap #oil, when measuring its #price by nature's #money, which is #gold. Using gold money is the best way to make sense of prices, as this log scale chart shows. There are 2 eras: #GoldStandard & the fiat #currency era of the #dollar & other national #currencies which we have been using in #commerce & struggling with since 1971.
The stark #volatility in the oil price after 1971 clouds #economic decisions, impairing commercial & investment activity. Instead of the narrow, steady 70-90oz Gold Standard range responding to oil's changing supply/demand conditions to buy 1k barrels of oil, prices fluctuated between 30-155oz, but note the decline since 2008 to as low as 11oz in the #RealPrice of oil.
Cheap oil has created illusions of prosperity - the gap between how things appear (phony prices) & how things actually are (real costs, i.e. once oil is used, it’s gone). This gap has already begun narrowing as oil prices rise.
Assuming 80oz is the normal gold money price for 1k barrels of #WTI oil, we can project oil in #USD terms as follows:
($4500/oz * 80) / 1000 barrels = $360 per barrel
Other gold prices can also be used (like my $5833 projection for 2026):
https://t.co/aZQ1Pj6GpI
($5833 /oz * 80) / 1000 barrels = $466 per barrel, or to take a lower gold price
($2500 /oz * 80) / 1000 barrels = $200 per barrel
We can't predict the future but we can see oil is cheap regardless of the gold price used to measure the #EconomicValue & natural price of 1k barrels of oil.
Last week both #PreciousMetals broke below their initial support: $5000 & $80. The possibility of a deeper correction cannot be ruled out, but both are now very oversold having declined 8 consecutive days. That's a rare occurrence, so it's reasonable to expect a bounce this week.
Has the war damaged the fundamental outlook for gold & #silver? The reasons for owning physical gold & silver remain strong. Oil is being re-priced to become more expensive regardless how it is measured: in fiat currency or gold money. But only the latter is a tangible asset with no counterparty risk, which is a unique feature that makes gold & silver the preferred ways to hold your #PurchasingPower in these uncertain and unpredictable times.
Don't miss this @JayMartinBC interview with @LukeGromen & @ttmygh who are superb macro-analysts. Essential food for thought given the war & the message about #energy it's sending. In my view physical #gold#silver are needed now more than ever.
https://t.co/W4xuduSrNG
If America is the most powerful country on the planet, and has the most dominant military the world has ever seen, how come they can't open the strait of Hormuz?
I sat down with Grant Williams and Luke Gromen to unpack the real implications of escalating conflict in the Middle East and what this means for the global economy, and your portfolio.
@LukeGromen@ttmygh
My latest thoughts on #gold#silver#oil prices & #PreciousMetal#miners in a discussion with KWN on Friday. Also covered how the global #economy suffers as an era of cheap oil & low-cost #energy ends.
https://t.co/HZMC59v1vW
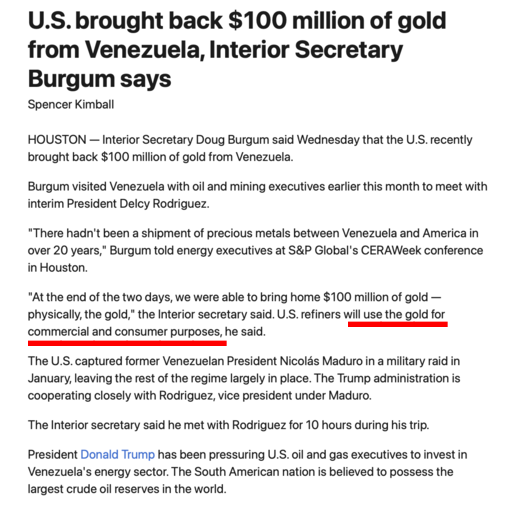
Just like absolute monarchs used to do in medieval times. Cross the border & loot the neighbouring country's #Treasury of its #gold but now with a new twist - use "the gold for commercial and consumer purposes", ironic given it’s #money in the American #Constitution.
https://t.co/Skum5y8qfg
An insightful article by @KingKong9888 explaining how the #oil trade is being de-dollarized. While the #Petro-dollar is in decline, the Chinese #yuan & nature's #money (#gold) benefit.
https://t.co/YjYwlNd8O7
Since the 2008 #GFC, we've been living in an era of cheap #oil, when measuring its #price by nature's #money, which is #gold. Using gold money is the best way to make sense of prices, as this log scale chart shows. There are 2 eras: #GoldStandard & the fiat #currency era of the #dollar & other national #currencies which we have been using in #commerce & struggling with since 1971.
The stark #volatility in the oil price after 1971 clouds #economic decisions, impairing commercial & investment activity. Instead of the narrow, steady 70-90oz Gold Standard range responding to oil's changing supply/demand conditions to buy 1k barrels of oil, prices fluctuated between 30-155oz, but note the decline since 2008 to as low as 11oz in the #RealPrice of oil.
Cheap oil has created illusions of prosperity - the gap between how things appear (phony prices) & how things actually are (real costs, i.e. once oil is used, it’s gone). This gap has already begun narrowing as oil prices rise.
Assuming 80oz is the normal gold money price for 1k barrels of #WTI oil, we can project oil in #USD terms as follows:
($4500/oz * 80) / 1000 barrels = $360 per barrel
Other gold prices can also be used (like my $5833 projection for 2026):
https://t.co/aZQ1Pj6GpI
($5833 /oz * 80) / 1000 barrels = $466 per barrel, or to take a lower gold price
($2500 /oz * 80) / 1000 barrels = $200 per barrel
We can't predict the future but we can see oil is cheap regardless of the gold price used to measure the #EconomicValue & natural price of 1k barrels of oil.
Last week both #PreciousMetals broke below their initial support: $5000 & $80. The possibility of a deeper correction cannot be ruled out, but both are now very oversold having declined 8 consecutive days. That's a rare occurrence, so it's reasonable to expect a bounce this week.
Has the war damaged the fundamental outlook for gold & #silver? The reasons for owning physical gold & silver remain strong. Oil is being re-priced to become more expensive regardless how it is measured: in fiat currency or gold money. But only the latter is a tangible asset with no counterparty risk, which is a unique feature that makes gold & silver the preferred ways to hold your #PurchasingPower in these uncertain and unpredictable times.