@HKIStrategies I mean, it MUST be counted as a 5 wave move. Either for Wave A for lower prices or Wave C to start another push higher after a expanded flat correction.
Do you see other bullish indications that price has the potential to form another high?
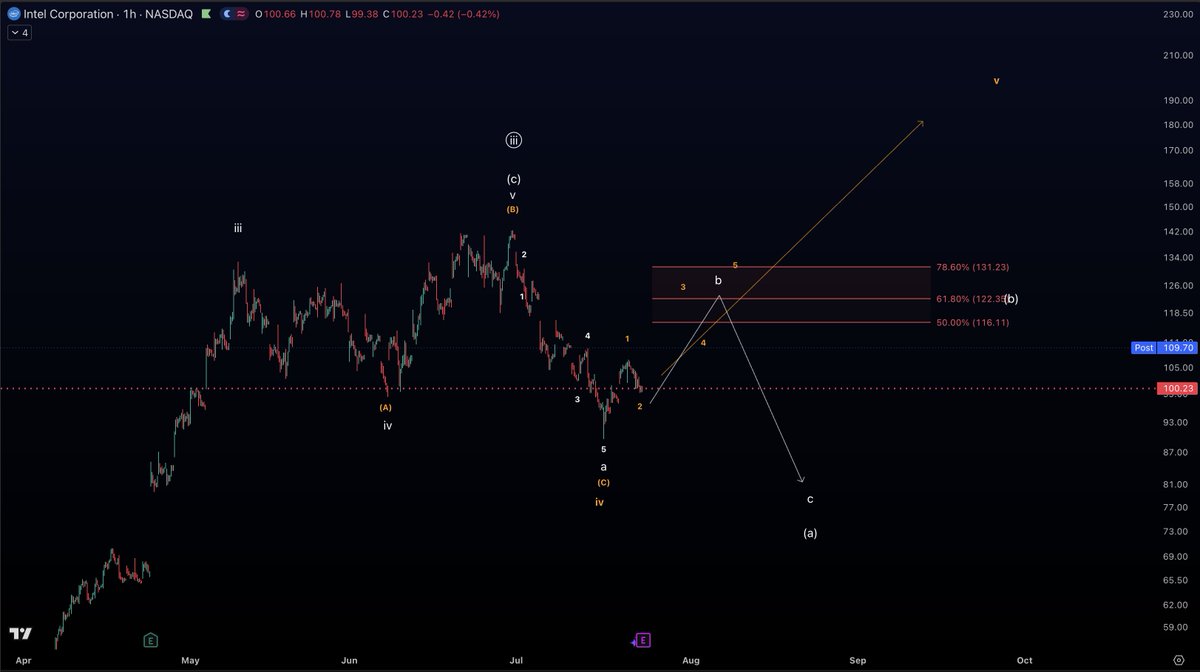
$INTC is pumping in the after hours session following its earnings release.
A move higher was expected, either as a Wave B in the white count or as the start of the orange Wave 5 to the upside.
To confirm that price is ready to form orange Wave 5 it needs to develop a clear 5 wave move to the upside during the upcoming sessions while breaking above the red resistance zone.
As long as price remains below that resistance, I'm still leaning toward the white count which suggests a larger pullback.
Adjusted the count for $XCUUSD $COPPER.
Price has dropped back below the white breakout trendline.
The main thesis remains unchanged: price is still working on a fifth wave within a larger Wave C to the upside. Due to todays deep pullback I'm now counting this structure as an ending diagonal.
I do want to warn that the entire move to the upside looks very corrective so a larger Wave B at this point cannot be ruled out. If price drops significantly lower and forms a clear 5 wave decline, the orange count will come further into focus.
$XCUUSD $COPPER managed to break out once again and may now be forming Wave 3 of Wave 3 to the upside.
This internal Wave 3 should at least reach the 136% extension, located around $6.71.
Copper has been following the white count perfectly so far.
Very nice pump on $HIMS.
Price managed to hold the Wave 4 support zone and is now likely on its way to forming Wave 5 of white circled Wave 3.
A reclaim of the white trendline is needed as further confirmation for that thesis.
This is not looking good for $NOW.
After the pre market pump earlier today, price was sold off on very high volume and has fallen back below yesterdayss low.
If price continues to decline and breaks below the white support zone, orange circled Wave 2 has likely topped and this bearish Cup and Handle pattern may begin to unfold.
$CRWD has reached the Wave 4 support zone that I highlighted in my previous update.
Price has developed a more impulsive decline than I initially expected, although I still count it as Wave A.
Based on the current proportions a test of the 38.2% retracement at $169 in Wave C of this Wave 4 correction appears very likely.
Tricky situation on $MSFT - please read carefully.
After a failed breakout, price is now falling back aggressively into the range.
The white count remains valid but has been relabeled to show white circle Wave C to the upside as a diagonal. For this scenario to remain likely, price must find support within the white support zone between $372.28 and $358.97 before starting another ABC advance to the upside for Wave 3 of the diagonal in white circled Wave C.
The orange count is simpler and suggests that the larger orange Wave B topped at the end of May, with price now starting orange circled Wave 3 of Wave C to the downside.
If the orange micro 5 wave move to the downside develops as shown on the second slide and is followed by a corrective move higher, it would provide further confirmation of the orange count.
$DIS is approaching the invalidation level of the white 1-2 setup for a direct move to the upside.
If price breaks below the blue line the next support zone is located between $87.99 and $84.31.
The turquoise scenario suggests that a broader Wave B would unfold as a WXY correction if the blue line is broken which should ultimately still lead to higher prices in white circle Wave c.
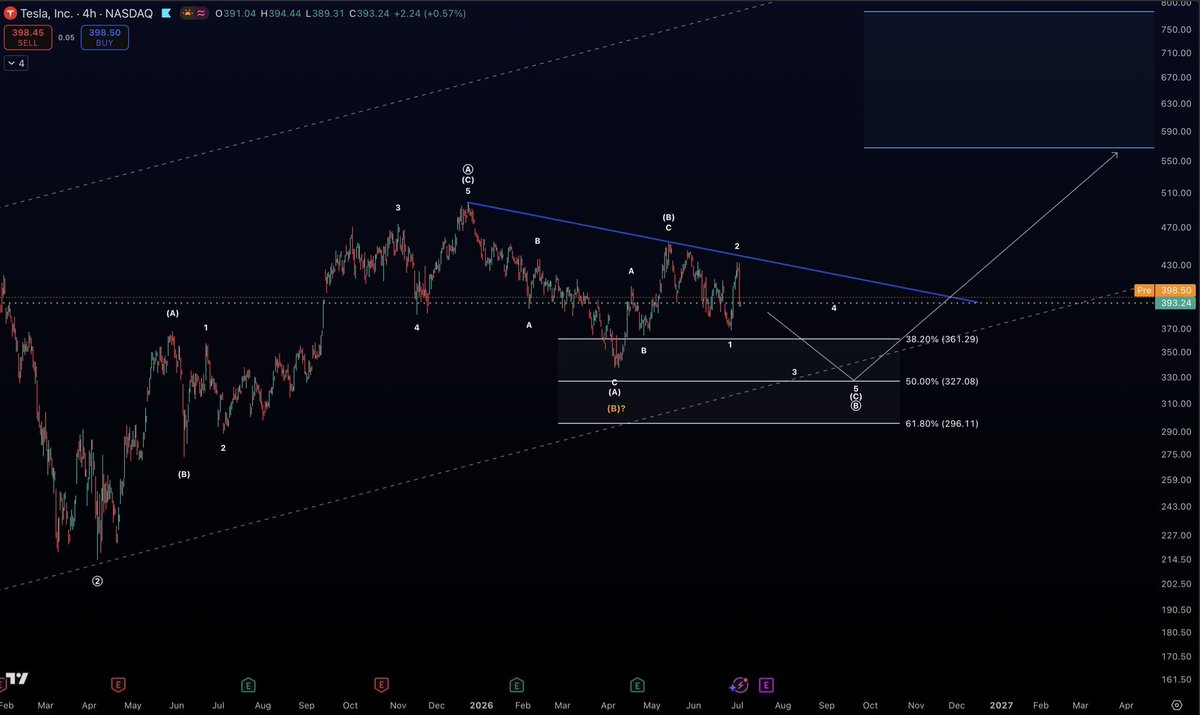
White count confirmed for $TSLA.
Price is currently working on Wave C to the downside to complete this larger Wave B correction which should be followed by a larger Wave C rally to the upside.
Watch the white support zone between $327.08 and $257.01.
It is likely that $GOOG has started white Wave C to the downside.
The ideal target for this Wave 4 correction is the 38.2% retracement of Wave 3.
Nevertheless, the 100% extension of Wave A which is also an ideal target for Wave C is located at $308.94. So $308.94 is an important level to watch at least for a larger bounce.
$TTE (Euronext Paris)
Wave 3 continues to push higher and is now approaching the 136% extension which is the minimum target I previously outlined for Wave 3.
1-2 setup / Cup and Handle breakout - a perfect setup.
One more high is needed to complete white Wave C of the Wave 4 bounce.
Price is still holding micro Wave 4 support which should ideally lead to one more leg higher in Wave 5.
If price breaks below that support zone and forms a micro 5 wave move to the downside, probabilities shift back toward the orange count where orange Wave B may have already topped.
$XAUUSD
$GOLD
It looks like $TSLA continues to follow the white count suggesting another low in Wave C before the next major rally.
This Wave C may be unfolding as a diagonal structure.
The orange count remains valid. A break below the April 7 low at around $337 would significantly reduce the probabilities of that thesis.
Is $TSLA preparing for another leg up?
While the Elliott Wave count suggests one more low into the white support area, price has formed a bullish CVD divergence. As long as price holds above $337.60, this divergence remains valid.
If price manages to break above the blue trendline from here the ideal target for that Wave C sits around $782.
I’ll keep you updated.
Another low in the white count is needed to further confirm that white Wave B has topped and that $HOOD is now starting Wave C to the downside.
Note: The entire rally from the March 30 low is expected to be corrective.
Only if price manages to form another high in orange Wave 5 and breaks above the red resistance zone would this thesis be called into question.
Were the earnings the catalyst needed to start the next strong rally to the upside?
$NOW found support just above the 78.2% retracement level yesterday, shortly before the earnings announcement.
Strong earnings and an optimistic outlook sent the stock up roughly 8% in the after-hours session.
If price can hold above yesterdays low at around $94.75 it could now be starting either white Wave 3 or orange Wave C to the upside.
$NKE failed to break out of the triangle in a direct Wave C advance.
In my previous update I mentioned that if price broke below the triangle the overall thesis would remain valid as long as price found support within the white support zone between $42.52 and $41.09.
From there, A 5 wave move up for Wave C would be favorable.
If price breaks below that support today, white Wave 5 may continue to unfold in a more direct manner as an ending diagonal which I will then share with you.
Had to adjust the micro count on $SPCX again as price once more failed to produce a larger Wave 4 bounce.
While the Elliott Wave count is still incomplete, price is now approaching the 100% extension of Wave A, the first ideal target for Wave C.
At this stage I expect at least a bounce in orange circled Wave 4 from that area. From an Elliott Wave perspective another low remains the more likely outcome.
If price manages to form a clear 5 wave advance from that area, it could be an early indication that a larger bottom is in place.