This topic is not new, but this Bloomberg chart illustrates the combined free cash flow of the four biggest hyperscalers, Meta, Google, Microsoft, and Amazon nicely, peaking near $100 billion per quarter in 2024 before sliding steadily lower through 2025. Forecasts now point to a dramatic collapse into negative territory in the coming quarters of 2026, with combined free cash flow expected to turn negative for the first time since early 2023, driven largely by heavy spending from Amazon and other players. This marks a sharp reversal from the massive cash generation these companies posted throughout 2024, when quarterly totals repeatedly topped $90 to 100 billion thanks to strong contributions across all four names. For followers, this dwindling and soon negative cash flow trend is a big deal to watch, since it suggests these tech giants are pouring unprecedented sums into capital investment, likely tied to artificial intelligence infrastructure, even as it squeezes the cash they have left over for buybacks and dividends. $META $GOOGL $MSFT $AMZN
We think this bond offers a fair way to get paid as a well-known consumer-products turnaround plays out in real time. The company has been the subject of plenty of skepticism for years, and rightly so given the leverage load it still carries, but the first quarter of 2026 gave the clearest signal yet that the operational fixes are showing up in the numbers rather than just in slide decks. At a yield to maturity near 6.2% and a spread of almost 200 basis points over the 5-year Treasury, the notes pay a coupon that sits on the lower end of what a single B-rated, still highly levered issuer would normally need to offer, so we want to be upfront that this is not a name to load up on. Think of it as a modest, well-sized sleeve position rather than a concentrated bet on the turnaround finishing on schedule.
Good Carry in a Credit Turning the Corner https://t.co/JtgMSscQju
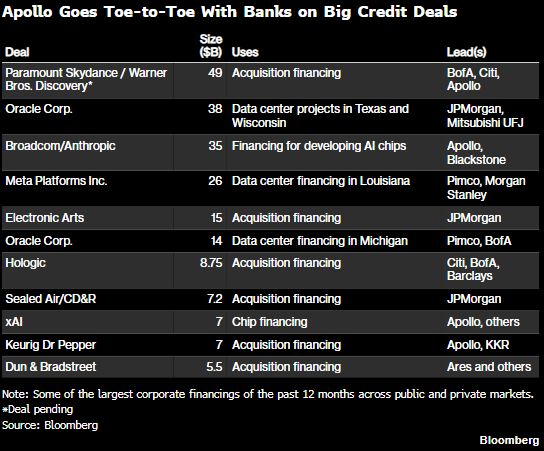
This Bloomberg table captures a defining trend of the current credit cycle: private credit firms, led by Apollo, are now competing directly with the biggest Wall Street banks on the largest and most complex corporate financing deals. The past 12 months have seen transactions spanning media consolidation, AI infrastructure buildout, and traditional M&A, with deal sizes ranging from 5.5 billion dollars to 49 billion dollars for the pending Paramount-Skydance and Warner Bros. Discovery merger. Apollo appears as a lead lender on multiple marquee deals, including Broadcom/Anthropic at 35 billion dollars, xAI chip financing at 7 billion dollars, and Keurig Dr Pepper at 7 billion dollars, illustrating how alternative asset managers have moved beyond niche lending to claim a permanent seat at the table alongside JPMorgan, Bank of America, and Citigroup. For followers, this blurring of the line between banks and private credit is one of the most consequential structural shifts in modern finance, raising important questions about systemic risk, regulatory oversight, and the future of traditional investment banking. $APO $JPM $BX $KKR $MS $ARES $BAC $ORCL $WBD $PSKY $EA $META $AVGO
We have identified a fixed-to-float subordinated note from a mid-Atlantic commercial bank with the second-largest deposit market share in its home state, and a credit history that survived the global financial crisis with peak charge-offs below 0.65%. At current prices, the yield to the first call date sits near 6.5%, with a spread of approximately 230 basis points over comparable Treasuries. Yield to maturity is closer to 7.8%. Neither number is accidental. The market is discounting the complexity of the fixed-to-float structure and assigning a subordination premium that, in our view, overcompensates for the actual credit risk. The bank behind this note posted a 16+% return on tangible common equity in its most recent quarter. Net charge-offs ran at 6 basis points. The capital ratio has been built up from a post-merger trough over roughly six quarters. This is not a stressed credit.
Attractive Risk-Adjusted Return with Built-In Duration Protection https://t.co/noF5lj9nCN
A review of our PFF rebalance estimates from last week. We projected 7 additions and 0 deletions. We also estimated material selling pressure due to the fund’s smaller size, and because 7 additions were abnormally high, we redirected capital away from existing positions. Let’s review how we did. This is a short public brief.
$PFF
A June 2026 PFF Rebalance Review https://t.co/iwmIhc4xKl
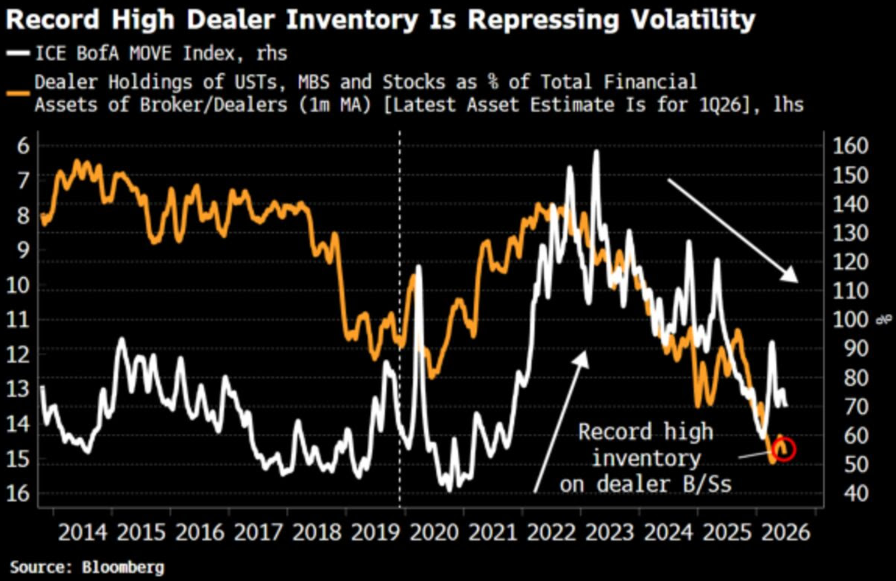
This is going to be long but this Bloomberg chart overlays two powerful datasets from 2014 through early 2026: the ICE BofA MOVE Index measuring US Treasury bond market volatility (white line, right axis), and dealer holdings of USTs, MBS, and stocks as a percentage of total financial assets of broker-dealers on a one-month moving average (orange line, left axis, inverted scale), and the central thesis is captured in the title and the circled annotation: broker-dealer inventory is at a record high for the data history shown, and this outsized dealer balance sheet commitment to fixed income and equity inventory is actively suppressing volatility by providing a consistent bid that absorbs selling pressure before it can cascade into disorderly price moves. The inverse relationship between the two series is the analytical heart of the chart and it holds with striking consistency across the full 12-year history: when dealer inventory was high in the 2014 to 2019 pre-COVID era, the MOVE Index was generally subdued in the 60 to 80 range, then as COVID forced dealers to rapidly liquidate inventory in March 2020, MOVE exploded to nearly 160 before dealers rebuilt positions and volatility compressed again, and the same pattern repeated in 2022 as aggressive Fed rate hikes impaired dealer balance sheets and MOVE spiked above 150 during the most intense period of Treasury market dysfunction. The current reading of record-high dealer inventory alongside a MOVE Index that has now compressed back toward the 70 to 80 range creates what is simultaneously a comforting and deeply concerning picture: comforting because it explains the remarkable calm in rates markets we observed in the 2s10s yield curve chart, and concerning because record dealer inventory loaded with USTs, MBS, and equities is essentially a record-large coiled spring that if forced to unwind, whether by regulatory capital constraints, a credit rating action on US sovereign debt, or a sudden increase in client redemptions, would release an enormous quantity of bonds and stocks into the market simultaneously, converting today's artificially suppressed MOVE readings into a volatility explosion that could rival or exceed the COVID and 2022 episodes we can see clearly in the historical record.
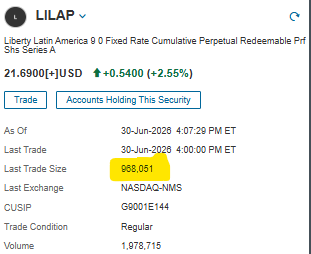
@yenoms Certainly, with only 112k shares traded so far, that process will take longer, but I wouldn't be surprised if we see a larger block order get generated here before market close which juices the total volume today
@yenoms Yes, we have been asked before about the date range for when the sellers should be out, and the yield seekers become dominant... We are still holding that July 10th or so looks to be when the price should be stabilizing, and we start to see the move to fair value (~$22.50)
A publicly traded middle-market lender has seen its publicly listed baby bond drift to nearly 400 basis points over Treasuries following a technical selling driven by PFF’s monthly rebalance. The business itself is below-average by sector standards: NAV is eroding, the common dividend is not fully covered by net investment income, and leverage is above where management wants it. None of that is news. What the spread does not reflect is the structural optionality sitting on the balance sheet, roughly $1.45 billion in the two highest internal credit-quality buckets, nearly all of it in first-lien senior-secured loans that trade in an active secondary market. Management has publicly committed to a leverage target that requires retiring approximately $175-$210 million of net debt. They can do it without cutting the dividend, without accessing capital markets, and without selling a single distressed position. At a yield north of 8%, the current price reflects a credit concern that the collateral base does not support.
Value in Dislocation https://t.co/7JHJWRpQwT
We are seeing quite a bit of selling pressure today across a few positions. This selling is generating many good deals. $PFF Rebalance Day is always interesting, as you wonder why certain things were bought, like in March (NSAPRB), and why certain other positions were sold in such sloppy fashion. I hope you brought your shopping lists today!
What good deals are you buying right now?
Overall, this month’s rebalance brings quite a bit of selling. We project that a majority of positions will be experiencing MODERATE SELLING PRESSURE relative to their daily trading averages. There is a combination of net outflows from the fund and an abnormally large number of new additions, pulling capital from other positions. We estimate you will see SEVEN new preferred/bond positions added to the $PFF, but ZERO deletions. This will be known to all tomorrow with the latest monthly update on the PFF website.
Happy Hunting!
June 2026 PFF Rebalance https://t.co/MYLyxyq5mt
@JRL12483@QTRResearch@CNBC It is for entertainment and geared towards retail investors.
Serious professionals do not watch that network..
Tom Lee is just yet another example.. You have Ackman, Cathie Wood, etc Just listen to them talk and ask why they continue to be invited on there?
@HedgehogTrader The future price of gold does not move because of random moves on a stock chart (i.e. what a Death Cross is).. It moves off monetary policy pivots and/or the forward-looking perception of monetary policy