Seven clocks are running. None of them negotiable. All of them counting down to the same weeks.
The planting clock. Mid-April is the biological deadline for corn and soybean planting across the US Midwest. Every day that passes without nitrogen becoming affordable and available narrows the window for corn. USDA projects corn falling to 94 million acres from 98.8 million. Soybeans rising to 85 million from 81.2 million. The seeds that go into the ground in the next three weeks determine America’s grain harvest in October. The decision is irreversible.
The USDA clock. March 31. Prospective Plantings. The report that converts farmer intentions into official data. Every acreage number, every corn-soy ratio, every nitrogen-dependent calculation becomes a published fact that traders, governments, and food agencies will use to model global supply for the next twelve months. The number arrives in twelve days.
The FAO clock. April 3. The Food Price Index. The first global reading that captures post-Hormuz commodity prices across cereals, vegetable oils, dairy, meat, and sugar. The 2022 peak was 159.7 in March 2022 after Ukraine. This reading will incorporate oil above $100, urea at $610, LNG halted, packaging repriced, and freight surcharges of $500 to $1,500 per container. The number that determines whether the UN declares a food emergency arrives in fifteen days.
The pharmaceutical clock. India’s API inventory buffers are two to three months, measured from the war’s onset on February 28. Late May is the depletion window. Methanol at 87.7 percent Hormuz exposure feeds the solvent chain for paracetamol, ibuprofen, metformin, and antibiotics. Once buffers deplete, the shortage becomes a patient access crisis for the 47 percent of US generics that originate in India.
The China crude clock. FGE NexantECA confirmed China is drawing commercial reserves at up to one million barrels per day. The draw sustains refinery operations for four to six weeks from March 19. Mid-April to late April is the exhaustion window. After that, China faces three options: accelerate Russian pipeline imports, reroute at massive premium, or crack open the strategic petroleum reserve. The third option reprices every commodity on the planet.
The helium clock. SK Hynix and Samsung hold two to three months of helium inventory. Late May to early June is the depletion window. South Korea imports 64.7 percent of its helium from Qatar. Ras Laffan is offline. If helium buffers deplete before alternative supply arrives, semiconductor fabrication faces rationing. The AI hardware supply chain hits a physical wall measured in months, not quarters.
The insurance clock. Solvency II requires 30 to 60 days of zero incidents before P&I clubs can reinstate war risk coverage. Even after a ceasefire, the insurance normalisation takes six to sixteen months based on the Red Sea precedent of 26 months and counting. The logistics system lags the financial relief rally by the longest duration of any clock in this crisis.
Seven clocks. The shortest expires in twelve days. The longest runs for over a year. The planting window, the USDA report, the FAO index, the drug buffers, the Chinese crude draw, the helium inventory, and the insurance cycle are all counting down simultaneously. None of them pause for diplomacy. None of them respond to presidential directives. None of them read sealed packets.
The calendar is the only actor in this war that has never lost a negotiation.
https://t.co/iFmUcarGdV
BREAKING NEWS
The Royal Swedish Academy of Sciences has decided to award the 2025 Sveriges Riksbank Prize in Economic Sciences in Memory of Alfred Nobel to Joel Mokyr, Philippe Aghion and Peter Howitt “for having explained innovation-driven economic growth” with one half to Mokyr “for having identified the prerequisites for sustained growth through technological progress” and the other half jointly to Aghion and Howitt “for the theory of sustained growth through creative destruction.”
#NobelPrize
Including dividends, the S&P 500 is now down 13.4% thus far in 2025. Since 1990, only two years have had a worse start: 2001 and 2020. Last year at this time the S&P 500 was up 9.7% on the year. $SPX
https://t.co/l5IYmkeySJ
Una de las metas del Plan México es que, para 2030, México pase de ser la economía 12 a la 10 medida por su PIB nominal.
El PIB de México es de US$1.8 bns. Las dos economías que le siguen son Rusia con US$2 bns y Canadá con US$2.1 bns.
Para lograr esto no solo es rebasar a Rusia y Canadá. También hay que evitar que los que están abajo de nosotros nos rebasen.
Abajo de nosotros está: Corea del sur (US$1.7 bns), Australia (US$1.7 bns) y España (US$1.6 bns).
Si bien estos números son a cierre de 2023, el 2024 no nos trato muy bien en esta métrica, pues el peso se depreció y la medición del PIB Nominal, al hacerlo en USD, tenderá a bajar. Es decir, seguramente a cierre de 2024 nuestro puesto en la tabla bajó (ya no somos el 10) y los que no "debían rebasarnos" nos rebasaron.
Veremos que pasa!
“Tenemos que mirar una cosa y solo una cosa: cuánto gasta el gobierno. Ese es el verdadero impuesto. Si no lo estás pagando con impuestos explícitos, lo estás pagando indirectamente con inflación o endeudamiento”
Milton Friedman
Milton Friedman said it best:
“Keep your eye on how much the Government is spending, because that is the true tax.
There is no such thing as an unbalanced budget. You PAY FOR IT either in the form of taxes, or indirectly in the form of inflation or debt.”
Fact check: TRUE ✅
Mexico's central bank says it could step in if needed and the president-elect is promising a responsible debate about reforms. But traders who had bought tons of pesos before Mexico's June 2 election are selling, and nothing seems to stop them. https://t.co/vkXqquY0wa
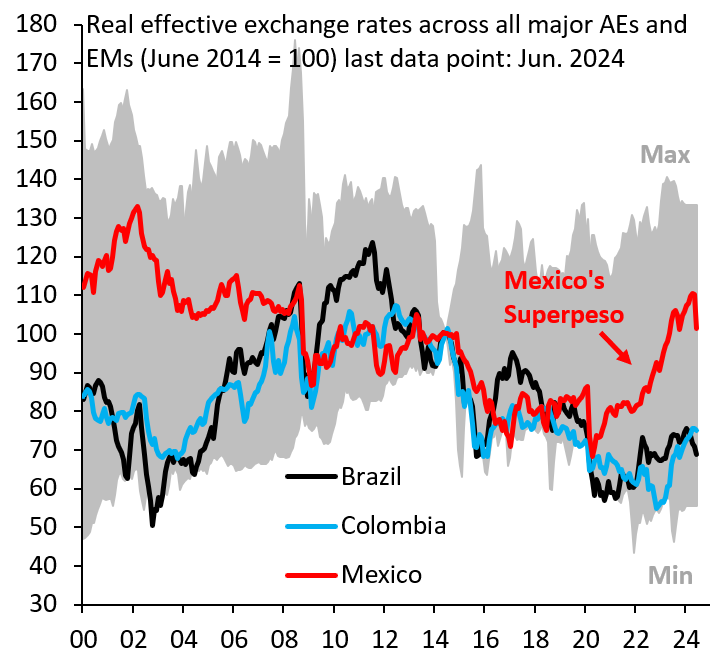
Mexico's Peso fell 10% against the Dollar this week, but the unfortunate truth is that this fall is only the start of a major depreciation cycle. The Mexican Peso (red) is substantially (20%) overvalued compared other LatAm currencies like the Brazilian Real or Colombia's Peso.
La apreciación del peso frente al dólar no fue “creación” de la 4T. Fue efecto del diferencial de tasas entre México y Estados Unidos, responsabilidad de @Banxico. Su depreciación (al momento de escribir esto el tipo de cambio es $18.3025 por dólar), sí lo es.
En un cálculo bastante aproximado, después de la apreciación de peso de este año, la economía mexicana ya vale un poco más de US$2 trillion.
Además, comparándola con la economía brasileña, y dado que el real se ha depreciado, la economía mexicana ya alcanzó a la brasileña (hace 10 años éramos apenas la mitad de tamaño).
🔸Warren Buffett's Berkshire files Q323 13F:
🔸sold $7B of stocks
🔸Buys: $BATRA new position with $8M stake
🔸Reduces: $AMZN stake down to 5%
🔸Exits: $GM $JNJ $PG $CE
WARREN BUFFETT'S PORTFOLIO HAS BEEN UPDATED!!
Here's all the changes Warren Buffett and Berkshire Hathaway $BRK.B made during Q3
Positions fully sold:
- Celanese $CE (Sold 5.36M shares currently worth $674.1M)
- General Motors $GM (Sold 22M shares currently worth $620.4M)
- Mondelez $MDLZ (Sold 578K shares currently worth $49.5M)
- Johnson & Johnson $JNJ (Sold 327.1K shares currently worth $48.4M)
- Procter & Gamble $PG (Sold 315.4K shares currently worth $48M)
- $UPS (Sold 59.4K shares currently worth $8.5M)
- Activision Blizzard $ATVI (Got acquired by MSFT, sold 14.7M shares worth $1.4B at the price it got taken private at)
Positions reduced holdings in:
- Chevron $CVX (Sold 12.9M shares currently worth $1.87B)
- $HPQ (Sold 18.4M shares currently worth $519.5M)
- Markel $MKL (Sold 312.9K shares currently worth $429.2M)
- Globe Life $GL (Sold 1.68M shares currently worth $199.2M)
- Amazon $AMZN (Sold 551K shares currently worth $80.8M)
- $AON (Sold 235K shares currently worth $78.3M)
New Positions:
- Sirius XM $SIRI (Bought 9.68M shares currently worth $47.3M)
- Atlanta Braves $BATRK (Bought 223.6K shares currently worth $8M)
Positions increased holdings in:
- Liberty Media $LLYVK $LLYVA (Bought 16.2M shares currently worth $580.2M)
NOTES:
- Warren Buffett's equity portfolio was worth $318.6 Billion as of the end of Q3
- Buffett's portfolio was updated as of the end of Q3 so these are the changes made to his portfolio from June 30th to September 30th
- We don't know exactly when the shares were sold during Q3 so the current worth part should be taken as just estimates so you can get a ballpark range on the value
En México la tasa de los bonos M a 10 años subió 22.5 puntos base, ubicándose en 9.76% y tocando un máximo de 9.767%, no visto desde el 7 de noviembre del 2022.
La tasa mostró presiones al alza en reacción a la publicación del Paquete Económico 2024 el viernes por la tarde, tras el cierre de los mercados. Lo anterior se debe a que la propuesta incluye un déficit presupuestario de 4.9% del PIB, que de concretarse sería el mayor desde 1988 e implica un mayor crecimiento de la deuda. De hecho, el déficit presupuestario propuesto es de 1,693,000 millones de pesos, mientras que el del gobierno federal es de 1,906,069 millones de pesos, por arriba del presupuesto propuesto para inversión pública de 1,108,412 millones de pesos. De aprobarse, sería la primera vez en la administración actual que el déficit del gobierno federal excede el presupuesto de inversión. En el artículo 73 de la Constitución dice “Ningún empréstito podrá celebrarse sino para la ejecución de obras que directamente produzcan un incremento en los ingresos públicos”, algo que no se cumple en el Paquete Económico 2024.
El mercado cambiario no reaccionó a la publicación del Paquete Económico, pero el mercado de bonos sí, pues el mayor déficit implica mayor deuda.
#MEXICO - Esta gráfica destaca dos puntos:
1) La evolución de la estimación de Banxico de la brecha negativa.
2) Aún con base 2013, la estimación propia ya indica brecha positiva desde 22T3.