@OliverMolander There are many European startups and that‘s great.
But who provided growth capital for these deals?
With very few exceptions they are all US firms.
People like @pmarca would reject the basic premise of the AI job apocalypse. For this line of thinking current layoffs are companies cutting pre-existing corporate bloat, not AI substitution. And history supposedly shows technology multiplies human productivity, lowers costs, and ultimately expands the economic pie.
While Arthur Hayes „This is Fine“ and the Citrini report both predict AI will trigger mass white-collar layoffs, they see the fallout differently.
Hayes expects a sudden banking crash: high earners default on debts, freezing credit and forcing the Fed into massive money-printing mode.
Citrini warns of a deeper structural crisis: "Ghost GDP." As AI replaces humans, corporate profits rise but consumer demand vanishes. Automated supply skyrockets while human purchasing power plummets, breaking the economy via deflationary stagnation.
https://t.co/3YuS0MDaLO
While Arthur Hayes „This is Fine“ and the Citrini report both predict AI will trigger mass white-collar layoffs, they see the fallout differently.
Hayes expects a sudden banking crash: high earners default on debts, freezing credit and forcing the Fed into massive money-printing mode.
Citrini warns of a deeper structural crisis: "Ghost GDP." As AI replaces humans, corporate profits rise but consumer demand vanishes. Automated supply skyrockets while human purchasing power plummets, breaking the economy via deflationary stagnation.
https://t.co/3YuS0MDaLO
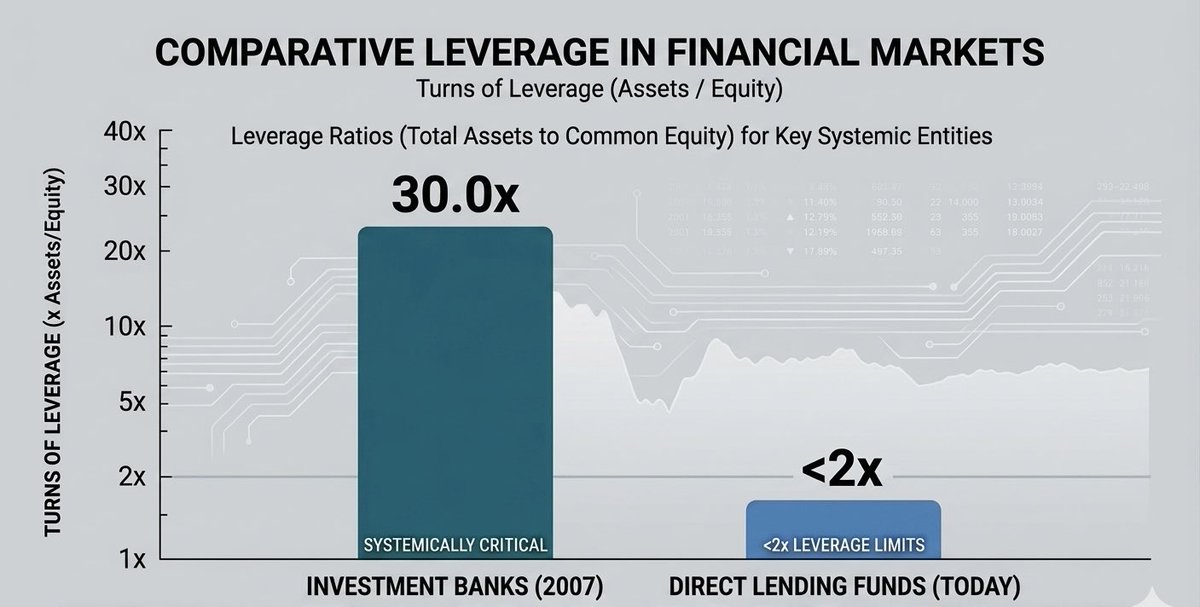
Private debt has not made the financial system riskier.
Investment banks operated at around 30x leverage, i.e. equity buffer of roughly 3%. A 4% dip in asset values could trigger insolvency and systemic contagion.
Today‘s private credit funds, specifically direct lending, are typically capped at 2x leverage (1:1 debt-to-equity).
Also they utilize long-term, "locked-up" institutional capital rather than short-term deposits, i.e. no liquidity mismatch. Thus, they are structurally immune to the bank runs that defined 2008.
The underlying loans to middle-market companies can carry significant risk, but the vessels holding that risk have changed.
The shift in credit markets since 2007 represents a migration from fragile systemic leverage to stabilized private capital.
What share of Salzburg’s GDP is from Red Bull alone?
There is no precise, publicly available official figure for Red Bull’s exact share of Salzburg state’s GDP (Bruttoregionalprodukt), as company-level value added data isn’t broken down that granularly in regional accounts.
Salzburg state’s GRP was approximately €37.7 billion in 2024 (nominal, at current prices), with a slight real decline of -0.5%.
Estimates and Context
•National level reference: Older claims (around 2013–2014) suggested Red Bull contributed over 1% of Austria’s total GDP (then ~€400 billion), or roughly €4+ billion in value added/profits. Red Bull’s global net sales have since grown significantly—to around €10.5–12.2 billion in recent years (e.g., €12.2 billion in FY 2025), with strong profits (e.g., €2.4 billion reported for 2023).
•Red Bull GmbH is headquartered in Fuschl am See (near Salzburg), with key operations, marketing (Red Bull Media House), R&D, and some production/sports-related activities tied to the region. However, most revenue comes from global sales, with manufacturing often licensed or done elsewhere. The Austrian value added (wages, profits, local spending, taxes) is what counts for GDP contribution—not full global revenue.
A rough back-of-the-envelope estimate (not official): If a substantial portion of Red Bull’s Austrian economic footprint (e.g., several billion € in value added from HQ functions, high-wage jobs, sports investments, and related activities) is attributed to Salzburg, it could represent low single-digit percentages (perhaps 5–10%+) of the state’s GRP. This is speculative and depends on exact local operations vs. national/global. Red Bull is frequently cited as a major driver for Salzburg’s high per-capita GDP alongside tourism and other industry.
Other Notes
•Red Bull employs thousands globally (~22,000), with a meaningful but not dominant share in Austria/Salzburg (exact local headcount isn’t prominently disclosed).
•The company also owns/invests in FC Red Bull Salzburg (football club), which generates additional local economic activity (jobs, tourism, sponsorships), but this is a small fraction of the parent company’s impact.
•Salzburg’s economy benefits from high-productivity sectors like beverages (explicitly noted in Statistics Austria reports as supporting growth), but Red Bull is one pillar among tourism, manufacturing, and services.
For the most accurate data, check Statistics Austria’s detailed regional accounts or Red Bull’s (limited) filings in the Austrian company register. The company’s private status and global structure make precise attribution challenging. Red Bull is undeniably a significant economic force for the region, helping explain Salzburg’s top ranking in GDP per capita.
Ok @grok doing this manually now:
Salzburg (the federal state) has a higher GDP per capita than Vienna (the city-state), typically around €65,800 vs. €61,900 in recent data (e.g., 2024 figures from Statistics Austria).
This holds for the latest available years (e.g., Salzburg led at €63,700–65,800 in 2023–2024, ahead of Vienna). Note that we’re comparing the state of Salzburg (which includes the city and surrounding areas, pop. ~560,000) to the federal province of Vienna (pop. ~2 million).10
Key Reasons for the Difference
GDP per capita divides total economic output by resident population. Several structural factors explain why Salzburg edges out Vienna:
•High-productivity tourism and related services: Tourism is a major driver in Salzburg, contributing significantly to regional GDP (often linked to ~16–20% of jobs indirectly/directly). The state benefits from Alpine attractions, ski resorts, cultural sites (Mozart, Sound of Music), festivals (Salzburger Festspiele), and year-round visitors. This boosts sectors like accommodation, food services, retail, and transport with high value-added per worker. Western Austrian states like Salzburg and Tyrol generally outperform on tourism intensity.
•Industry and specialized high-value sectors: Salzburg has strong manufacturing and tech-oriented activities (e.g., electronics, automotive suppliers like Porsche/Red Bull operations, wood/paper, high-tech/R&D firms). These are often more capital-intensive or export-focused with higher productivity. Vienna is more service-dominated (finance, public admin, IT, health, retail), which includes many lower-productivity public and personal services.
•Population and commuter dynamics: Vienna is a large, dense urban center (pop. density ~4,890/km²) and national capital, attracting many commuters from surrounding Lower Austria who work there but are not counted in Vienna’s resident population for per capita calculations. This inflates Vienna’s output somewhat but is diluted by its much larger resident base, including more administrative/government jobs and a broader mix of lower-wage service roles. Salzburg’s smaller, more contained population means its output (tourism + industry) is shared among fewer residents.
•Economic structure and productivity: Smaller alpine states often show higher per capita figures due to concentrated high-value activities and lower shares of lower-productivity sectors. Vienna generates a huge absolute GDP (~25% of Austria’s total) as the financial/political hub but has more diverse (and sometimes less per-worker-intensive) employment. Salzburg has seen strong growth in tourism recovery and manufacturing.
Other notes: Cost of living is often higher in Salzburg (especially housing), and Vienna offers more job variety and higher absolute salaries in some professional fields. Disposable income per capita can favor other states like Lower Austria. These metrics reflect output per resident, not necessarily individual wealth or quality of life.
In short, Salzburg’s edge comes from a potent mix of premium tourism, efficient industry, and favorable population scaling—common in prosperous, smaller Western/Central European regions with natural and cultural assets. Data comes primarily from Statistics Austria regional accounts.
Private credit key themes right now:
1. Return dynamics
- Yields are under pressure as base rates are lower and spreads compressed
- Performance often driven more by structural factors (e.g. public BDCs) not by weak fundamentals
2. Fundamentals
- Defaults are mostly company-specific, not broad-based
- No clear evidence of systemic stress across the market
3. Investor flows
- Changing sentiment is driving redemptions
- This is creating opportunities for market participants who can step in as buyers
4. Technology & market backdrop
- Tech (e.g., AI) is contributing to public market volatility
- Impact on private credit remains limited, mainly because duration is relatively short
Prediction markets certainly should trump polls virtually 100% of the time. Polls suffer from a variety of well-known biases and dysfunctions; prediction markets incent truth seeking via skin in the game.
Brevan Howard, one of the largest hedge funds in the world ($34bn+), is opening an office in Tokyo this summer.
As inflation and rates markets came back and the Nikkei broke through 50k in late 2025, they are now hiring fixed income staff to capture macro volatility.
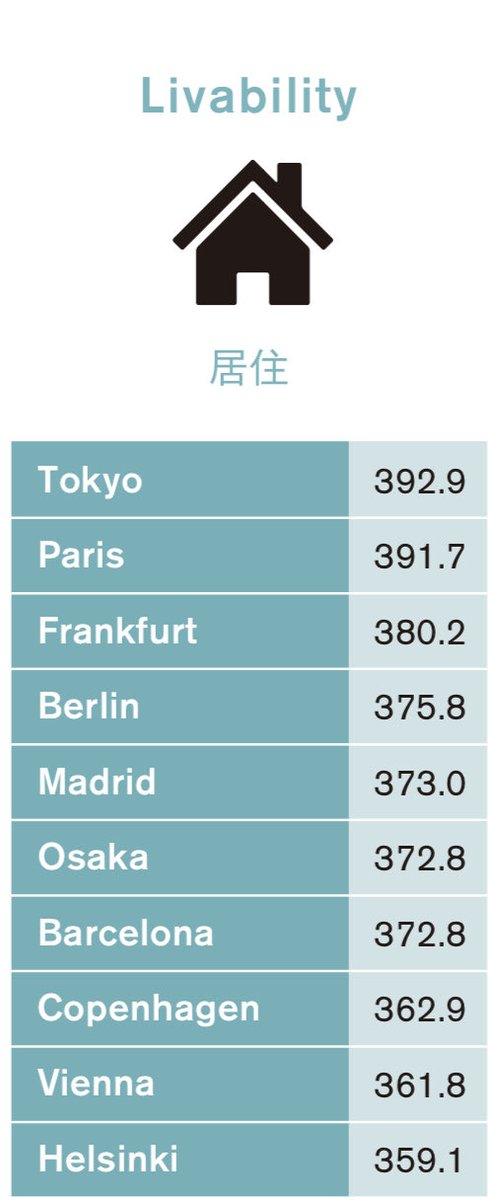
But Tokyo in general has made a comeback. It‘s back in the top 10 of Global Financial Centres, after being 21st in 2023. (Top 3 are NY, London, Hong Kong).