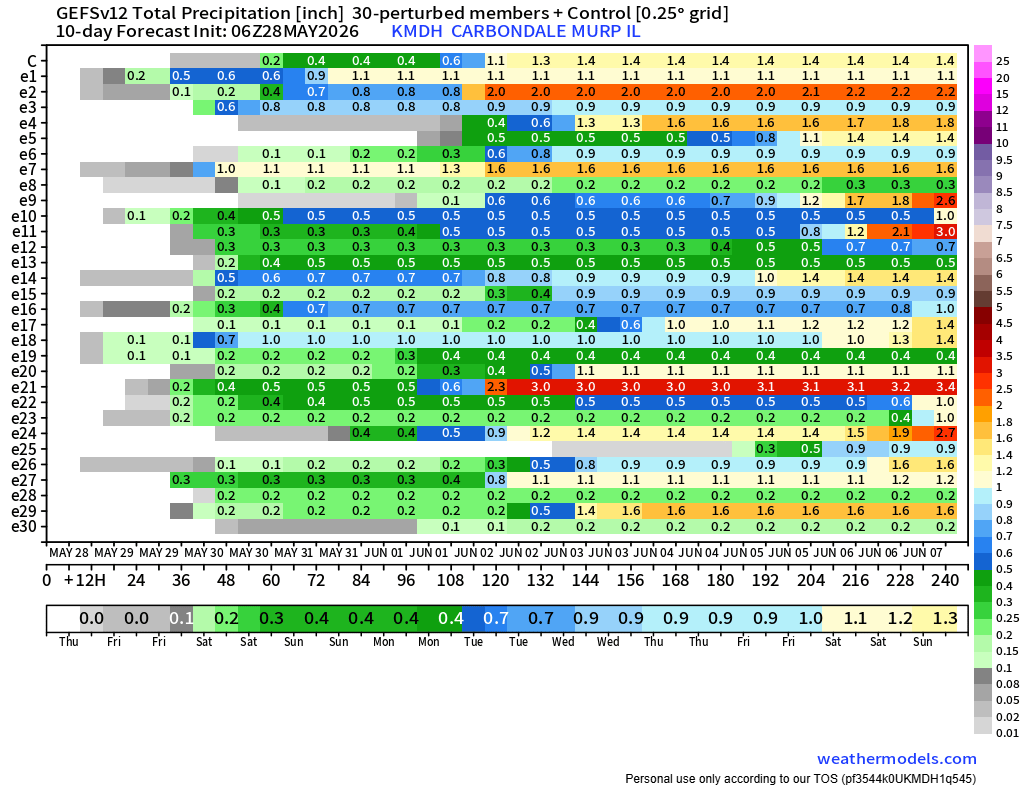
Watching another needed rain event dissipate on arrival this morning (Jne14). Small chance later today but next significant chance I see locally is about 5 days away.
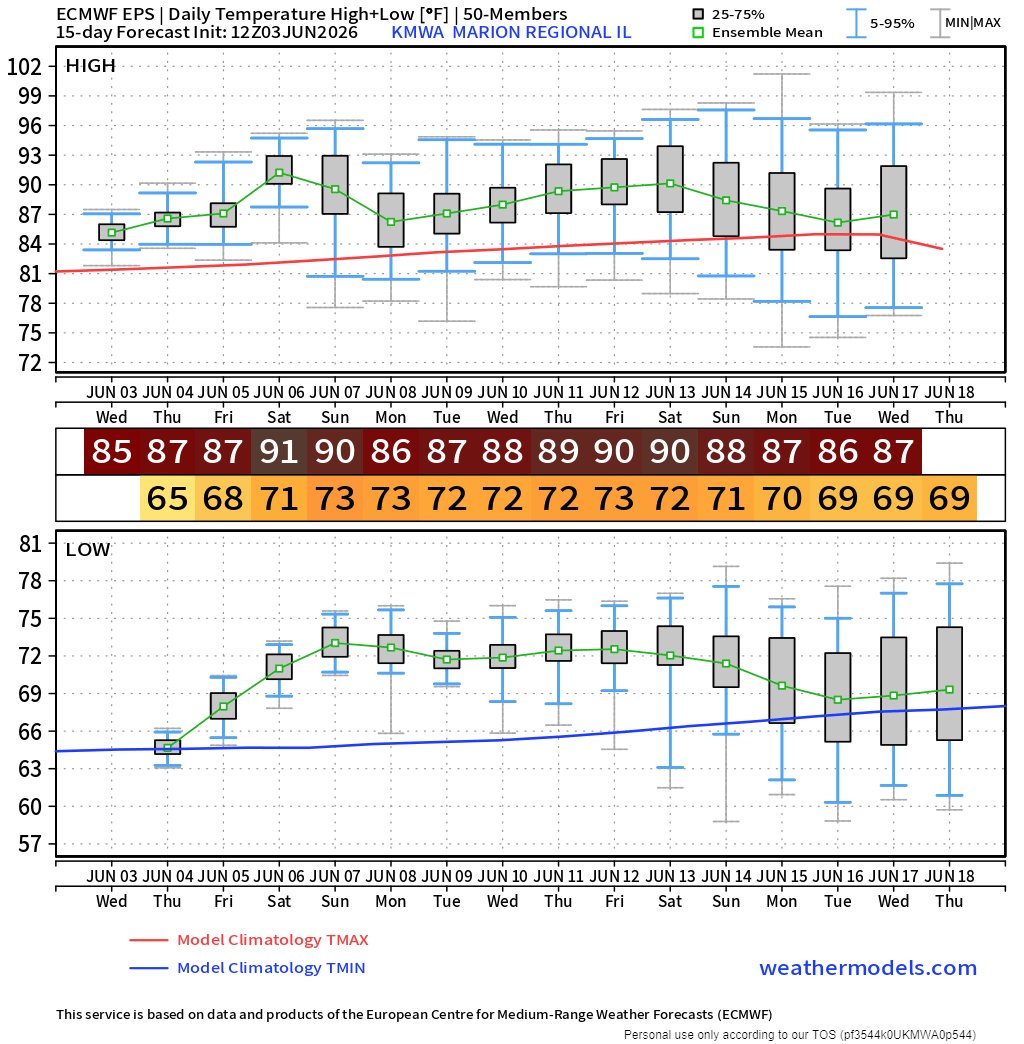
Now that a cold front has moved through the region we see temperature projections signaling a cooler than normal start to next week for a couple days and a move to near normal temperatures following. This aligns with data suggesting another cold front into the region around the 18th. Rain chances are up this weekend as the boundary wobbles before moving on and chances increase again with the projected front around the 18th-19th.
Less than 3” of rain in last 50 days in my gauge … A couple days of 90+ temps, sunny skies and gusty south winds has my strawberry patch suffering. Can’t water enough to make a difference so will let go and reevaluate if/when real rain arrives.
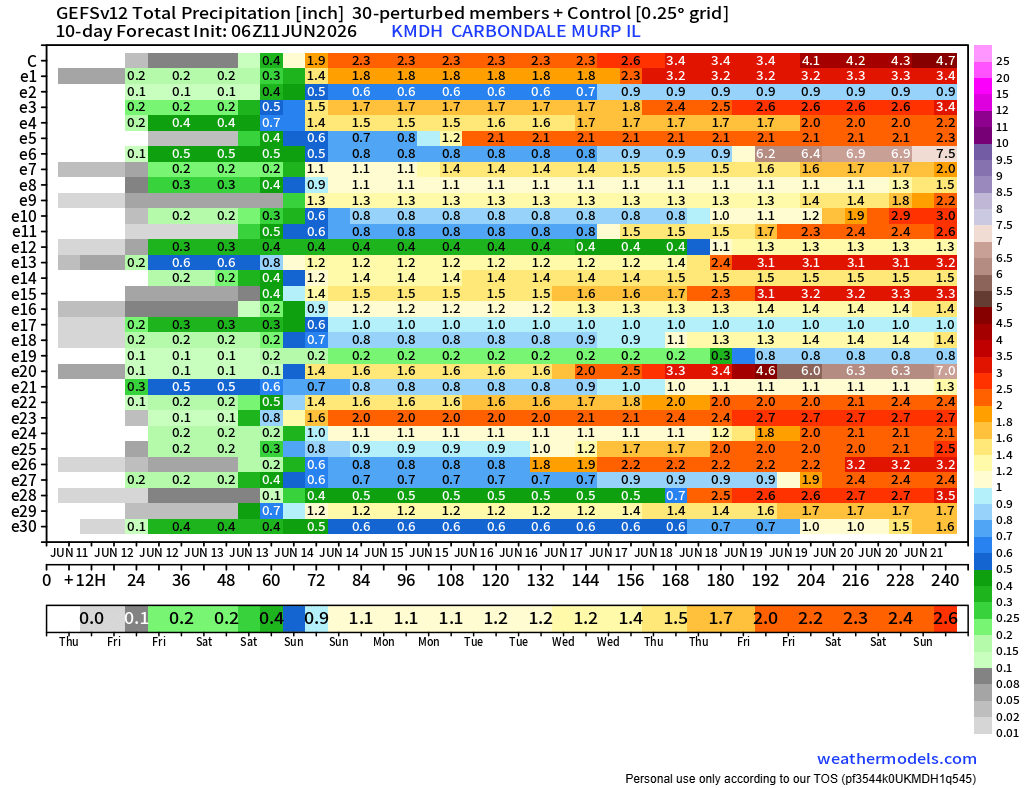
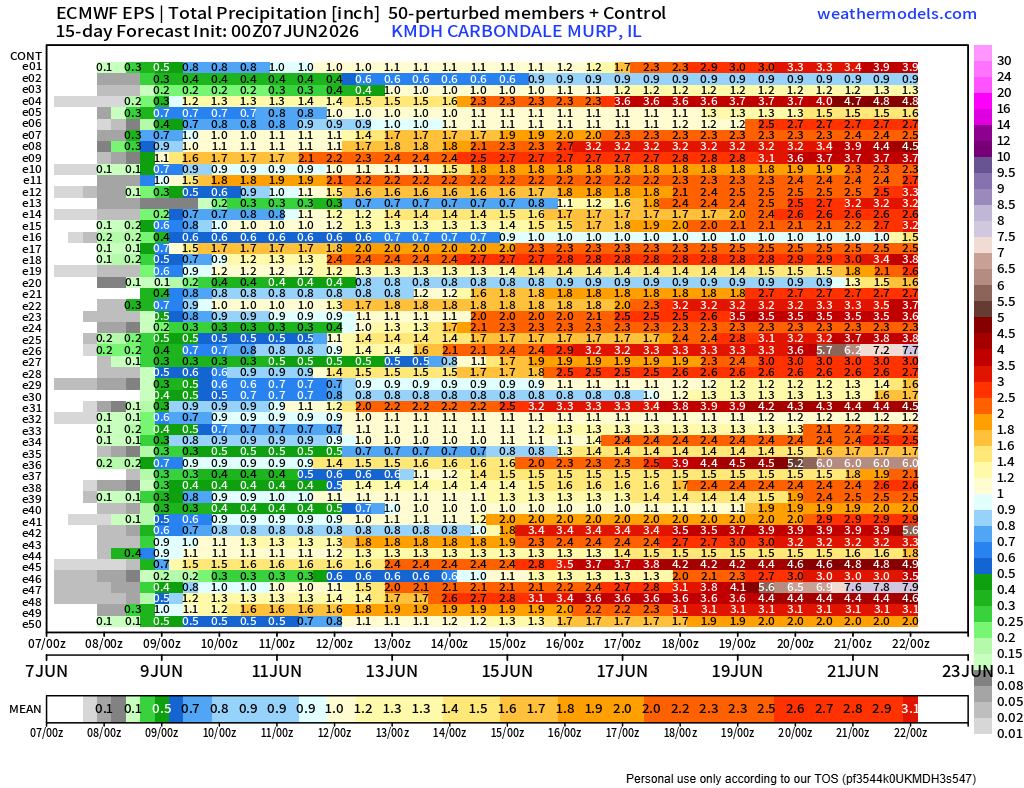
Another round of hit/miss showers missed my rain gauge this morning and the 2 week projection presented it as a mostly miss event. Looking for best chances widespread locally, the Sunday numbers offer the best signal.
My thought yesterday while watering the vegetables was mostly on the 15mph wind and how it is a multiplier to the drying. I've become one that is hopeful on a forecast not just one who analyzes them. My personal ag interests might be small by comparison but I am stuck in some serious dry conditions while there are wet conditions not that far away.
Cooler than normal conditions locally appear in multiple solutions for mid June. The brief drop appears related to an increased chance of widespread rain.
Recent rain events delivered record setting rainfall to some locations while others remained mostly dry aligning with a recent posts suggesting the event could be spotty. My gauge caught 0.06" while some locations nearby had more than 1". I have less than 1/2" for the month and ground around me is brick hard.
Run to run trend is wetter in the 2 week projection.
10 of the 50 solutions are drier than normal. This data solution signaling a solid chance of wetter than normal conditions locally in weeks 2 & 3 of June.
2 week projection still delivers strong wet signal for week 2 of June and week 3 of June. Locally May numbers did not verify well for the wet projections with spotty verification and widespread dry.
This is a post to look back on week 4 of June to see how it verifies. July and August dry signals make the time period and solution of this chart critical for lower Ohio River valley operations IMO. There is sign of convection (thunderstorms) all through this data so spotty verification will not surprise me.
Temperature projection is warmer than normal for the next couple weeks locally. The jump up on the low side to lows in the 70s is related to air you can wear and that humidity could fuel some isolated strong storms in June week 2.
Scattered shower signal through the end of May locally but this data has been trending dryer recently for that period. Second half of the period appears wetter and aligns with 30 day data that continues to present June at normal to slightly wetter than.
July and August outlooks consistently dry.
More signal of heat in week 2 of June over the lower Ohio River valley in this 2 week projection. Other solutions display higher temperatures but align with the top side of the probable bar in this multi member data.
Lows projected near 70 suggest hot and humid conditions. Need to watch for storm signals.
2 week temperature projection consistent with the early June 'cool snap' lows in 50s but also consistent with other solutions of heat building in for week 2 of June. 90s appear in other data.
2 week temperature projection is strong signal of cooler than normal conditions locally for the first week of June. Continuing the struggle of getting and maintaining soil temperatures.
Nice break from A/C as we look at higher utility rates for summer.
Simrad products only delivering part of the story. Rainfall projection for Friday showing local focus of rain in the gauge across SIN and WKY. Parts of SIL could stay dry or only see drizzle. Higher totals (relative) closer to the Wabash and the Ohio.
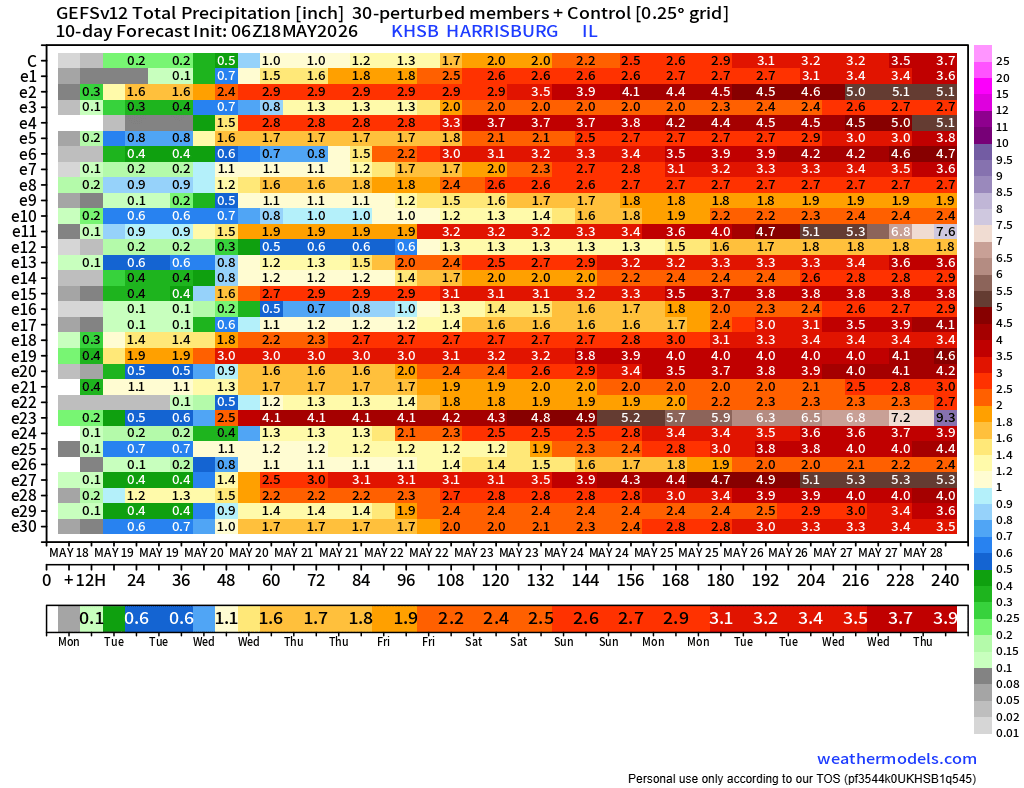
This is a fair reflection of multiple solutions from 2 week rain projections for the lower Ohio River valley. Overall wet pattern with the period from May19-May25 the focus of the bigger totals.
Strong storms are expected with the arrival of the rain chances but temperature projections in the 19-25 window appear more aligned with more general rain showers locally.
Monday rain event looks hit/miss locally with bigger chances to our immediate north. Tuesday event tied to boundary so more consistent solution for rain but still variability in amounts tied to thunderstorm activity and isolated downpours (or not).
The increase in the average line from 1.3" to 2.3" from May22-May25 suggests isolated thunderstorm activity could impact some holiday weekend activities.
The dip in projected temperatures on days 1-2 related to another cold front passage. Another dry front leading to lower humidity and increased winds increasing evaporation locally. The projections for the second half of May deliver signs of wetter weather but for the next 5-7 days there is a lot of dry weather in the numbers.
Week 2 data is projecting a wet solution locally and appears tied to an increased flow from the Pacific rather than the Gulf. If you need dry weather, it is in place. If you need wet weather, the chance is in the charts starting around May18 and lingering for a week or so.