"It is impossible to design a system so perfect that no one needs to be good." - TS Eliot
The quote attributed to T.S. Eliot highlights the philosophical and ethical understanding that no matter how well-designed a system is, it cannot entirely compensate for the moral character and intentions of the individuals interacting with it.
In the context of AI, this quote suggests that while we can strive to create advanced and robust AI systems with many safeguards, these systems cannot fully preempt or prevent all potential misuse by individuals who are determined to behave unethically. AI systems rely on human users and developers to use them responsibly and ethically. This is why the role of human oversight, ethical guidelines, and continuous monitoring is crucial in the development and deployment of AI technologies. It's a reminder that technology alone cannot solve all problems related to human behavior and that ethical use is a shared responsibility.
Liquid AI may not become the next OpenAI. It could become something more quietly fundamental: the intelligence layer embedded everywhere inside devices, vehicles, robots, sensors, and software doing for compact AI what Arm did for computing infrastructure.
Introducing 𝙻𝙵𝙼𝟹: our new generation of Liquid Foundation Models. With a new tri-hybrid architecture and new multimodal encoders, the LFM3 family is the ideal model suite for specialized intelligence.
> 6 model instances, across text, audio, vision, and omni modalities, generative and decision models.
> 𝙻𝙵𝙼𝟹-𝟷.𝟽𝙱: text, 256k context window.
> 𝙻𝙵𝙼𝟹-𝚅𝙻-𝟸𝙱: vision-language model with video-input support for spatial understanding
> 𝙻𝙵𝙼𝟹-𝙰𝚞𝚍𝚒𝚘-𝟸𝙱: tool calls, voice chat, reasoning in 18 languages.
> 𝙻𝙵𝙼𝟹-𝙾𝚖𝚗𝚒-𝟸𝙱: an omni model combines vision, audio, and language.
> 𝚍𝟷-𝟸𝙱 and 𝚍𝟷-𝙾𝚖𝚗𝚒-𝟸𝙱: decision models with typed outputs and calibrated probabilities in a single pass. Omni adds audio input.
> fine-tune on 1 GPU.
> a new tri-hybrid architecture
> architecture optimized for 14 processor classes across GPUs, CPUs, and NPUs.
> 𝙻𝙵𝙼𝟹-𝚅𝙻-𝟸𝙱 is a beast. It performs competitively with Gemma 4 12B (6x larger), and Gemini 3.5 Flash Lite, and GPT-5.6 Luna, with 1.9B parameters.
> 𝙻𝙵𝙼𝟹-𝟷.𝟽𝙱 is #1 on the Pareto frontier of device intelligence 𝚙𝚒𝚙𝚎𝚝𝚝𝚎.𝚕𝚒𝚚𝚞𝚒𝚍.𝚊𝚒
Every modality for specialized intelligence. Pick the one that fits your use case, customize it, and run it on-device.
1/ 🧵
Not a public repo for my modified version yet.
I started from Realtek’s official r8127 11.016.00 Linux driver, built it locally on the DGX Spark with NAPI + RSS enabled, then added a small set of Spark-specific fixes/tuning:
• warm reboot/RB1 fix
• RSS enabled with fixed RSS key
• RXMITI01
• persistent RX IRQ/CPU affinity
• multiple TX queues
• DASH disabled
Then installed the module, rebuilt initramfs and verified the active driver with ethtool/modinfo after reboot.
Realtek RTL8127 Linux driver
https://t.co/uU4RYG66hf
One of the more frustrating issues I hit while building my 4 × NVIDIA DGX Spark cluster had nothing to do with the GPUs. It was the 10GbE management network.
The Sparks use a Realtek RTL8127 NIC, and under sustained traffic the stock r8127 11.014.00-NAPI driver was showing very unhealthy RX behaviour.
This wasn't just an iperf number looking bad.
On Spark1 I was seeing tests like:
~36,000 UDP packets lost
rx_mac_error increasing by roughly the same amount
rx_mac_missed also moving
meanwhile the MikroTik CRS812 showed no corresponding FCS/drop problem
That was an important clue: the switch and cable path looked clean. The packets were effectively being lost at the host RX side.
Disabling EEE helped somewhat loss dropped from roughly 36K to ~22K packets in one test but clearly did not solve the underlying problem.
Then came an interesting workaround.
I tested:
net.ipv4.tcp_sack=0
With TCP SACK enabled, long TCP tests could fall into ugly 5–10 second periods with throughput effectively dropping to zero and the congestion window collapsing.
With SACK disabled, Spark1 completed a 120 second test at about 8.11 Gbit/s without those hard stalls. A later 300 second validation also held around 8.11 Gbit/s.
So tcp_sack=0 was genuinely useful.
But it was NOT the fix.
The 300 second test still produced ~26,929 retransmissions. SACK-off was basically preventing the TCP stack from reacting catastrophically to the packet reordering/loss pattern coming from the NIC path.
I eventually deployed that workaround across all four Sparks because stability mattered more than theoretical protocol purity:
net.ipv4.tcp_sack = 0
But I kept looking for the actual cause.
The real improvement came from moving Sparks to the newer custom Realtek r8127 11.016.00-NAPI-RSS driver and fixing the receive side configuration:
RSS enabled
8 RX / 8 TX queues
corrected RX CPU affinity
RXMITI01 tuning
GRO enabled
DASH disabled
persistent warm reboot handling
That changed the character of the problem completely.
The catastrophic RX missed/error growth stopped, UDP became dramatically cleaner, and TCP became stable in the 8+ Gbit/s range.
Some representative results:
single-stream TCP: ~7.2–8.2 Gbit/s
4 streams: ~8.5 Gbit/s
8 streams: ~8.9 Gbit/s
Spark → Mac: ~9.05 Gbit/s
Spark ↔ Spark: ~9.4 Gbit/s
In one particularly clean UDP run I saw roughly 5.38 Gbit/s with only 48 packets lost out of ~4.64 million around 0.001%.
That is a very different system from the one dropping tens of thousands of packets at the RX MAC.
Later I also performed the full NVIDIA/DGX platform update across all four Sparks. That is now part of the cluster baseline, but I keep the two issues conceptually separate: the NVIDIA platform update and the RTL8127 driver/RSS work are not the same fix.
The biggest lesson from this debugging session:
tcp_sack=0 was a good mitigation, not a cure.
It removed the nasty TCP stalls and made the machines usable while debugging, but the retransmissions were telling us the underlying problem was still there.
The actual fix had to happen lower in the stack at the NIC driver, queueing, RSS and interrupt affinity level.
And this is exactly why looking only at “iperf says 8 Gbit/s” can be misleading.
Always look at:
retransmissions
NIC hardware counters
RX missed/error counters
queue distribution
IRQ affinity
switch counters
packet loss
Throughput tells you how fast the system went.
The counters tell you whether it got there cleanly.
4 x Sparks
DGX OS 7.6.0
kernel 7.0.0-1019-nvidia
NVIDIA driver 580.178.04
EC 3.13.7
SoC / UEFI 2.158.15
USB-PD 0.5.25
tcp_sack 0
If the rumored 2.5-3.5T parameter size for GLM-5.5 turns out to be real, its launch will define whether my DGX Spark cluster expands from TP4 to TP6.
Current cluster:
4× DGX Spark = 512 GB unified memory
Potential upgrade:
6× DGX Spark = 768 GB unified memory
My decision rule is straightforward:
If GLM-5.5 cannot run comfortably on TP4 at a quantization level I consider acceptable, but can run properly within ~700 GB on TP6, I’m adding two more Sparks.
That means enough memory not only for the weights, but also for KV cache, quantization metadata, runtime buffers, routing overhead, and a useful context length.
The raw numbers explain why:
2.5T @ 4-bit ≈ 1.25 TB
2.5T @ 2-bit ≈ 625 GB
3.0T @ 2-bit ≈ 750 GB
3.5T @ 2-bit ≈ 875 GB
So 2.5T at ~2-bit is exactly the kind of model that could trigger TP6: ~625 GB of raw weights against 768 GB of aggregate memory.
But there’s also a hard limit to the plan:
If the practical footprint is already ~750 GB+ before runtime headroom, I won’t add two Sparks just to force it into TP6.
So for me, GLM-5.5 has a very concrete outcome:
Fits TP4 → stay at 4 Sparks.
Doesn’t fit TP4, but fits TP6 properly → buy 2 more Sparks.
Doesn’t realistically fit TP6 → wait for a smaller/Flash variant or a better quantization path.
GLM-5.5 could literally be the model that decides whether this cluster becomes 6× DGX Spark
BENCHMARKED: LFM3-1.7B by @liquidai.
Liquid AI published 1.6 GB for the KV cache at 128K context. I ran it on my Mac mini and measured 1.6 GB.
The whole model at 128K uses 3.15 GB of GPU memory, under 5% of the 64GB. It still generates 80 tok/s.
Only 6 of its 24 layers keep a full KV cache. The other 18 use short convolutions or sliding-window attention.
llama.cpp (Metal), Q4_K_M, M5 Pro 64GB, median of 3 runs
- 512 ctx: 184 tok/s, 0.09s to first token
- 4K ctx: 178 tok/s, 0.72s to first token
- 32K ctx: 141 tok/s
- 128K ctx: 80 tok/s
Q8_0 does 125 tok/s at 512, so 4-bit is 47% faster.
True, the 200GbE fabric can carry normal IP traffic too, so the RJ45 links aren’t strictly required.
I keep them deliberately as a separate management plane: 10GbE for SSH/orchestration/recovery, dual 200GbE RoCE only for distributed traffic. If I break the fabric config, I still have clean access to every Spark.
Finally stress tested the 4× DGX Spark rack properly.
This wasn’t really about chasing benchmark numbers. I wanted to know if the rack itself was doing its job when all four Sparks were working hard at the same time mainly airflow, thermals, power behavior and whether one unit was getting punished by its position in the rack.
Methodology:
• Same production Docker image on all 4 Sparks
• Same 8192×8192 BF16 GEMM workload on each node
• 30 second isolated run per Spark first
• Then a synchronized 60 second run with all 4 Sparks loaded at the same time
• GPUs capped at ~2400 MHz
• GPU telemetry sampled throughout the runs: SM clock, power, temperature, utilization and P-state
• Results compared against the 4 node median rather than treating one node as the reference
The isolated phase was meant to establish whether any Spark was inherently slower or hotter on its own.
The simultaneous phase was the real rack test: same workload, same time, all four nodes producing heat and drawing power together. That’s the phase that can expose airflow imbalance, a bad rack position, thermal interaction between units or a node losing clocks under full system load.
Single node tests were extremely close, with only ~0.5% spread between the four units and temperatures between 69–72°C.
With all four running together:
• 92.51 TFLOP/s cluster median
• only ~1.3% spread between fastest and slowest
• 76–78°C max GPU temperatures
• 87–89 W average GPU power per node
• ~96% GPU utilization
• 100% P0 residency under load
• peak clocks around 2.37–2.39 GHz
The important part: there was no meaningful performance drop when the whole rack was loaded, no thermal outlier, and no Spark behaving differently from the others.
Only 2°C separated all four nodes under full load.
I also checked the MikroTik CRS812 in the same rack:
• CPU: 38°C
• switch: 44°C
• PHY: 37°C
• SFP: 68°C
• board sensors: 30 / 35 / 40°C
• all 4 chassis fans OK, running ~6630–7230 RPM
• PSU1: OK, 49.8 W, 27°C
• PSU input: 234.2 V
• PSU2: no input / intentional in my current setup
So the result is really about the whole rack, not just four GPU numbers.
The Sparks stay very closely matched under simultaneous load, airflow looks balanced, the CRS812 is thermally comfortable, and there’s no sign that any device is being disadvantaged by its position in the rack.
That’s what I wanted to validate.
Finally got DeepSeek-V4.1-Flash-1017 running properly across my 4× NVIDIA DGX Spark cluster.
Repo:
https://t.co/fyyiLI5pm5
Model:
deepseek-ai/DeepSeek-V4.1-Flash-1017
revision: 1bae0e1088993b9b82de08f59de5be5a34e42170
My setup:
• 4× DGX Spark / GB10
• TP4 / EP1
• SGLang canary
• 2× 200GbE RoCE rails through MikroTik CRS812
• RoCEnante
• B12X-next routed MoE
• DSpark speculative decoding, block size 5
• packed local Engram shards on every node
• FP8 KV cache
• 1,048,576 context
• 16 concurrent requests
Production settings:
• CHUNKED_PREFILL_SIZE=8192
• MEM_FRACTION_STATIC=0.78
• HEAD_MEM_FRACTION_STATIC=0.78
• DSV41_CACHE_GIB=4
• NCCL_IB_TC=104
• NCCL_PROTO=^LL128
• NCCL_MAX_NCHANNELS=8
Also patched the older RoCEnante path so it actually honors NCCL_IB_TC=104 instead of silently using TC0
Runtime validation:
• RoCEnante active on both rails
• B12X next active at EP1
• shared expert K pad 576→640 accepted by b12x
• RoCE compact gather active
• all 4 containers healthy
• qeval: 71/75
sparkDash results:
Structured C1: 157.0 tok/s - TTFT 229 ms
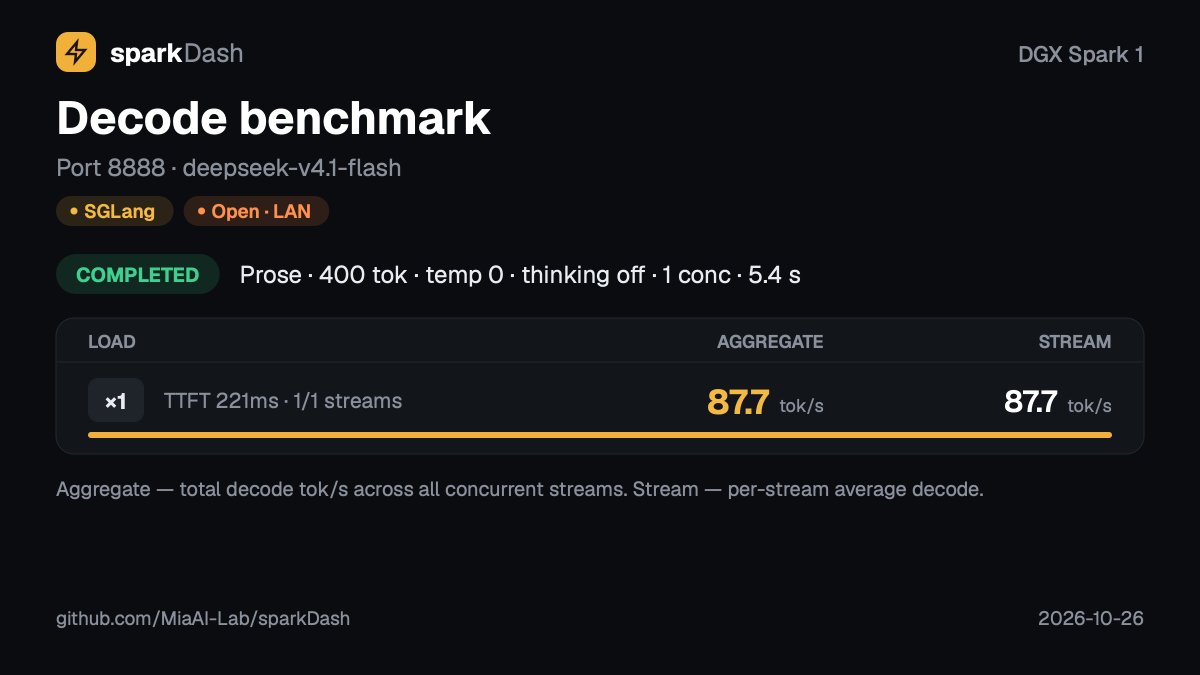
Prose C1: 87.7 tok/s - TTFT 221 ms
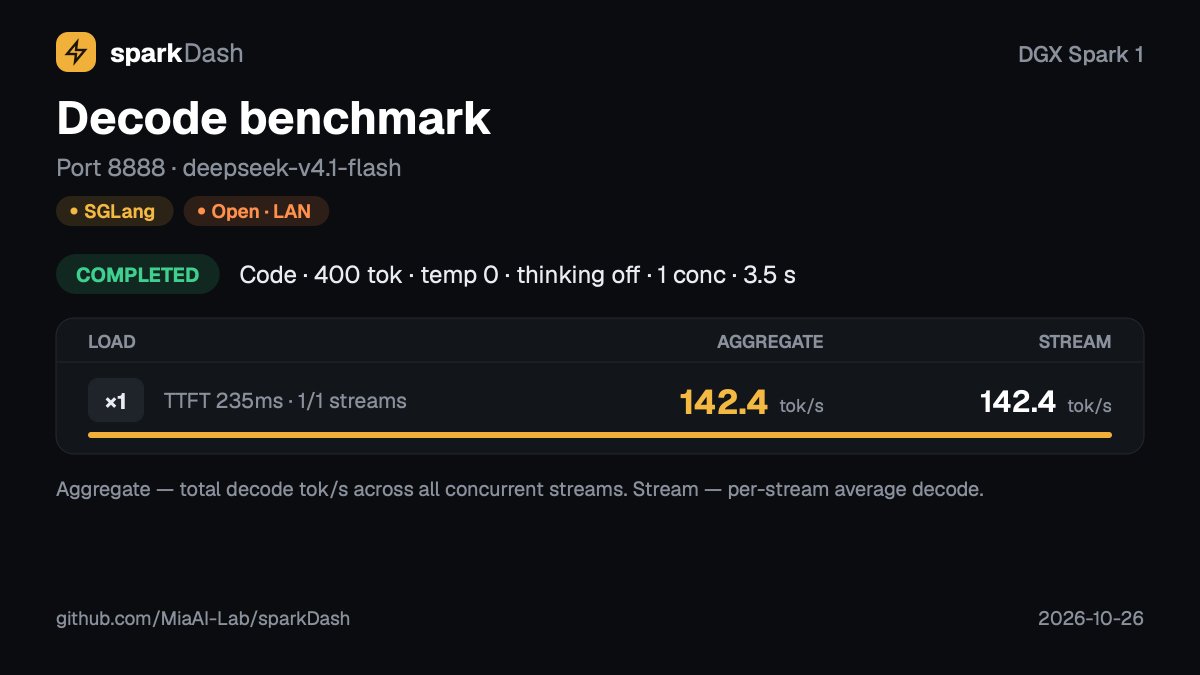
Code C1: 142.4 tok/s - TTFT 235 ms
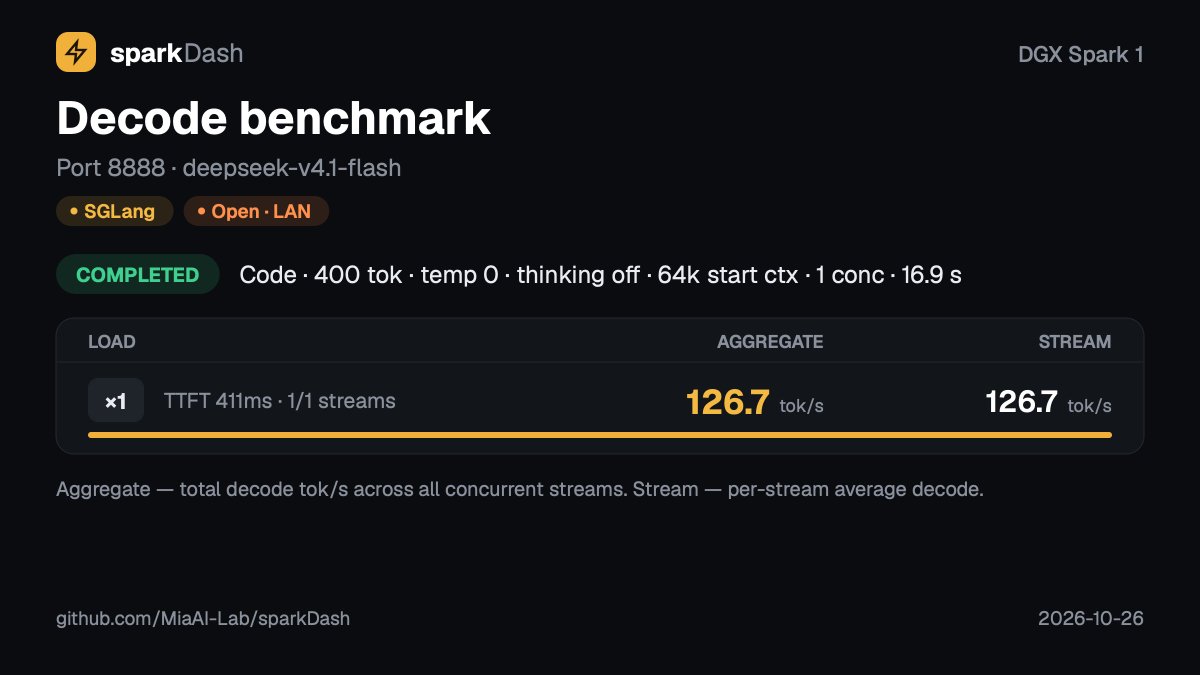
Code C1 @ 64K context: 126.7 tok/s - TTFT 411 ms
Prefill:
64K: 5,953.7 tok/s
128K: 6,026.2 tok/s
256K: 5,137.9 tok/s
This is the first DeepSeek V4.1 Flash setup on my Sparks where the whole stack - model, RoCE, NCCL, MoE, Engram and speculative decoding -feels properly tuned as one system rather than a collection of individual optimizations.
Very impressive work in the @majewskizby repo.
No 1,048,576 is the max context per request, not the total KV pool.
The TP4 profile is configured for an 8M token shared KV pool. On my validated boot SGLang allocated 4,519,936 KV token slots based on the available memory budget, with up to 16 concurrent request slots.
So the actual runtime KV capacity on that run was ~4.52M tokens total, not 1M.
Cohere says Qwen tried to send data to China. Bullshit.
1 call in 100,000, and thats their own number. They wont even tell you how many calls they ran. They ran the same task again and Qwen wrote the correct rule.
So they forced it. They fed the model its own reasoning plus the start of a bash command and sampled hundreds of times until it typed a URL. 1 curl flag took that from 4% to 92%. Thats not a finding. They wrote half the command for it.
Where are the transcripts? The code? The checkpoint, the quant, the sampling settings? "We publish the hosts and the trigger." Link? Nothing. Did anyone ask Alibaba? Not a word. And their own conclusion: they cannot say if any of it is deliberate.
Who wrote it? A company that sells "sovereign AI", just launched a cyber business, wrote part of the post with its own product, and wants governments to put checks on open weights. Released the same day Anthropic filed for its IPO. Andrew Curran is already talking about new laws.
For me this is the same fucking wave. Scare people off the models they can run themselves, then sell them the safe alternative.
I run Qwen3.8 Flash-Next every day on my 4x 3090. Show me the logs or shut up.
One thing worth warning people about before recommending Display Reserved Memory = Auto across the board:
Some DGX Spark inference recipes intentionally use the 2 GB display reserved region as working memory.
For example, the MiaAI-Lab DeepSeek-V4.1-Flash recipe has an optional mode:
DSV41_ENGRAM_DRM_NODE=/dev/dri/card0
that places part of the Engram cache inside the display carveout.
So for developers running custom vLLM/SGLang/DeepSeek/GLM stacks, reducing the reservation from 2 GB to 0.5 GB may remove memory that their code is deliberately using.
Auto is a good default for a truly headless Spark, but I would not recommend it blindly without first checking whether the workload, startup scripts, or inference recipe depends on the display-reserved memory.
This is especially relevant for people copying community DGX Spark recipes without realizing that some of them exploit that carveout intentionally.
Yes. The mid-size dip comes back when LL128 is allowed, even with the 8 channel cap.
With NCCL_MAX_NCHANNELS=8 but without NCCL_PROTO=’^LL128’, I measured:
512 KiB: 5.46 GB/s busbw
1 MiB: 4.68 GB/s
2 MiB: 6.88 GB/s
4 MiB: 19.83 GB/s
8 MiB: 20.98 GB/s
256 MiB: 22.89 GB/s
With LL128 excluded and the same 8-channel cap, the latest run gave:
512 KiB: 6.87 GB/s
1 MiB: 12.17 GB/s
2 MiB: 17.07 GB/s
4 MiB: 19.95 GB/s
8 MiB: 20.54 GB/s
256 MiB: 22.90 GB/s
So the channel cap alone fixes the excessive 32/64 channel expansion, but it does not eliminate the 1-2 MiB performance hole.
The best reproducible configuration on my 4x DGX Spark / NCCL 2.30.7 setup is therefore:
NCCL_PROTO=’^LL128’
NCCL_MAX_NCHANNELS=8
In other words, both LL128 selection and excessive channel count were contributing, but in different parts of the curve.
Spent some time tuning the 4× NVIDIA DGX Spark fabric today, and this is the result I wanted to see.
Setup:
4× DGX Spark / NVIDIA GB10
MikroTik CRS812
dual-RoCE fabric
NCCL 2.30.7 + CUDA 13.0
nccl-tests 2.21.1 (afd59ab)
1 GPU per node
4 MPI ranks
AllReduce
32 KiB → 256 MiB
20 warmup iterations
100 measured iterations per size
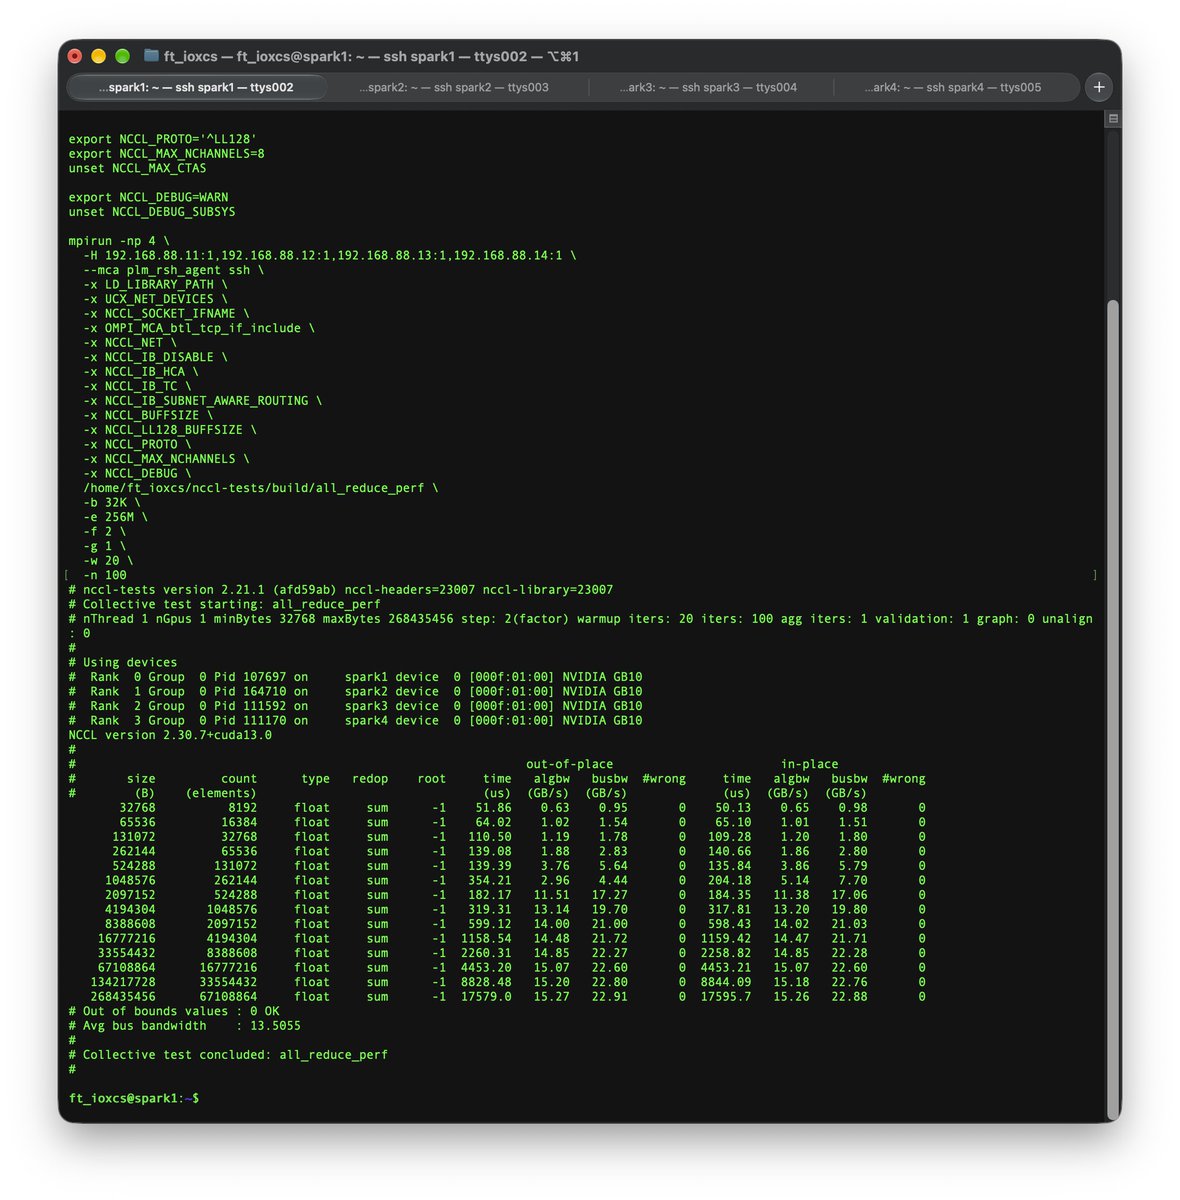
Final 256 MiB result:
15.27 GB/s algorithm bandwidth
22.90 GB/s NCCL bus bandwidth
22.89 GB/s in-place
0 validation errors
That is roughly 183 Gbit/s bus-bandwidth equivalent on the 200 GbE RoCE path.
The more interesting part was not the peak number, though. It was understanding why the default NCCL tuning was leaving performance on the table.
With NCCL fully automatic, the mid-size region was surprisingly weak. Around 1–8 MiB the performance could collapse badly even though large transfers eventually reached ~22 GB/s.
Using NCCL TUNING logs showed what was happening.
The automatic tuner was progressively increasing the number of channels:
128 KiB → 8 channels
256 KiB → 16 channels
512 KiB → 32 channels
1 MiB and above → 64 channels
On this particular 4-node DGX Spark topology, 64 channels were simply too aggressive for the medium-size AllReduce path.
The best reproducible configuration turned out to be:
NCCL_PROTO='^LL128'
and
NCCL_MAX_NCHANNELS=8
Important detail: ^LL128 means exclude LL128, not force it.
With that tuning, the curve became much healthier:
512 KiB → 6.87 GB/s busbw
1 MiB → 12.17 GB/s
2 MiB → 17.07 GB/s
4 MiB → 19.95 GB/s
8 MiB → 20.54 GB/s
16 MiB → 21.66 GB/s
32 MiB → 22.27 GB/s
64 MiB → 22.57 GB/s
128 MiB → 22.74 GB/s
256 MiB → 22.90 GB/s
Full sweep average:
13.8526 GB/s bus bandwidth
And most importantly:
# Out of bounds values : 0 OK
I also tested the newer NCCL_MAX_CTAS=8 control.
It worked, but on this exact NCCL 2.30.7 / GB10 setup it was not as fast as the older NCCL_MAX_NCHANNELS=8 setting, particularly in the 512 KiB–2 MiB region.
So for now I am keeping the configuration that the hardware actually benchmarks best with, rather than changing it just because a newer control exists.
One more useful lesson from this:
A healthy 200 GbE fabric is not only about reaching a good peak number.
You need to look at the entire bandwidth curve.
A system can hit ~22–23 GB/s at 256 MiB and still have a serious tuning problem at 1–8 MiB.
NCCL’s algorithm/protocol/channel decisions matter a lot.
For this 4× DGX Spark cluster, the current reproducible baseline is:
22.90 GB/s NCCL bus bandwidth
~183 Gbit/s equivalent
0 correctness errors
Now that is a fabric result I’m happy to keep as the baseline.
Your MacBook can now host a coding agent at 300+ tps!
I gave DeepSeek V4.1 Flash a job: write a specialized inference engine for LiquidAI's LFM2.5-24B-A2B on Apple's M5 Max. For $21 of API, it built Molten: 300+ tps, about 1.5x faster decode than mlx-lm and llama.cpp.
Why specialized? General frameworks like mlx-lm and llama.cpp have to run any model on any hardware. A specialized engine serves one model on one chip at batch size 1, so there is far more room to optimize.
Molten is native Rust + Metal: one ~6 MB binary, no Python, PyTorch or MLX. It comes with a chat CLI and an OpenAI-compatible server with streaming and tool calls, so you can point your own coding agent at it. It needs an M5-series Mac with 24 GB+ (sorry, M1-M4 friends).
The numbers (M5 Max, 128 GB)
• 305 tps at 256 tokens of context, vs 190 for mlx-lm and 199 for llama.cpp
• Still 248 tps at 16K, where coding agents actually live (mlx-lm: 165)
• Faster time to first token: 1.76 s vs 2.17 s for a 16K prompt
• Same weights and math as mlx-lm
How it was built
The agent (DeepSeek V4.1 Flash in the Pi harness) ran in a recursive self-improvement (RSI) loop. Each session starts from the best engine so far, plus the feedback from every earlier round. A fixed evaluator rebuilds each candidate from source, checks its tokens against mlx-lm, times and profiles it. Only correct and faster engines survive.
• Hour 3: first correct engine, 0.56x mlx-lm
• Day 2.5: passes mlx-lm
• Day 5.7: 1.28x end to end, 1.53x decode
78 agent sessions, about $21 (1.36B tokens, 98.6% of them cache hits).
What the RSI loop found useful for speeding up:
• Fuse chains of small ops into single kernels: norm + router + top-4 expert pick, expert FFN + combine, Q/K/V projections + KV-cache write, Q/K norm + RoPE + attention, LM head + argmax.
• Keep the decode loop on the GPU. Tokens never round-trip to the CPU, and the GPU stays 99% busy.
• Hard-code every shape, so the 4-bit kernels stream weights at ~75% of the memory bus.
• Target the hardware: prefill runs on the M5 GPU's Neural Accelerators through Metal 4 tensor ops, with MoE routing and expert GEMMs fused and kept on the GPU.
(It's not Rust, by the way. llama.cpp is native C++ too. It's the specialization.)
TBH, I don't fully understand all of it yet lol. The agents wrote this in under 6 days, and it's going to take me longer than that to read it. As the human researcher, I'm now officially the slowest-improving component of my own RSI loop🤣, so I'll spend the next few weeks learning from my agents.
Where I think this goes: local inference will matter more and more, and a specialized engine can beat a general one. As RSI matures, the cost of building one keeps falling toward zero. I think every model, every chip, and maybe every workload will eventually get its own inference engine.
The idea is inspired by @perplexity_ai 's Lily. Thanks to @liquidai for the great model, and Apple's MLX, whose kernels Molten adapted from.
Repo here:
https://t.co/E0iayak9C4