Independent UK publishing house documenting multi-asset technical analysis, structural market geometry, and behavioural discipline. No financial advice.
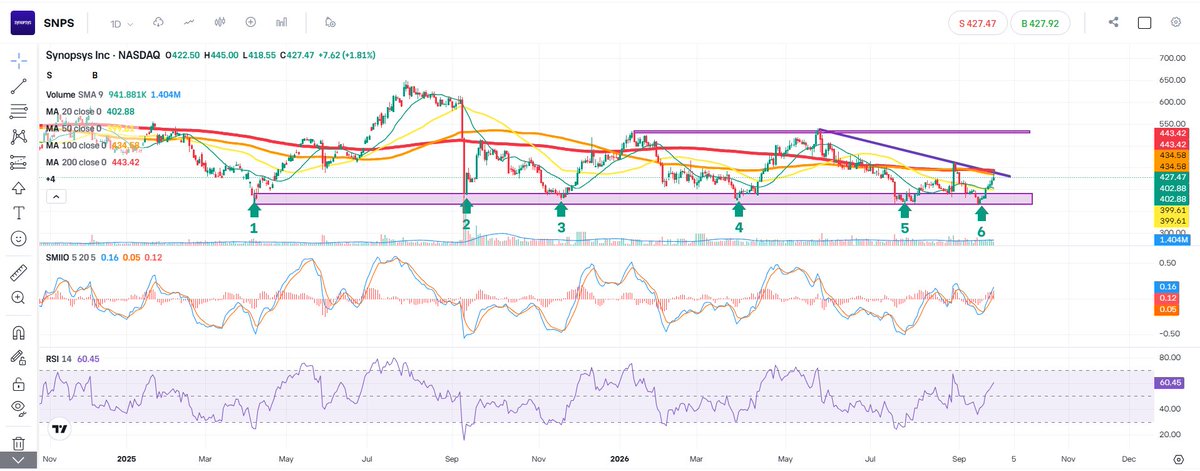
Technical Analysis Case Study: $SNPS (Synopsys)
A solid #support structure has formed across the $367–$389 range over multiple tests.
Key technical conditions chartists monitor here:
• 2 consecutive daily closes above the #Descending#Trendline
• Reclaiming and holding above the 200 DMA (~$443) • #Volume expansion with #RSI & #SMIIO confirmation.
In technical structure, clearing these levels points to the next major #resistance around $530
Warning: Educational case study only. Trading carries a high risk of loss and this does not constitute investment advice.
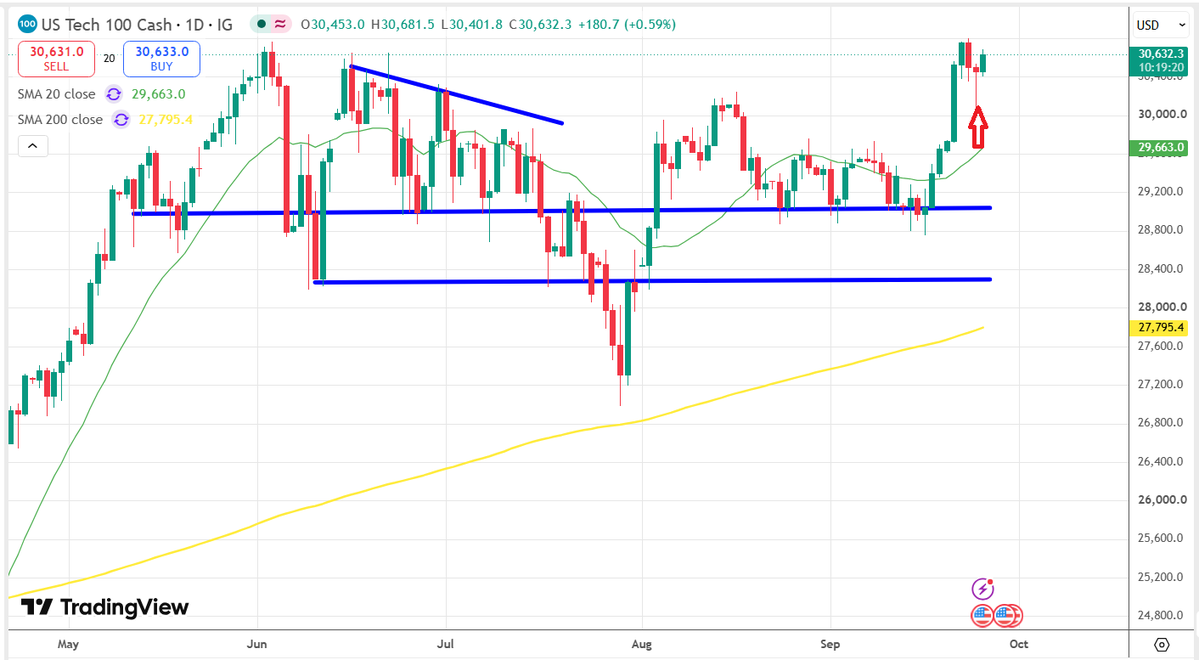
A #Bottoming#Tail is a #bullish price action reversal/absorption candle characterised by a long lower shadow (at least two to three times the range of the real body) and a compact real body positioned at the top of the session's range. It indicates that sellers attempted a deep intraday push, but encountered strong demand that completely absorbed the supply, closing the session near the high and marking a temporary or structural price floor.
Bottoming Tail Candle does not guarantee trend continuation. It only defines where buyers defended value on that single bar; overhead supply at the immediate swing high can still cap the advance.
Warning: Educational case study only. Trading carries a high risk of loss and this does not constitute investment advice.
#Nasdaq #Chart #Education
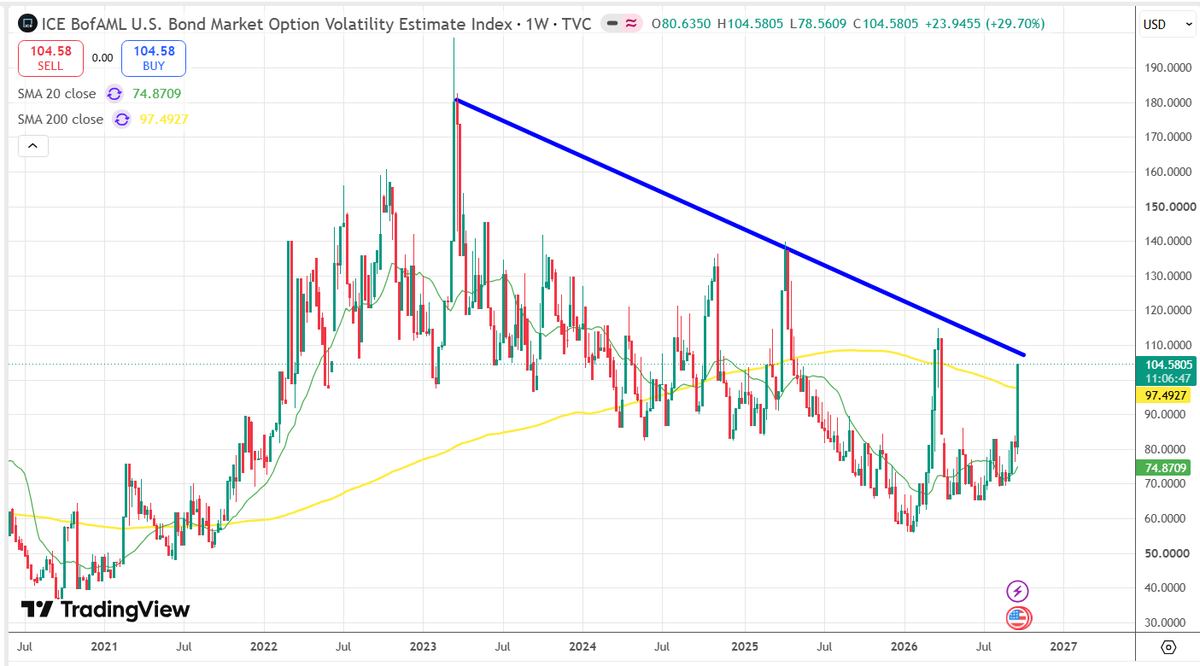
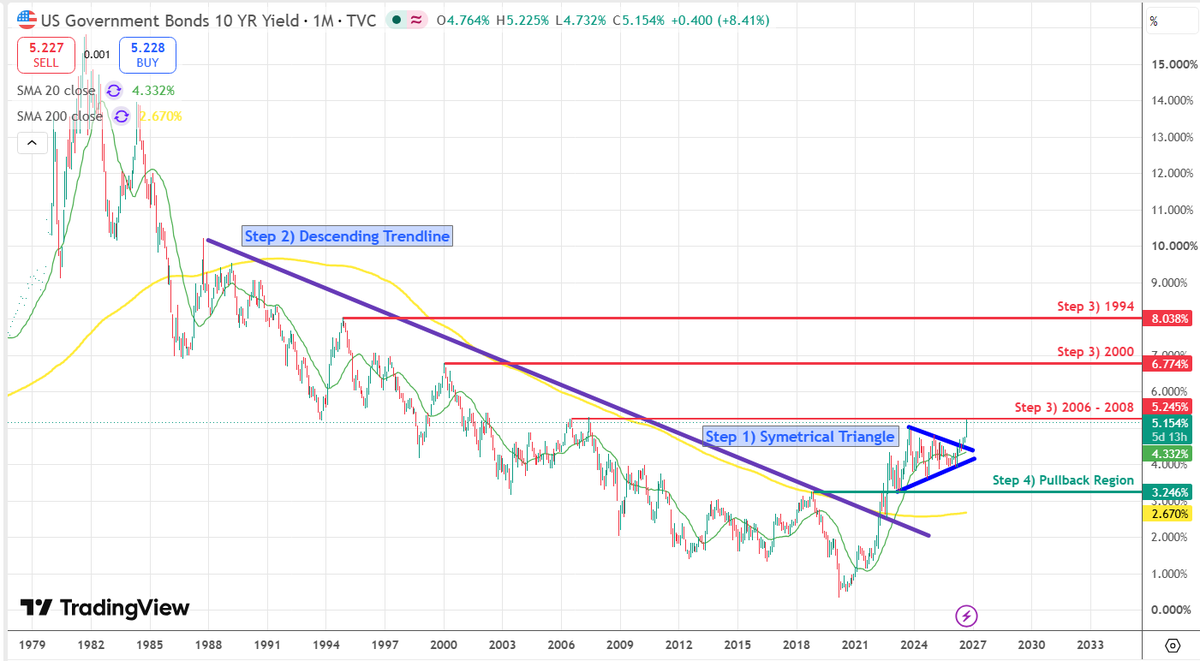
If #MOVE gets ugly, #US#Bond#Yields may get uglier.
*The MOVE Index is the VIX of bonds.
Warning: Educational case study only. Trading carries a high risk of loss and this does not constitute investment advice.
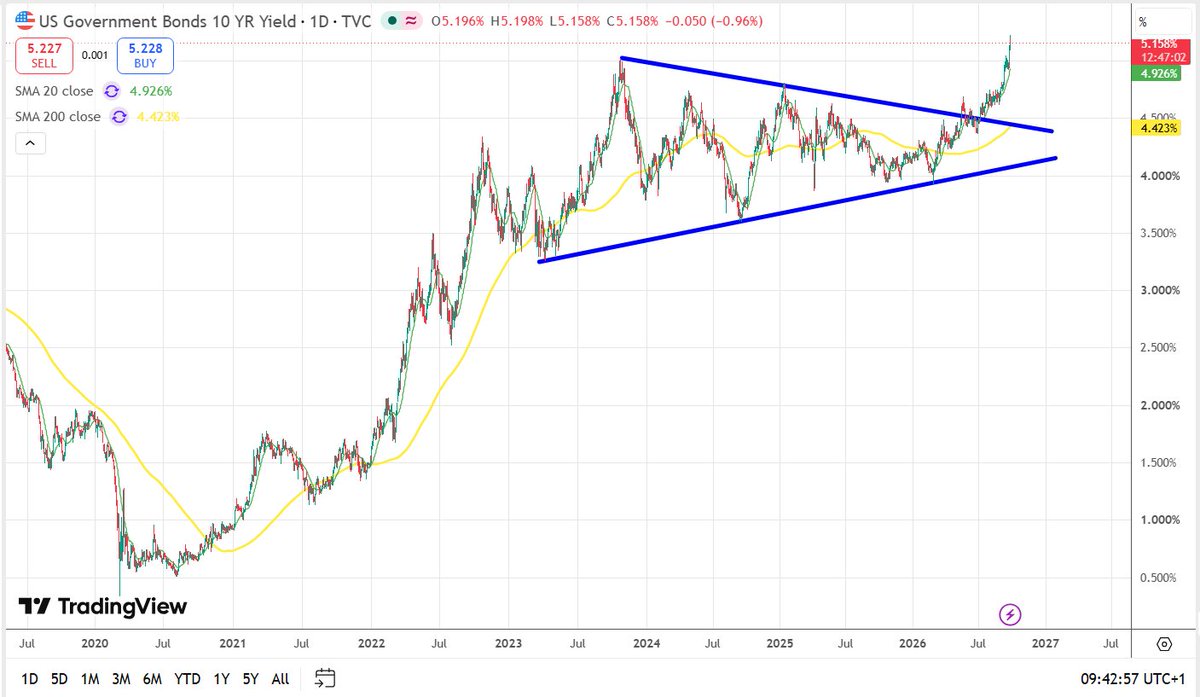
US Government Bonds 10-Year Yield
Pattern Definition: A #Symmetrical#Triangle forms during a prolonged consolidation period where both buyers and sellers compress volatility into an apex.
Because it followed a massive multi-year advance, it functions primarily as a #Bullish #Continuation pattern once #Resistance #Breaks.
Confirmation of Breakout: The #Breakout #Candle pushes above both the #Descending #Upper #Boundary (~4.50%) and the previous cycle high (~5.20%), confirming strong upward momentum rather than a False Breakout.
Macro & Market Implication: In bond markets, rising yields mean falling bond prices. A sustained breakout above multi-year highs signals tighter financial conditions, potential pressure on equity valuations, and higher borrowing costs across the economy.
Warning: Educational case study only. Trading carries a high risk of loss and this does not constitute investment advice.
Pullback Region & Structural Base (3.246%):
In technical analysis, every major consolidation pattern establishes a foundational floor that anchors the entire macro advance.
The Macro Swing Low: The 3.246% level marks the initial trough and base origin of the symmetrical triangle formed in early 2023.
Regime Shift Defense: This region represents the ultimate secular support floor. It sits directly above the broken 35-year descending trendline and comfortably above the monthly
200 SMA (~2.67%).
Trend Invalidation: While shallow corrections often find support near the apex boundaries (~4.33%–4.50%), any severe macro retracement that tests 3.246% serves as the line in the sand. As long as yields sustain above this structural base, the broader multi-decade expansion regime remains intact; a decisive monthly close below 3.246% would completely dismantle the triangle continuation thesis.
Warning: Educational case study only. Trading carries a high risk of loss and this does not constitute investment advice.
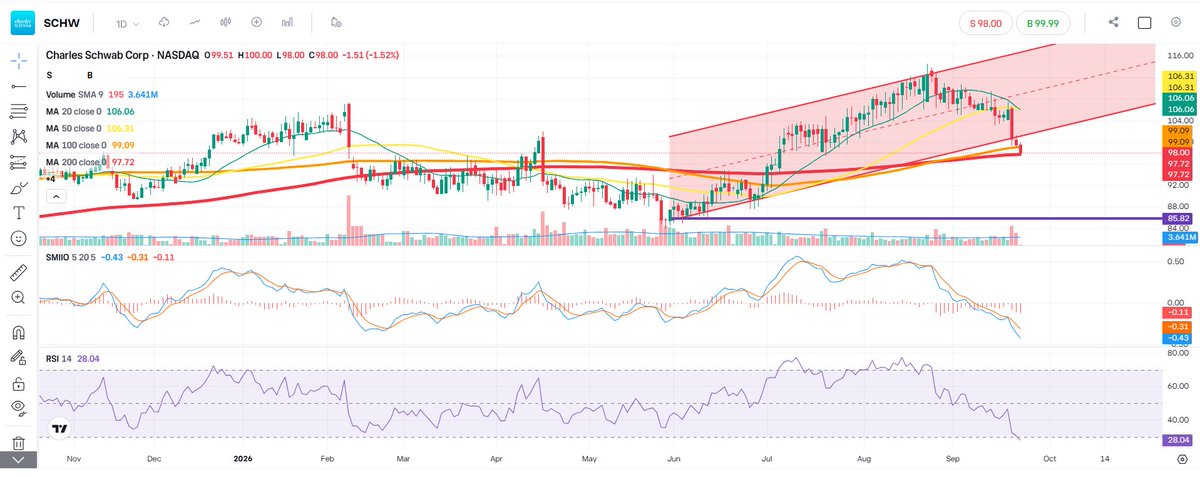
The 200 DMA serves as a key benchmark for macro bias: trading below it confirms a loss of long-term upside momentum and shifts the broader trend downward.
A sustained breach marked by two consecutive daily closes below the average validates the bearish trend continuation.
Warning: Educational case study only. Trading carries a high risk of loss and this does not constitute investment advice.
#SCHW #Techincal #Analysis #Education #Charts
ConocoPhillips (#COP) has recently broken below its #ascending#trendline from the September highs, bringing technical focus toward key dynamic moving averages.
From a macroeconomic perspective, an environment characterised by elevated interest rates alongside de-escalating geopolitical tensions in the Middle East can weigh on energy pricing sentiment.
As a result, technical analysts often observe whether a breach of medium-term support leads to #Mean #Reversion, where longer-term gauges such as the 200-day moving average (200 DMA) may serve as areas of potential interest.
Warning: Educational case study only. Trading carries a high risk of loss and this does not constitute investment advice.
#COP #ascending #trendline #200DMA
This is an example of how to use Fibonacci and the 200 DMA in #trading.
Airbnb ($ABNB): Competitive Headwinds Meet Confluence Support
Downside pressure accelerated following reports around Meta’s Muse AI agent, stirring sector wide disintermediation concerns over autonomous direct-booking capabilities.
Key Demand Zone: While the price trades near $149.00, watch the $142.16–$143.72 confluence zone (the 200 DMA, 0.236 #Fibonacci retracement, and horizontal structural support) as the critical buffer to absorb further selling.
Warning: Educational case study only. Trading carries a high risk of loss and this does not constitute investment advice.
Market Structure Lesson: Spotting Double Tops & Double Bottoms in $USDOLLAR
Double Top ("M" Pattern)
A bearish reversal structure that forms when price reaches a high, retraces, and tests that same resistance level a second time before failing. It reflects upside exhaustion and buyer fatigue near channel resistance, confirming once price breaks below the intervening trough (neckline).
Double Bottom ("W" Pattern)
A bullish reversal setup that occurs when price hits a low, rebounds, and revisits that level only for buyers to step in and defend the floor. It signals downside exhaustion and accumulation, confirming once price pushes through the intervening swing high.
Current Market Context & Confluence:
1) Moving Average Confirmation: The Index has reclaimed and held above both the 20 DMA (confirming short-term directional strength) and the 200 DMA (confirming broader long-term bias) on 15th September.
2) Critical Area of Interest: Price is currently testing key horizontal resistance (purple area).
3) Channel Dynamics: The Lower Boundary of the Major Ascending Channel, which was previously acting as Support before the breakdown, is now being tested as overhead resistance.
Watch how price reacts inside this Resistance Zone: whether Momentum can reclaim the channel or if seller supply triggers a rejection at this confluence. Always wait for confirmed structural breaks before committing risk.
Warning: Educational case study only. Trading carries a high risk of loss and this does not constitute investment advice.
The way to identify Resistance Level on $HOOD as an example is by zooming out to a higher-timeframe view filters out market noise, revealing the major historical supply zones identified as Resistance Levels 1, 2, and 3.
Warning: Educational case study only. Trading carries a high risk of loss and this does not constitute investment advice.
Educational #Chart breakdown on $ETN :
Price is once again testing critical resistance at $435. Key technical observations:
• Tests 1 & 2 rejected sharply at this level.
• The August push above $435 turned into a classic False Breakout / Bull Trap, reverting quickly below the horizontal line.
• Currently bouncing off $409 support and testing the ceiling again.
A textbook lesson on why waiting for confirmation is critical before trading breakouts.
Keep it on watch.
📊#TechnicalAnalysis #TradingTips #ETN #Stocks
Current $AMD (#AMD) chart is one of the examples where the Trailing Stop Loss should be used.
A Trailing Stop Loss is a dynamic order designed to protect gains by moving the stop-loss price alongside a favorable market move while remaining fixed if the market reverses.
Warning: Educational case study only. Trading carries a high risk of loss and this does not constitute investment advice.
$META (#META) has still a bit of room based on Trading Structure that chart suggested.
Warning: Educational case study only. Trading carries a high risk of loss and this does not constitute investment advice.
Check out the chart of $DJ30 (#DowJones) we've shared.
US CPI has just been released.
And this is the power of breaking out the descending trendline on hourly Dow Jones.
When the US markets open, the direction will be confirmed.
Warning: Educational case study only. Trading carries a high risk of loss and this does not constitute investment advice.
Technical analysis tells part of the story, but fundamentals drive the macro trend.
Completely agree with Liz's view on the Fed holding rates.
Worth a read: https://t.co/s6BrDGgqo6
Check out the chart of $FCX we've shared
Market Commentary & Educational Breakdown
The Macro & Fundamental Narrative:
Copper is a indispensable structural input for artificial intelligence buildouts and power grid scaling. As one of the world’s foremost producers, Freeport-McMoRan (#FCX, $FCX) functions as a primary equity proxy for global copper trends. However, persistent upside pressure in US and European benchmark yields keeps monetary policy restrictive, raising questions about whether high interest rates will cool the broader economy. Copper’s price action acts as a primary barometer for whether industrial demand remains resilient in the face of these financial conditions.
Technical Focus — The Polarity Principle at $70:
#FCX broke out decisively above the critical $70 threshold on 21 August 2026, reaching into the upper $70s before initiating its current pullback. From an educational market structure perspective, the immediate question is not about chasing momentum, but testing polarity: will the former multi-month resistance ceiling at $70 successfully flip into a durable support shelf?
The Confirmation Checklist:
A breakout only gains structural validity if buyers step in to defend the level on its initial retest. The chart demands patience: we must watch for daily absorption candles, drying seller volume at the retest zone, and clear price stabilization above $70. If the level holds on daily closes, role reversal is confirmed; if price breaches and closes below it with conviction, the move risks being classified as a false breakout (upthrust), opening the door for a deeper mean reversion toward lower moving averages.
Risk Management First:
Levels on a chart are hypotheses, not guarantees. Disciplined execution requires waiting for market confirmation at the level and clearly defining the exit anchor before any position is established.
Warning: Educational case study only. Trading carries a high risk of loss and this does not constitute investment advice.
A falling wedge pattern typically signals bullish continuation or reversal as downside momentum contracts within converging trendlines.
Using #GEV as a case study, this setup illustrates how to identify and draw the pattern structure.
Further confirmations are needed for direction, but position sizing remains the critical factor in risk management.
Warning: Educational case study only. Trading carries a high risk of loss and this does not constitute investment advice.