CRO & A/B Testing: More revenue from your existing traffic with prediction-based experimentation | $500M+ added for SNOCKS, AG1 and 250+ other DTC brands
We can now predict how likely an A/B test is to win before anyone builds it.
Since we started picking our tests by those odds, our win rate went from 27% to 55%, which still feels a bit crazy to me (across the industry, about 1 in 10 tests wins).
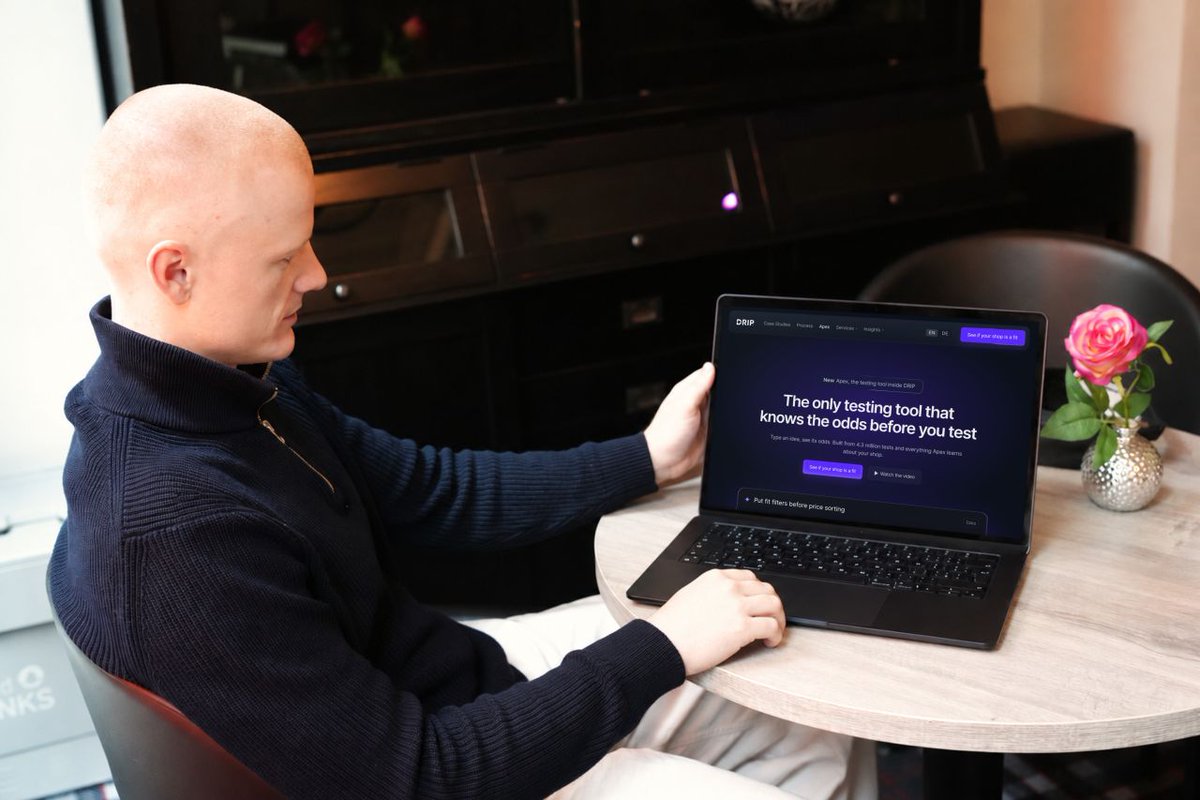
Today we're launching the testing tool that does it. It's called Apex, it's the biggest thing we've built in eight years of DRIP, and as far as I know nobody else has anything like it.
Apex has seen how 4.3 million A/B tests from more than 150,000 shops ended.
So when you type in an idea, it checks how ideas like it went for shops like yours (for a social proof test, that's about 82,000 of them), adds what your own past tests have taught it, and gives the idea a score.
The high scores get built, the low ones never touch your traffic, and every result goes back in, so the scores get sharper every month.
More winners is where the money is.
Most shops run one test at a time, four a month at best, and at 1 in 10 that's maybe five winners a year.
With Apex we run six to ten side by side at all times, and at 55% that's three to five winners every month, each one stacking on top of the last.
I've wanted such tool since we started DRIP, and I'm really proud of my team who built it.
If your shop does at least six figures a month and you want to be one of the first to get a free demo of Apex, apply here: https://t.co/c7tgYzotRj
Promoting new products in the header lifted conversion rate by 2.21%.
We tested highlighting fresh arrivals right in the site header for a fitness brand like BLACKROLL.
The "obvious" tweak? It sparked curiosity where old banners fell flat.
How does Apex assess this idea?
Apex gives it a 45% likelihood to win. Among the 25 most similar market tests, only 8% of these changes were kept, which is around the typical rate for this kind of test.
The reasoning: Header promotions of new products rarely lift revenue per visitor, because most shoppers arrive with a specific need and ignore the bar.
We built one of the largest A/B test databases in e-commerce: 4.3 million tests from 151,000 shops, since 2011.
On top of it we built our own testing tool, Apex.
Apex tells you which test is likely to win before you build it, and runs your whole testing program in one place.
What happened at BLACKROLL?
The conversion-rate movement is a directional signal, not a claim of statistical significance.
Results across all devices:
- ARPU: €2.84 to €2.90 (+2.04%)
- Conversion rate: +2.21%
- AOV: +0.15%
Mobile users loved it (+3.21% ARPU), while desktop dipped slightly (-0.49%). Overall winner, statistically significant.
Why might this have happened?
Neomania hit hard. That "new" label triggers a dopamine rush for novelty, pulling browsers deeper into exploration.
Users aren't just scrolling; they're hunting fresh finds, turning passive visits into impulse adds.
No flashy redesign needed. Just feeding the innate crave for what's next boosted engagement and spend without overwhelming the layout.
The test measured purchasing outcomes; these explanations are hypotheses about why they changed.
The takeaway:
Your header isn't decoration. It's prime real estate for FOMO. Test swapping static promos for "new" to wake up dormant traffic.
Follow me (@FabianGmeindl_) for more CRO tips and insights
Would you ask a Black Friday shopper for their email before giving them a first-order discount?
Same product. Same price at checkout. The only difference is whether the shopper has to sign up to get the offer.
In our Black Friday Testing Report, shops kept changes that rewarded a sign-up at 1.41× the average keep rate. For offers that didn’t require a sign-up, it was 1.06×.
That’s how often shops kept the change. It doesn’t mean asking for an email increased sales by 41%.
Here’s what I’d want to know before testing this on my own store: does the sign-up bring in subscribers at the expense of first orders?
We built one of the largest A/B test databases in e-commerce: 4.3 million tests from 151,000 shops, since 2011.
On top of it we built our own testing tool, Apex.
Apex tells you which test is likely to win before you build it, and runs your whole testing program in one place.
I’d keep the discount, the product page and the eligibility rules identical. One group gets the offer straight away. The other enters an email to unlock it.
Then I’d look at two numbers side by side: sign-ups per eligible visitor and first orders per eligible visitor.
If more people subscribe but fewer buy, I’d check whether those new subscribers come back and purchase before making the sign-up a permanent step.
Follow me (@FabianGmeindl_) for more practical CRO, e-commerce experimentation, and A/B testing insights.
Black Friday is 14 days away.
On Monday I wrote that a lot of shops stop testing in November. The ones that do test usually start late: the typical Black Friday test starts four days before the day itself.
So the traffic you pay the most for all year often lands on an offer that was never tested.
With two weeks left, you won't test everything. But you don't have to decide on a hunch either.
On Wednesday I shared what wins on Black Friday, from our database of 4.3 million A/B tests. A discount code was kept 1.82 times as often as the average test, an automatic discount 1.20 times. Early access 1.58 times, an open sale 1.07.
That's a better starting point than the offer that just feels right. Use the time you have left for the one or two tests that matter most on your own shop.
To pick those, every idea in Apex gets a Likelihood to Win: one percent, like 72%, that says how likely it is to win compared with the other ideas in your backlog.
We built one of the largest A/B test databases in e-commerce: 4.3 million tests from 151,000 shops, since 2011.
On top of it we built our own testing tool, Apex.
Apex tells you which test is likely to win before you build it, and runs your whole testing program in one place.
Link in the reply.
100+ A/B test ideas with a high Likelihood to Win for e-commerce managers ↓
Most test backlogs are long.
The hard part is choosing what goes live first.
So I pulled 100+ A/B test ideas from €100M e-commerce brands.
Apex gave every one of them a Likelihood to Win of 80% or higher.
What's inside:
1/ Homepage
Hero banners, menus and deal sections.
2/ Listing pages
Size filters, product cards and bestseller badges.
3/ Product pages
Reviews, pay later badges and sticky add-to-cart buttons.
4/ Cart and checkout
Free gifts, free shipping bars and delivery dates.
Every idea comes with the before and after screen, the hypothesis and its Likelihood to Win.
Pick the ideas that fit your shop.
Then see how they compare with the ideas already on your list.
We built one of the largest A/B test databases in e-commerce: 4.3 million tests from 151,000 shops, since 2011.
On top of it we built our own testing tool, Apex.
Apex tells you which test is likely to win before you build it, and runs your whole testing program in one place.
WANT THE FULL LIST?
I'll send it over.
Showing price differences to larger options lifted conversion rate by 11.52%.
We highlighted price differences to upsized options on our base PDP for BLACKROLL's recovery bases.
The winner? Showing deltas only to pricier variants.
How does Apex assess this idea?
Apex gives it a 67% likelihood to win. Among the 25 most similar market tests, 12% were kept, slightly above the typical 8% for tests of this kind.
The reasoning: Extra price comparisons on the product page often add clutter without shifting size choice, so most shops remove them again.
We built one of the largest A/B test databases in e-commerce: 4.3 million tests from 151,000 shops, since 2011.
On top of it we built our own testing tool, Apex.
Apex tells you which test is likely to win before you build it, and runs your whole testing program in one place.
What happened at BLACKROLL?
The conversion-rate movement is a directional signal, not a claim of statistical significance.
Results across all users:
→ Conversion rate: +11.52%
→ ARPU: +12.93%
→ AOV: +1.23%
The revenue result was reported as statistically significant, with mobile seeing +13.13% ARPU and desktop +12.81%.
Why might this have happened?
Showing only the upgrade price differences may have made the options easier to compare. The experiment does not establish that anchoring was the mechanism.
The takeaway: Test how you present upgrade costs; more comparisons are not automatically more helpful.
Follow me (@FabianGmeindl_) for more CRO tips and insights.
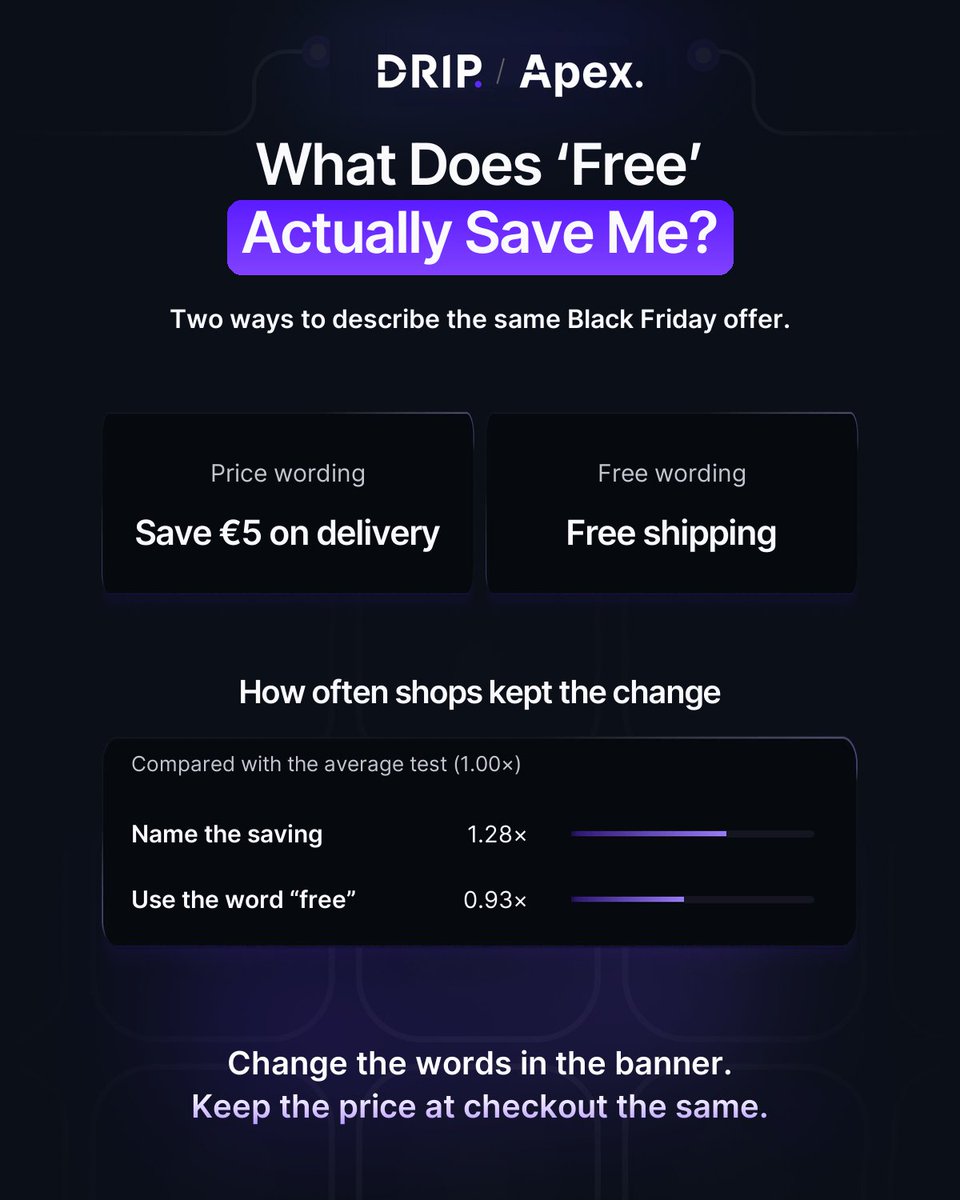
Your usual delivery fee is €5. For Black Friday, you waive it.
What goes in the banner?
“Free shipping.”
“Save €5 on delivery.”
Both lines lead to the same checkout total. But a first-time visitor who has never paid your delivery fee can only tell what the offer is worth from the second line.
Our Black Friday Testing Report gives us a reason to test that distinction.
When the wording named the price or saving, shops kept the change at 1.28× the average test rate.
When the wording used “free”, shops kept it at 0.93× the average rate.
Those figures describe what shops kept across different tests. They don’t tell us that “Save €5” beat “Free shipping” in a head-to-head test.
Here’s the question I’d put in the backlog: if shoppers know the amount they’re saving, are more of them likely to complete a purchase?
We built one of the largest A/B test databases in e-commerce: 4.3 million tests from 151,000 shops, since 2011.
On top of it we built our own testing tool, Apex.
Apex tells you which test is likely to win before you build it, and runs your whole testing program in one place.
For your next Black Friday test, put the two lines in the same spot on the page. Keep the delivery fee, eligibility rules and checkout total identical.
Compare purchases per visitor in each group. That gives you a reason to keep one line next time you run the same offer.
Follow me (@FabianGmeindl_) for more practical CRO, e-commerce experimentation, and A/B testing insights.
Yesterday I wrote that the biggest decision most shops make for Black Friday is a price.
But the price is only one part of it. Black Friday is 18 days away, and for most shops it's the busiest week of the year: more traffic, more ad spend, and less room for mistakes.
That's also why a lot of teams stop testing in November. Nothing new goes live, the site gets frozen, and everyone waits for December.
I get why. Nobody wants to break something in the week that matters most. But the decisions still get made. Which offer goes on the homepage, how the discount is shown, what the product page says, which page the ads send people to. They just get made without evidence.
And once the week is over, it's hard to say what worked. Was it the offer, the page, or simply the traffic?
Last week I showed you Likelihood to Win, which helps you decide which idea to test first. Before Black Friday that question matters more than usual, because there's only time for a few tests.
There's also a reason to start now. A test needs enough visitors before you can read it, and you want to read it before the busiest week, not during it.
This week I want to talk about Black Friday.
We built one of the largest A/B test databases in e-commerce: 4.3 million tests from 151,000 shops, since 2011.
On top of it we built our own testing tool, Apex.
Apex tells you which test is likely to win before you build it, and runs your whole testing program in one place.
If you're still deciding what your shop does for Black Friday, follow along.
100+ A/B test ideas with a high Likelihood to Win for e-commerce managers ↓
Most test backlogs are long.
The hard part is choosing what goes live first.
So I pulled 100+ A/B test ideas from €100M e-commerce brands.
Apex gave every one of them a Likelihood to Win of 80% or higher.
What's inside:
1/ Homepage
Hero banners, menus and deal sections.
2/ Listing pages
Size filters, product cards and bestseller badges.
3/ Product pages
Reviews, pay later badges and sticky add-to-cart buttons.
4/ Cart and checkout
Free gifts, free shipping bars and delivery dates.
Every idea comes with the before and after screen, the hypothesis and its Likelihood to Win.
Pick the ideas that fit your shop.
Then see how they compare with the ideas already on your list.
We built one of the largest A/B test databases in e-commerce: 4.3 million tests from 151,000 shops, since 2011.
On top of it we built our own testing tool, Apex.
Apex tells you which test is likely to win before you build it, and runs your whole testing program in one place.
WANT THE FULL LIST?
I'll send it over.
Bestseller tiles in mobile navigation reduced conversion rate by 1.24%.
For BLACKROLL, this was the test:
Our "smart" idea to spotlight top products? Total backfire.
We embedded three bestseller product tiles directly into the mobile navigation menu. The goal: Cut cognitive load, highlight hits, and speed up decisions via cognitive ease principles.
How does Apex assess this idea?
Apex gives it a 21% likelihood to win. Among the 25 most similar market tests, only 4% were kept, below the typical 8% for this kind of change.
The reasoning: Adding product tiles to mobile navigation usually clutters the menu and distracts from browsing, so shoppers rarely buy more.
We built one of the largest A/B test databases in e-commerce: 4.3 million tests from 151,000 shops, since 2011.
On top of it we built our own testing tool, Apex.
Apex tells you which test is likely to win before you build it, and runs your whole testing program in one place.
What happened at BLACKROLL?
The conversion-rate movement is a directional signal, not a claim of statistical significance.
But metrics nosedived across mobile users:
- ARPU: -2.24% 📉
- Conversion rate: -1.24% 📉
- AOV: -1.01% 📉
The revenue result was reported as statistically significant.
Why might this have happened?
Shoppers didn't see shortcuts; they saw distractions. Those tiles pulled focus from their actual search, adding clutter instead of clarity. Mobile users crave streamlined paths, not pop-up temptations that feel irrelevant or pushy.
This "optimization" disrupted flow, spiking hesitation right where speed matters most.
Lesson learned: Even proven psych hacks flop without context. Mobile nav is sacred ground; don't clutter it unless data screams for it.
The test measured purchasing outcomes; these explanations are hypotheses about why they changed.
Follow me (@FabianGmeindl_) for more CRO tips and insights
Sometimes your team already knows the test idea it wants to consider.
Sometimes the starting point is a question: what should we test next?
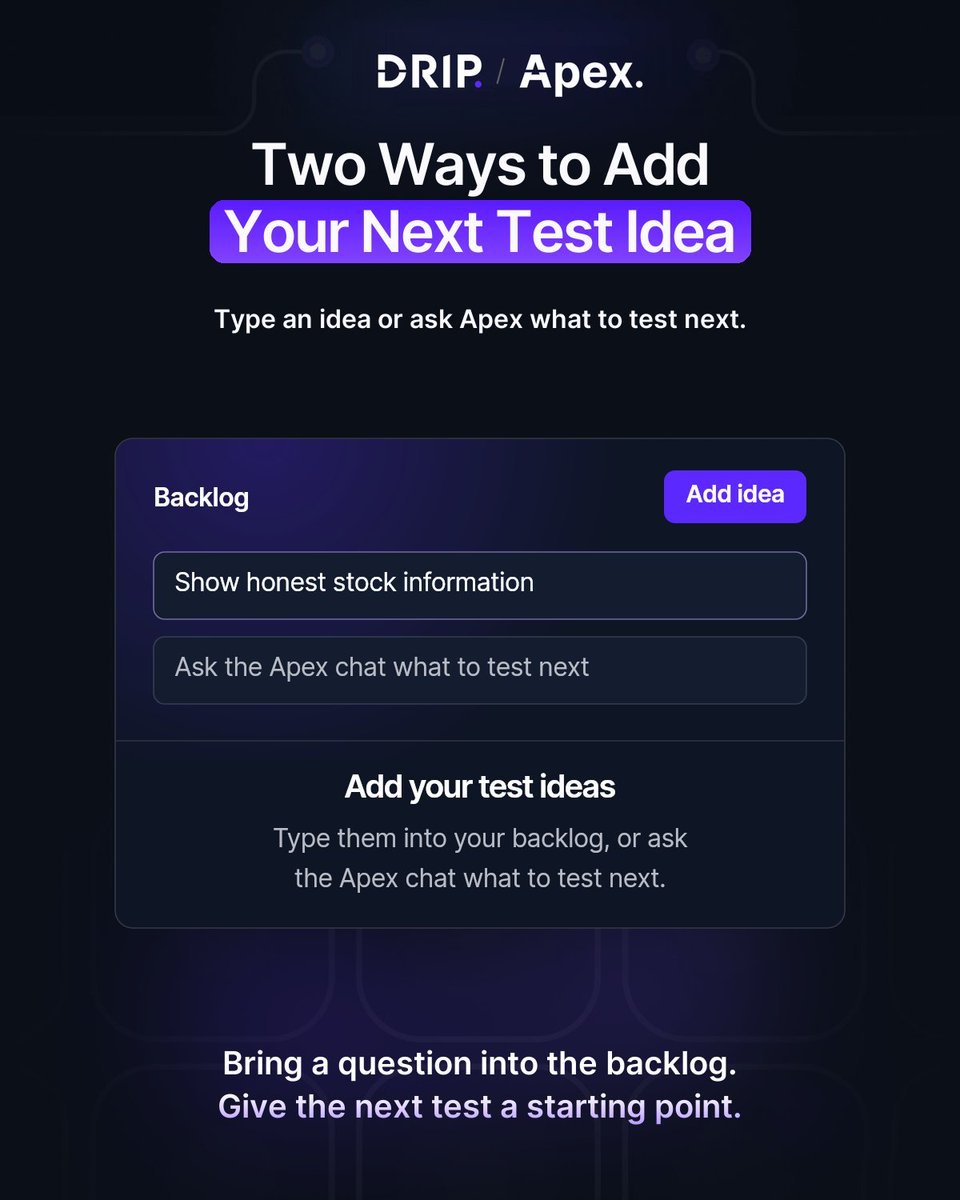
The Likelihood to Win workflow in Apex gives you two ways to add ideas.
01 - Type an idea into the backlog.
Use this route when you already have a candidate to review.
02 - Ask Apex chat what to test next.
Use this route when you want help finding a starting point.
From there, each idea gets a Likelihood to Win score and a position in your backlog. Apex also shows the number of tests supporting the score.
Both routes lead into the same selection workflow.
You can review the candidates, choose the next one, then build, launch and read the test in Apex.
The score helps with that choice. It does not remove the need to run the experiment and read its result.
We built one of the largest A/B test databases in e-commerce: 4.3 million tests from 151,000 shops, since 2011.
On top of it we built our own testing tool, Apex.
Apex tells you which test is likely to win before you build it, and runs your whole testing program in one place.
For your next review, choose the entry route that fits your starting point.
Add the candidate, inspect its score and evidence, and decide whether it is the next test to build.
Follow me (@FabianGmeindl_) for more practical CRO, e-commerce experimentation, and A/B testing insights.
You bring a test idea to the team meeting, and someone asks why this one should go first.
Most of the time the answer is a competitor's shop, a gut feeling, or the fact that it's quick to build. I get why. But it's hard to defend.
That's the question Likelihood to Win answers. On Tuesday I showed you how: every idea gets one percent, like 72%, that says how likely it is to win compared with the other ideas in your backlog.
Today I want to show you where that number comes from.
You type an idea and Apex scores it: how likely it is to win, built from matched evidence in 4.3 million tests, research on your shop and your own live results.
That last one is the one I care about most. Every result read on your shop flows back the same day and sharpens the next prediction. That's why the odds keep getting sharper on your shop specifically.
So the next time someone in the meeting asks why, you open the score. The evidence is right there: how many similar tests the market ran, what they changed and how they ended.
Every idea still runs as a measured A/B test. The prediction decides what to test first, the test decides what ships.
We built one of the largest A/B test databases in e-commerce: 4.3 million tests from 151,000 shops, since 2011.
On top of it we built our own testing tool, Apex.
Apex tells you which test is likely to win before you build it, and runs your whole testing program in one place.
The backlog sorts itself. Ideas that earned their odds move up and become the plan. Link in the reply.
Online shops keep a Black Friday discount code almost twice as often as the average test.
I ranked 12 Black Friday tests by how often online shops kept them ↓
Most Black Friday plans start the same way:
→ The same discount as last year
→ A free shipping banner
→ Trust badges and payment icons above the button
Two of those three land at the bottom of the ranking.
So before you lock in your Black Friday tests, look at what other shops actually kept.
Here's what's inside:
1/ The full ranking
12 Black Friday tests, from most to least likely to win, compared with the average test.
2/ A real before and after for every test
See exactly what each shop changed, screen by screen.
3/ The tests at the bottom
Free shipping, trust badges and one more popular idea that shops keep less often than you'd think.
4/ Our own urgency tests
Three low-stock tests we ran for brands we work with, with the before and after.
5/ Where to start
How to use the ranking to pick what to test first on your store.
We built one of the largest A/B test databases in e-commerce: 4.3 million tests from 151,000 shops, since 2011.
On top of it we built our own testing tool, Apex.
Apex tells you which test is likely to win before you build it, and runs your whole testing program in one place.
WANT THE RANKING?
I'll send it over.
Every test idea in Apex shows how likely it is to win, before you build it.
We're building Apex to help online shops get more revenue from the traffic they already pay for.
Copied from a competitor, or just a hunch? That's how a lot of test ideas end up in the backlog.
With Likelihood to Win, every idea gets one percent, like 72%, that says how likely it is to win compared with the other ideas in your backlog. You see how many tests back each number, and your ideas are sorted so the next test you build is the one at the top.
It tells you what to test next. It doesn't promise that a test wins.
The short film below shows how it works, step by step. Link in the reply.
You've probably tried it yourself. You ask Claude Code for a landing page, and you have a first version to work with.
Then you publish it somewhere else. You link it to your ads. And from there, you don't really know how it's doing.
That's the part we built into Apex.
Your agent builds the page. One command puts it live, on your Apex host or your own domain. Every change becomes a new version, and you can go back to the last one.
Connect your Meta ad account, and every page shows revenue per visitor and return on ad spend. Per page, and per ad.
Last week I asked what a landing page actually earned for the money you put behind it. This is how we answer it.
We built one of the largest A/B test databases in e-commerce: 4.3 million tests from 151,000 shops, since 2011.
On top of it we built our own testing tool, Apex.
Apex predicts which tests are likely to win before they go live, and runs your whole testing program in one place.
Landing pages are switched on per shop, and we set them up with you.
More revenue from the traffic you already pay for starts with knowing what each page earns. Link in the reply.
The Full Guide to Landing Pages in E-Commerce (2026 Edition)
I’ve put together a 32-page guide on where the big ads send their clicks, what shops test there and what they keep.
Every example in it is a real test from a real store.
Here’s what’s inside:
1/ Where the clicks land
About a third of the reach of Meta ads goes straight to a product page. See where the rest goes.
2/ What shops keep
The levers shops keep most often on landing pages, ranked: one page per audience, a small first step, a real reason to buy now.
3/ Offers and pricing
How shops put the offer in the first screen and show the saving where the decision is.
4/ Advertorials and listicles
Fewer than 1 in 20 Meta ads go to one. See what shops test when they do.
5/ Real tests from shops
The page before and the version the shop tested, with the change marked, and ten tests to run next.
Use it to pick the page your next ad deserves.
The next question is which test to run first.
We built one of the largest A/B test databases in e-commerce: 4.3 million tests from 151,000 shops, since 2011.
On top of it we built our own testing tool, Apex.
Apex tells you which test is likely to win before you build it, and runs your whole testing program in one place.
WANT THE GUIDE?
I’ll send it over.
“Hot” badges on product listings lifted conversion rate by 8.00%.
For KICKZ, this was the test:
A small visual cue led to:
How does Apex assess this idea?
Apex gives it a 45% likelihood to win. Among the 25 most similar market tests, 8% were kept, which is around the typical rate for this kind of test.
The reasoning: Highlighting popular or hyped items rarely shifts buying behaviour enough, since shoppers usually arrive with a product in mind and ignore extra badges.
We built one of the largest A/B test databases in e-commerce: 4.3 million tests from 151,000 shops, since 2011.
On top of it we built our own testing tool, Apex.
Apex tells you which test wins before you build it, and runs your whole testing program in one place.
What happened at KICKZ?
→ Conversion rate: +8.00%
→ ARPU: +17.51%
The conversion-rate movement is a directional signal, not a claim of statistical significance.
→ Conversion rate: +8.00%
This wasn’t a redesign.
It was a better decision-making shortcut.
We highlighted selected popular products with a simple “Hot” badge on the listing page.
Same products.
Same page.
Just clearer guidance.
Why might this have happened?
1. It directed attention fast
2. It signaled popularity through social proof
3. It added light urgency without gimmicks
The bigger lesson:
Teams often look for gains in more filters, more personalization, or more complexity.
But sometimes the win is simpler:
Help customers spot what’s already in demand.
Less friction. Better choices. More revenue.
The test measured purchasing outcomes; these explanations are hypotheses about why they changed.
Follow me (@FabianGmeindl_) for more real Ecom CRO breakdowns.