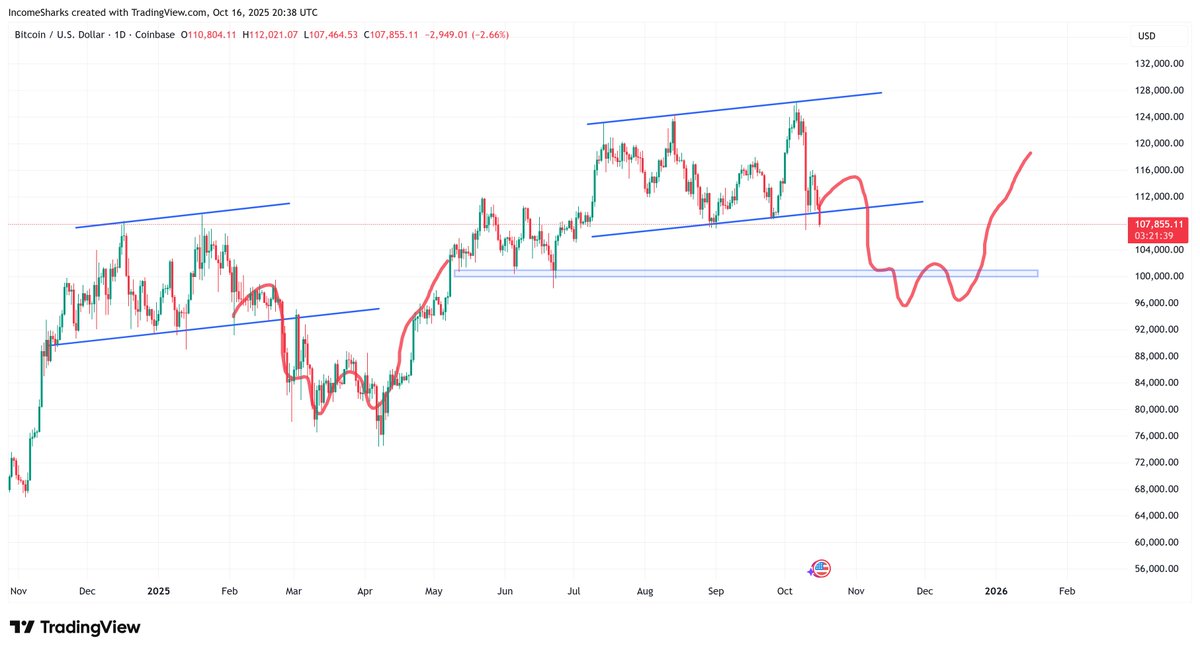
The #BTC chart we all need to know:
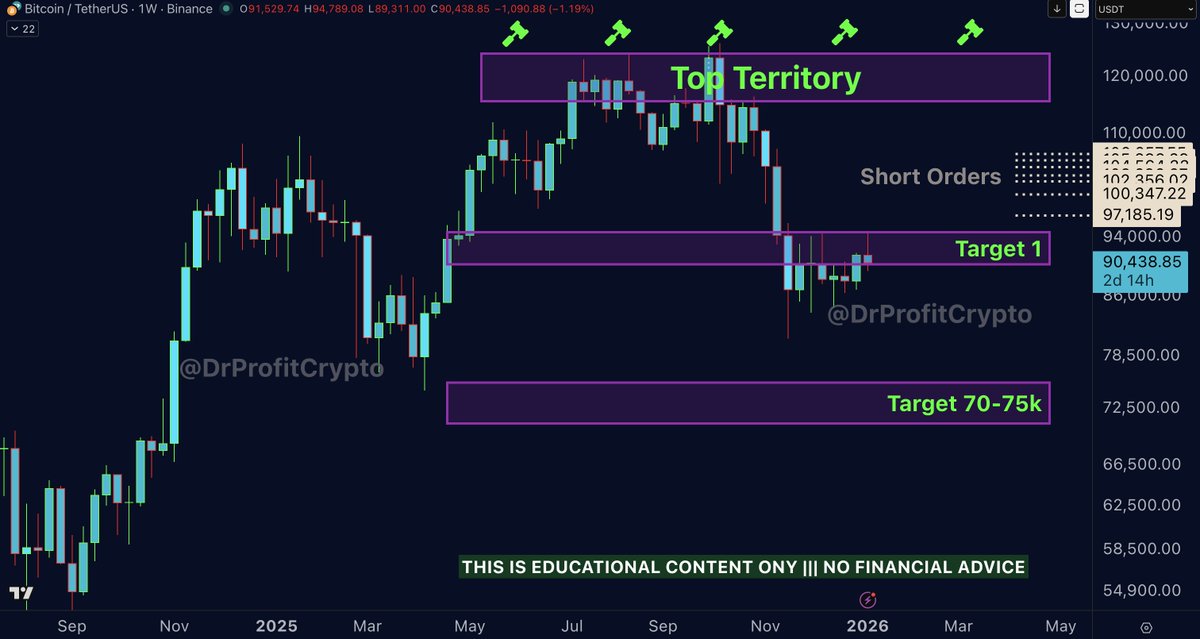
In August 2025 I started to prepare my short orders between 115-125k that triggered in September - October. After the big move that lead us to target 1 at 80k I said its time to expect some sideway moves in the same region. Since 7 weeks we are moving in the same region exactly as predicted two months ago.
We are now targeting the 70–75k zone as the next major objective. Does it mean I would add more short at the current region? HELL NO! The only area where I’m willing to add aggressively to the existing short from 115-125k is on a up move into 97k–107k. Any move into that region is an opportunity to increase size with real size.
So in Summary its very simple:
- Keep shorts open from 115-125k
- Placing short orders from 97-107k
- Having a BTC spot position open from 85k
- BTC spot position SL is set at entry area
- Next target is BTC at 70k region, bearish
#Bitcoin/ Stock market – What’s Next?
The Big Sunday Report: All You Need to Know
🚩 TA / LCA / Psychological Breakdown:
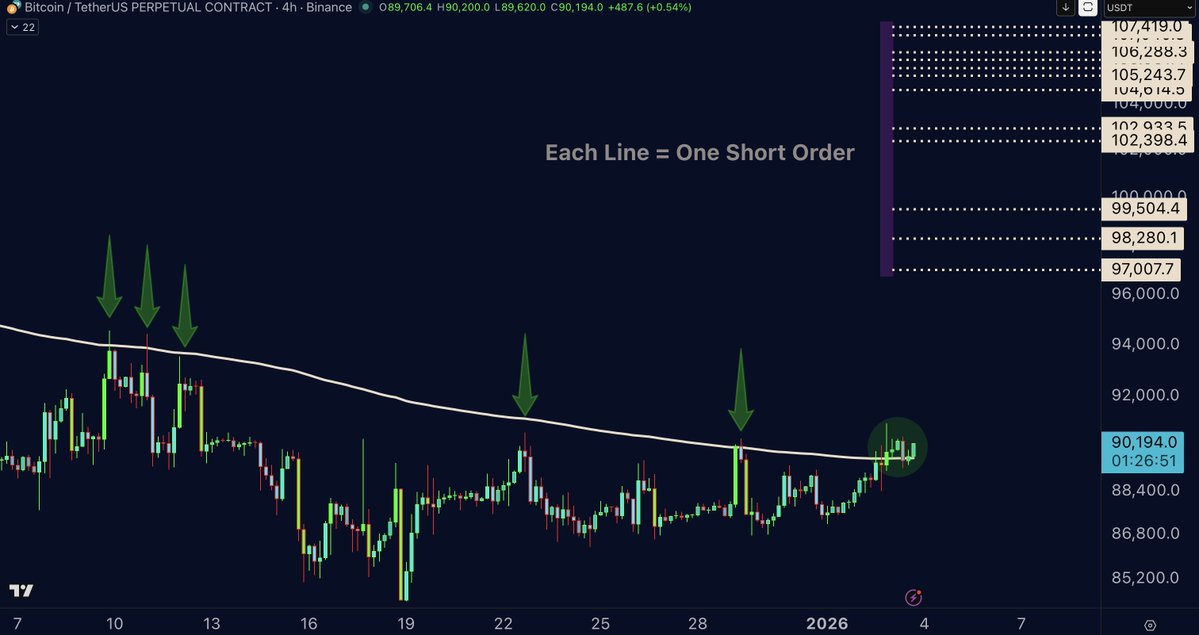
This is an early Sunday report, published on Saturday due to the current market movement and a very important development. For the first time in a month, BTC is breaking out above the Silver Line, which was rejected in the last five attempts, now with a clear retest and bullish confirmation. What does this mean? It means that Bitcoin has managed to defeat the bears at this short-term resistance, giving a clear signal that it is ready to move further. This is what I have been waiting for over the past two months. After hitting my target of 80k, I clearly stated that targets of 97–107k were not off the table before continuing the downside move, and that I was buying spot at 85k, looking to sell between 97–107k. Now it looks like the market wants to make this move. For this reason, I am placing several short orders between 97–107k, where each line represents one short order. For example, if my trading capital is 10k, I divide it into 12 parts and place each order with its respective size. This is how I always trade to catch the absolute best average price for shorts.
At the same time, I keep the shorts from 115–125k fully open, as the placed short orders are important preparations in case the market allows us to visit these levels. Remember that I remain fully bearish on this market and am targeting levels below 70k in the coming months.
Something that supports my bearish narrative is the fact that on New Year’s Day, the FED lent $106bn in overnight repo operations to banks. The question is: why? Why such a large amount? The more important answer is that the FED changed the lending rules in September 2025, on the same day as the FOMC press release, likely to avoid too much attention on the new rule. Back then, the standing repo had a daily limit of $500bn to be lent, meaning it would be returned within a day or two to the FED. Now its a total cap for all banks combined, up to $240bn per single bank, which is a major red flag that screams one thing very clearly: the system is under far more stress than most people are willing to admit. In simple terms, the Fed is preparing for situations where multiple large institutions may need massive liquidity at the same time, and they are making sure there is no chaos when that moment arrives. And history showed us, the moment when Banks been in pressure, needed help or been sitting at extreme low liquidity, the markets didnt like it at all and we saw a bear market. This is the current scenario. This is exactly what I predicted in August when I turned bearish, calling it by name: a repo and liquidity crisis. Now, on New Year’s Day, we saw the largest amount ever lent: $106 BILLION US DOLLARS! AGAIN $106bn!!!! That is something that should have shaken the markets, yet the markets did not seem to react.
At the same time, insiders continue to sell at maximum speed. I have been able to predict these events very accurately, and I am more than confident that a 2008-style crash will repeat in the near future. The entire market is putting pressure on banks, while silver is liquidating and applying stress to one bank after another. Is this the reason banks are borrowing more and more money to cover their short positions in silver? These are crazy times we are living in, and congratulations to everyone who trusted my words, as what I predicted and shared has once again come true. Many people ignore these fundamental signs, but the market is extremely bearish and could crash at any moment. I am bullish only on gold and silver, ultra-bearish on stocks and BTC, and opening large shorts across almost all of them. If the market allows a move into the 97–107k region, I will add a significant amount of capital to shorts. On top of that, I will realize the spot position from 85k and add those profits to the short positions as well. That is exactly what I am going to do.
Join free TG: https://t.co/zkdgaR6H3c
Join premium here: https://t.co/4ilNrRrtAu
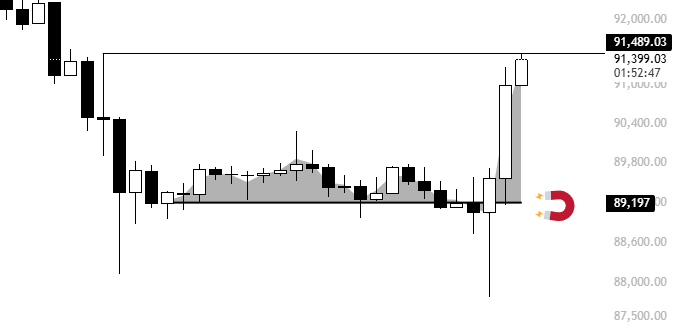
$BTC Sunday update:
Along the same lines as last Sunday, this looks like a range and it's trading like one.
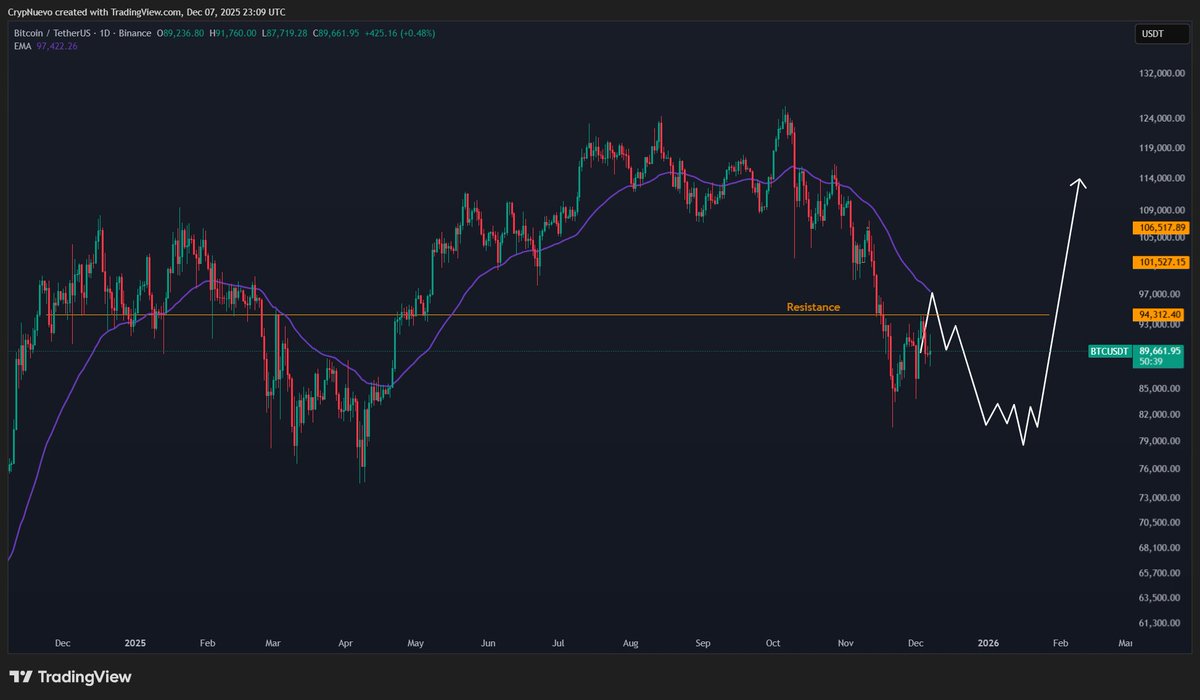
For shorts, I'm looking for a 1D50EMA retest and I'm thinking that it'll adjust around $95.5k and be the range highs.
For longs, I'm looking for a clear base.
🧵↓(1/4)
#Bitcoin – What’s Next?
The Big Sunday Report: All You Need to Know:
🚩 TA / LCA / Psychological Breakdown:
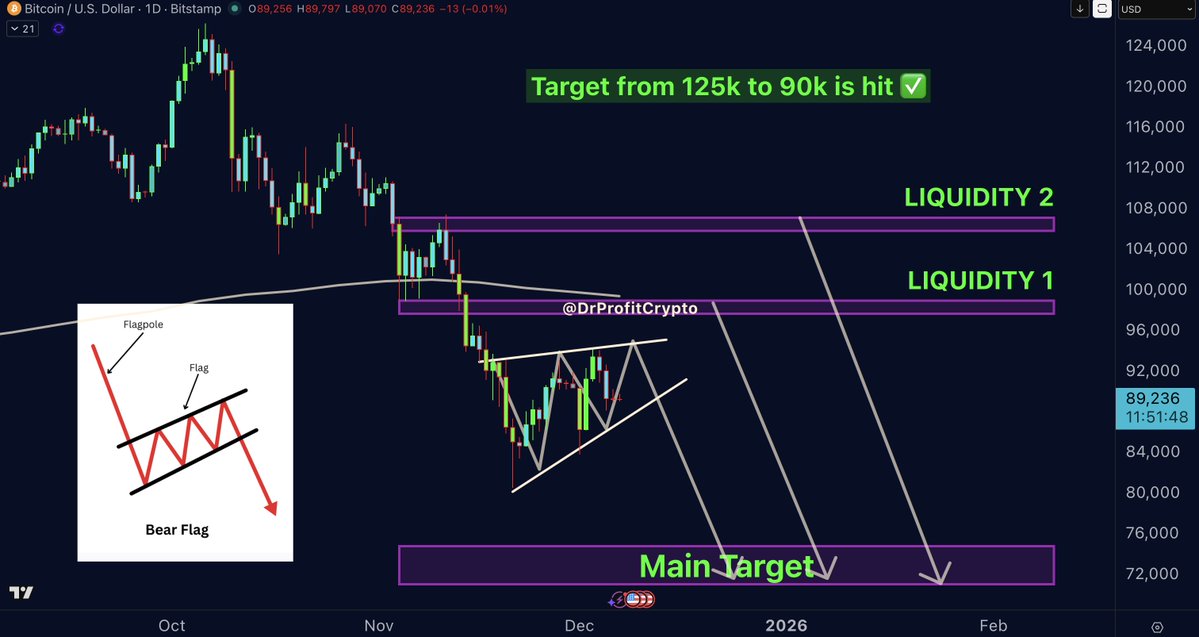
Nothing has changed since last week’s Sunday report, which is why today’s update is kept shorter than usual. Last week, we discussed the two major liquidity clusters in the 97k and 107k regions, and the importance of placing short orders there in case market makers allow price to revisit these zones for a liquidity grab. It’s also worth mentioning that the weekly EMA50 requires a retest, and this aligns perfectly with the first liquidity pool around 99–100k. If we see such a spike in price, it will require significant volatility, something that can easily occur during the FOMC statement on December 10th, just three days from now.
At the moment, the market is giving us three possible scenarios, some with higher probability and some with lower. Trading is a game of probabilities, and if we agree that BTC is in a bear market, then we also agree that new lows will be made from time to time. Does this happen without any bounces or relief pumps? Absolutely not, even during the worst crashes, the market never moves straight down without at least some relief. Our next task is to identify the areas where market makers are most likely to send price before visiting the lower target around the 70k region.
The first probability is that market makers simply play out the current bear flag and send BTC directly to the 70k target. I see this as likely but not as likely as the second scenario, which involves grabbing the liquidity around 97k and simultaneously allowing BTC to retest the weekly EMA50, the most important bull–bear indicator. The perfect trap would be a move above the weekly EMA50. That would create strong bullish sentiment, pushing BTC from 100k toward 107k to grab the next major liquidity pool. This would then allow market makers to build an even larger liquidation cluster on the downside, making it beneficial for them to push prices below 83k and make the ��big short” profitable again.
Some may ask: “Why don’t you close your shorts from 115–125k, go long, and then re-short at 97–100k or 107k?” The answer is simple: the market trades in probabilities. In my view, my entries will not be touched for at least the next year. No matter what happens, those shorts will remain deep in profit because the entries were perfect. The probability of hitting the 70k region is extremely high in my opinion the only question is how high the fake pump will go before the next leg down. Will it be down from the current bear flag structure, 97-100k and down? Or will we see a stronger move max till 107k region and continue the downside move? These questions lead to one answer and its that 70k is coming after one of the above mentioned events.
I’m more than happy to keep my 115–125k shorts open and will simply add more between 100–107k if the market gives us the opportunity described above. Overall, the fundamentals are extremely bearish. The confirmed death cross was the biggest red flag the final confirmation many needed. But of course, sentiment shifts with emotions. People will bet their lives on a golden cross but ignore the death cross entirely, simply because their emotions prevent them from facing reality.
As per Calendar we have FOMC on 10th of December on Wednesday, 86% of market expects a rate cut 0.25 while 14% expects no rate cut at all. In the event of rate cut its already priced in, but in the event of no rate cut the markets will answer with strong selling and we will see the continued bear going on.
Join DrProfit Premium membership for market analysis and trading: https://t.co/M5dJf5Ecmq
Join free TG channel: https://t.co/zkdgaR6H3c
$BTC $ETH
As I often say, a bottom does not form in the same way as a top: they are two completely opposite processes in terms of price behaviour and, above all, volume interpretation.
A top occurs when there is still apparent strength, breakouts, enthusiasm and incoming liquidity, allowing the biggest players to distribute 'at the top'. In these phases, the OBV often remains positive or stable, precisely because distribution occurs while the public is buying strongly.
A bottom, on the other hand, is the opposite: it is not a sudden explosion, but a slow process of absorption, consolidation and progressive loss of selling pressure. This is why OBV is fundamental: it shows you whether sales are still draining liquidity or whether, on the contrary, the flow is beginning to reverse silently.
To date, OBV continues to show outgoing pressure, with no signs of reversal. This is why I continue to say that we do not yet have real confirmation of a bottom, even though we are in an interesting technical area.
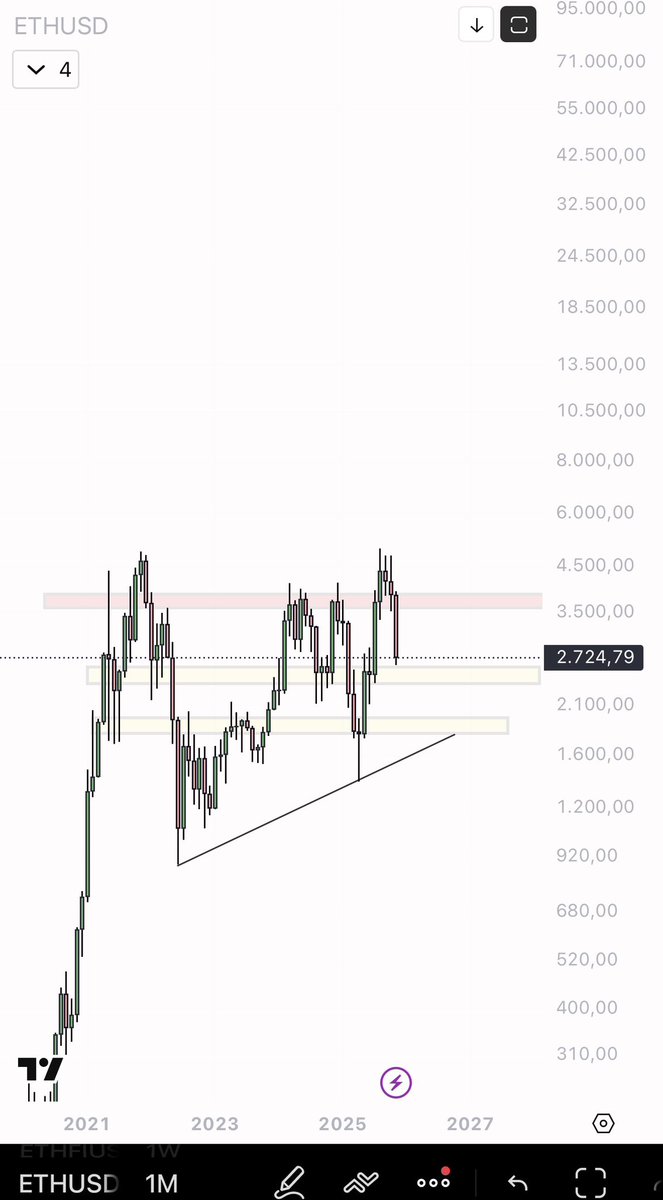
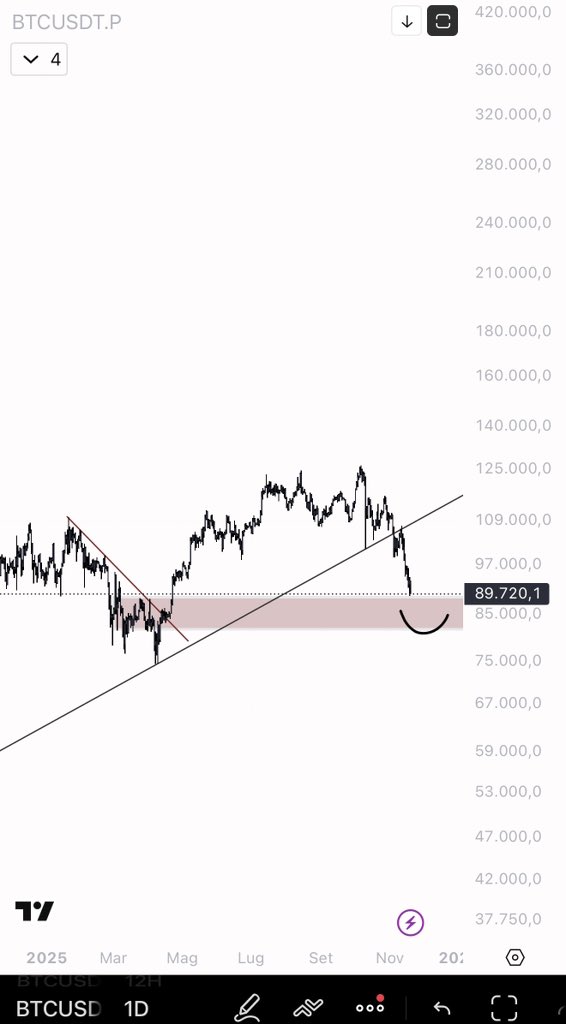
Three key levels are clearly visible on the chart:
The upper red zone: a recovery in this area would restore structural strength and pave the way for new highs, but at the moment it is distant and not supported by volume.
The current area (limbo zone): here the price is seeking stability, but without a reversal in volume it remains only a technical rebound.
The lower support: the level where it would make most sense to build a real base, especially if accompanied by progressive accumulation on the OBV.
In summary, as long as the OBV does not stop discharging and does not build an accumulation structure, we are talking about a simple pullback, not a bottom.
And I would like to add something that I have been repeating for days: in dump phases, I find it more sensible to accumulate ETH than BTC. The structural context, especially on pairs, leaves much more relative room for ETH than for BTC, which is still trapped in a zone of macro indecision.
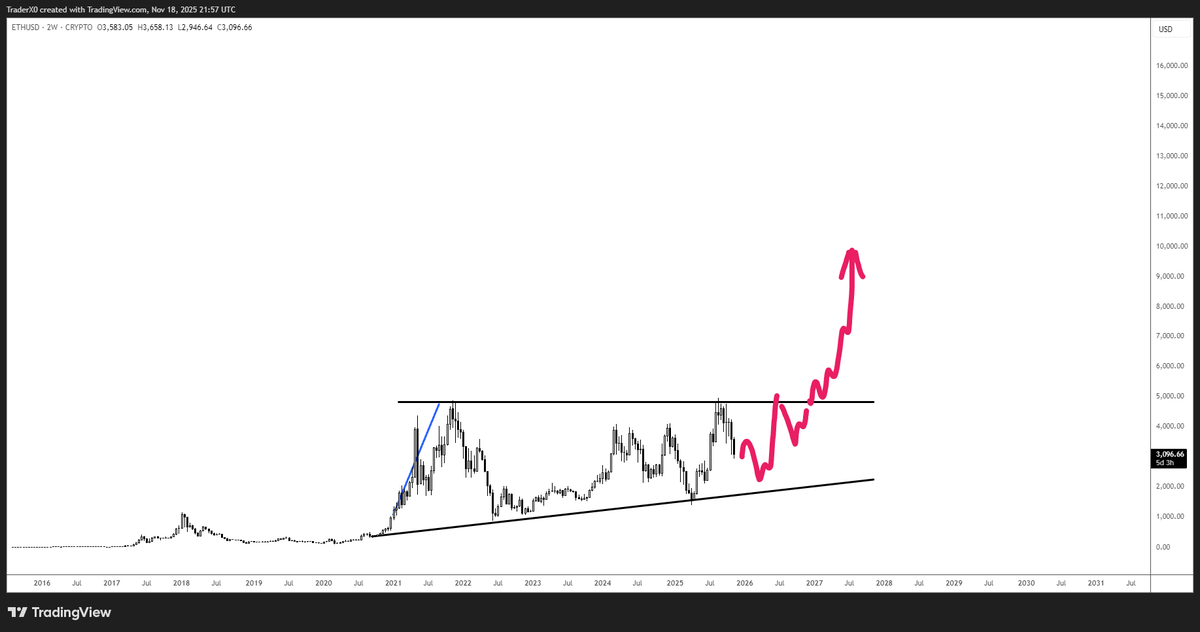
For macro chart ETH usdt similar to BTC
If you believe the crash is over at 90k you are fully mistaken. At 125k I have called the bear market and told you 90k is my first main target, what follows is a bit of sideway before the next leg down starts. Prepare for much lower! My final targets are the region of 60k
How did I realise in recent weeks that the bottom had not yet been reached?and $BTC weak ?
Simple: volume.
OBV shows you where real volume is moving, and this is what allows you to understand whether there is accumulation behind the price or just distribution disguised as a pump.
But it is not enough to just look at it: it must be read in the context of price.
The problem is that many people look at the OBV line going up or down and already feel like experts.
But that's not the point. The difference is made by micro-divergences, the phases in which the price falls and the volume remains stable, how the range absorbs, and how all this fits in with the key areas of the chart.
It's not immediate, it's not 'OBV up = buy'.
It takes an eye, experience and interpretation.
Volume often alerts you before price... but if you don't know how to read it, you'll never hear it. Looking at this chart, the price is entering an area where we have seen strong participation and volume in the past.
If the OBV starts to show signs of reversal right here — i.e. with real accumulation in the same demand zone — then we could have a credible temporary bottom.
I'm not anticipating anything: I'm waiting for confirmation from the volume, not the candlestick.
I'll update you.
$ETH remains quiet for too long, historically two things happen:
1. It accumulates liquidity deep down.
2. When it takes off, it violently outperforms the rest of the market.
And yes, current behaviour suggests that within a few weeks or 2-3 months it could become a protagonist.
No magic is needed: just look at history.
• ETH tends to move after BTC, when the market has already digested the most 'noisy' movements.
• ETH/BTC spreads are starting to show compression.
• Volatility is low, but the pattern is 'a spring ready to snap'.
• Institutional interest is there, quiet but steady.
When such a large asset remains suspended while everything around it is moving, it is not a sign of weakness:
it is accumulation in disguise.
2k 3k 1k shouldn't matter to you. I have a spot slice of ETH that remains there long term. Take it out of my trade.
Weak vs strong structure bullish
Weak vs strong structure bearish
This simple graph is worth more than a thousand lessons
Retweet this simple and best educational contents
$BTC support is in
116950 ✅
111700✅
119600❌
105158✅
Let’s see how it goes, personally think 105 - 103.9k are huge support, after this next would be around 98k
Be careful trading here and use stoploss always
$BTC - If you are prepared for something like this then if it plays out you don't have to panic. If support is breaking here it just means it needs to go lower to find a stronger support/spring to come back higher. The journey from $3k to $125k wasn't up only.