A user-friendly #WebReporting software designed for enterprises which allows you to create complex reports through simple drag and drop. #reporting#BI#bigdata
Key production metrics such as #procurement, cost, and production quality are essential for the #manufacturing industry, making #transformation process more #efficient and cost-effective.
➡ Check out for more visualization solutions on:
FineBI: https://t.co/SZ23SKe50E
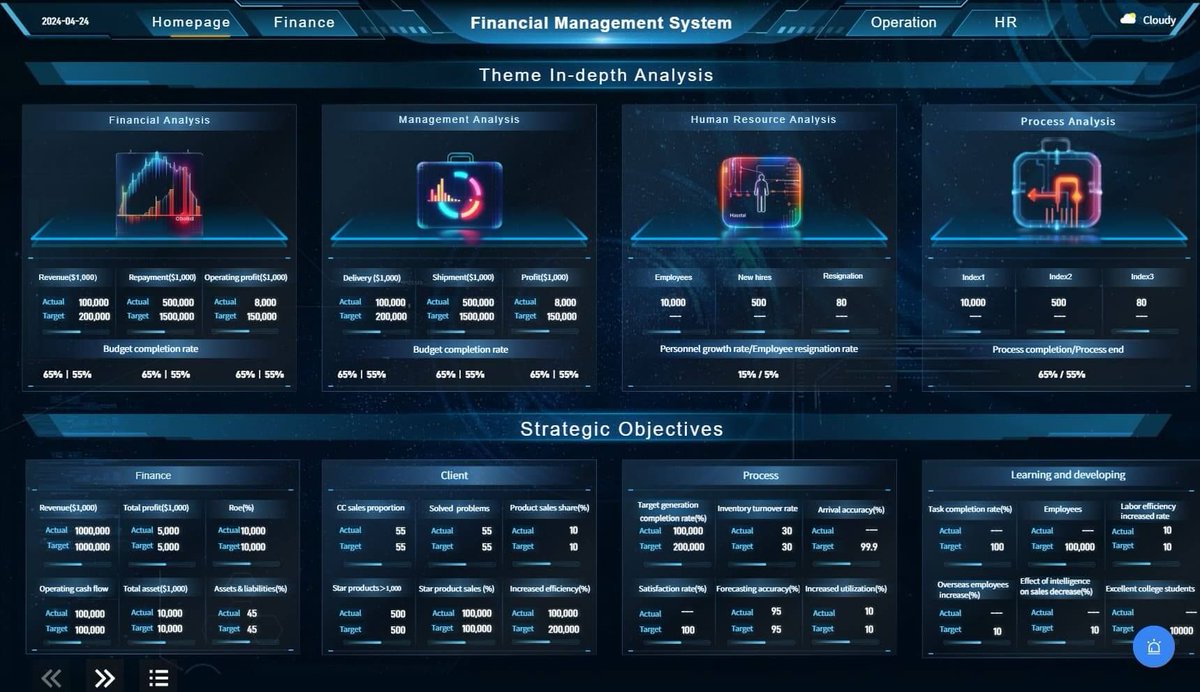
Worked for your boss all week, now it's time to get to be your own boss 💅So how does a boss manage everything? 👀
A #ceodashboard aggregates and displays key business metrics and data points critical to the overall performance of a company.
#TGIF#FineBI#FanRuan
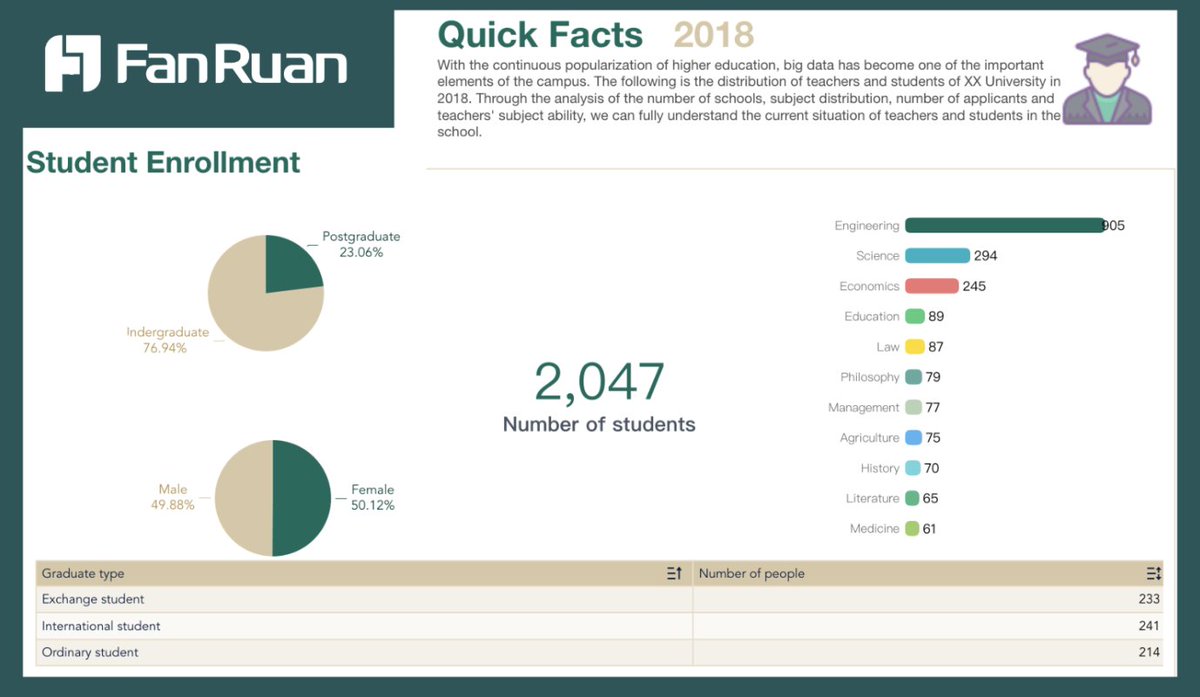
🏫#smartcampus aligns with the growing expectations of more dynamic, sustainable, and efficient educational environments.
✔️ #fanruan offers #businessintelligence tools and extensive experience in campus project implementations.
📷 Check out for more: https://t.co/agaNPW7G2l
[Workshop Details]
📍Venue: Room 6, 11/F. Righteous Centre, 585 Nathan Road, Mongkok, Kowloon
📅 Date: 2pm to 6pm, 29/08/2024
📌 RSVP required: scan the QR code or click the link below⬇️
https://t.co/KM6iAo3aDX
🌻 What Is a Sales Dashboard?
A sales dashboard simplifies management by offering a strategic-level overview of team performance, sales opportunities, closed deals, and other essential KPIs.
👉 The Ultimate Guide to a Sales Dashboard: https://t.co/HvXU5cmIPT
#Dashboard#dataviz
Excited about the dynamic charts and stunning dashboard showcased in our previous posts? 🙋♂️
🏄♂️ Dive into creating yours using #FineReport today with simple drag-and-drop operations!
🔎Beginner's tutorial: https://t.co/W4MvriA2xj
⏬Try for Free: https://t.co/7ciQ2x0tO7
🦋 Check out this fantastic demo of #MapVisualization in action!
A dynamic sales performance monitoring dashboard created using #FineVis
🦋Learn more about FineVis and customize your maps to uncover valuable insights tailored to your needs!
https://t.co/6cYqoIE4c7.
🐾 🗺️ Discover the power of #MapVisualization!
In news media and data analysis, maps are game-changers, streamlining info transmission and capturing attention instantly.🌐📊
👉Explore various map types in our latest article to harness the power of maps! https://t.co/LSOwYdgdZC
📊 Unlock the Power of #DataVisualization Across Industries!
We’re thrilled to introduce our latest creation: 🍀 The Ultimate Guide to Data Visualization in Various Industries 🍀 .
👉Don't miss out on this valuable resource! Click to read the full guide: https://t.co/kMRcd4ycjB
🌟 Thank you to everyone who visited #FanRuan at MIA AFT 2024 in Malaysia! 🇲🇾
We had an amazing time showcasing our latest #BusinessIntelligence and #Analytics platforms. Excited to help businesses transform data into actionable insights!
Stay tuned for more innovations!
🚀 Check out our latest : the Investment Banking Online Supervision System Dashboard, powered by FineReport!
Get real-time insights and comprehensive oversight to streamline regulatory compliance and make informed decisions.
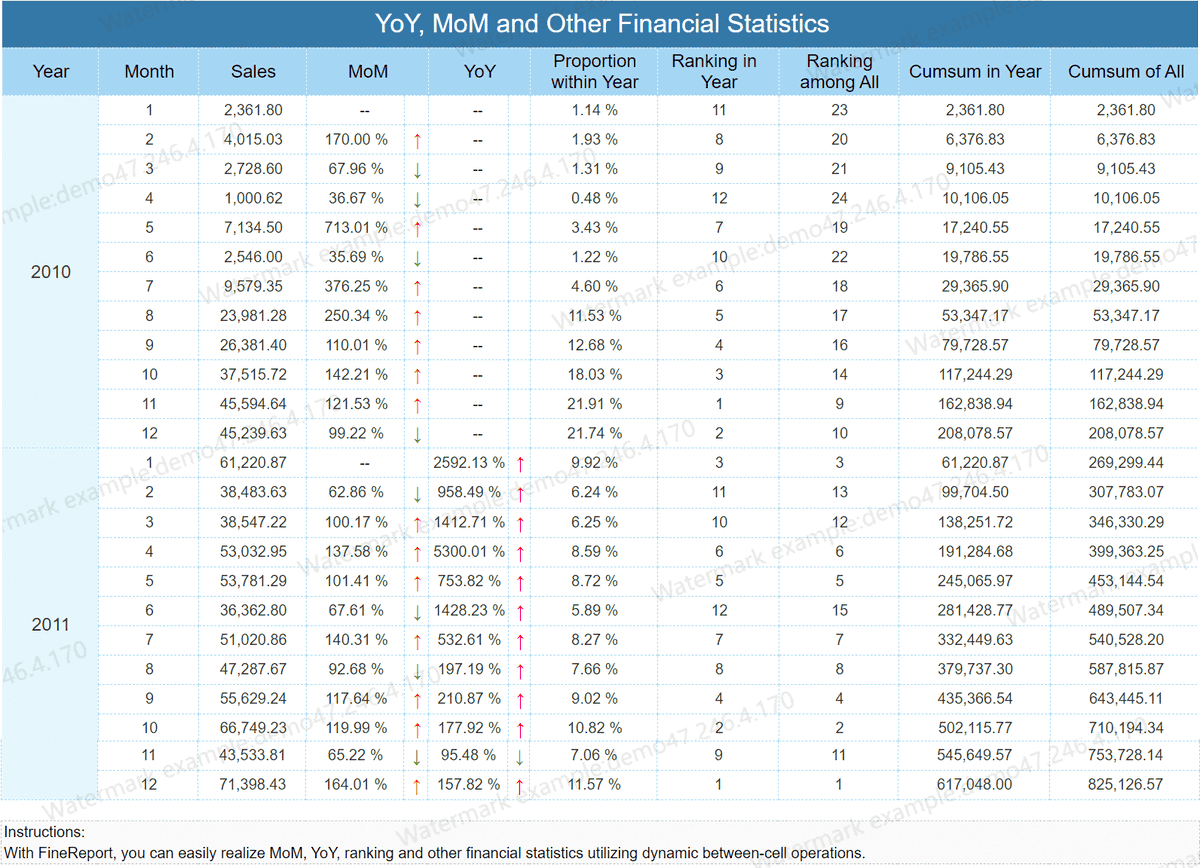
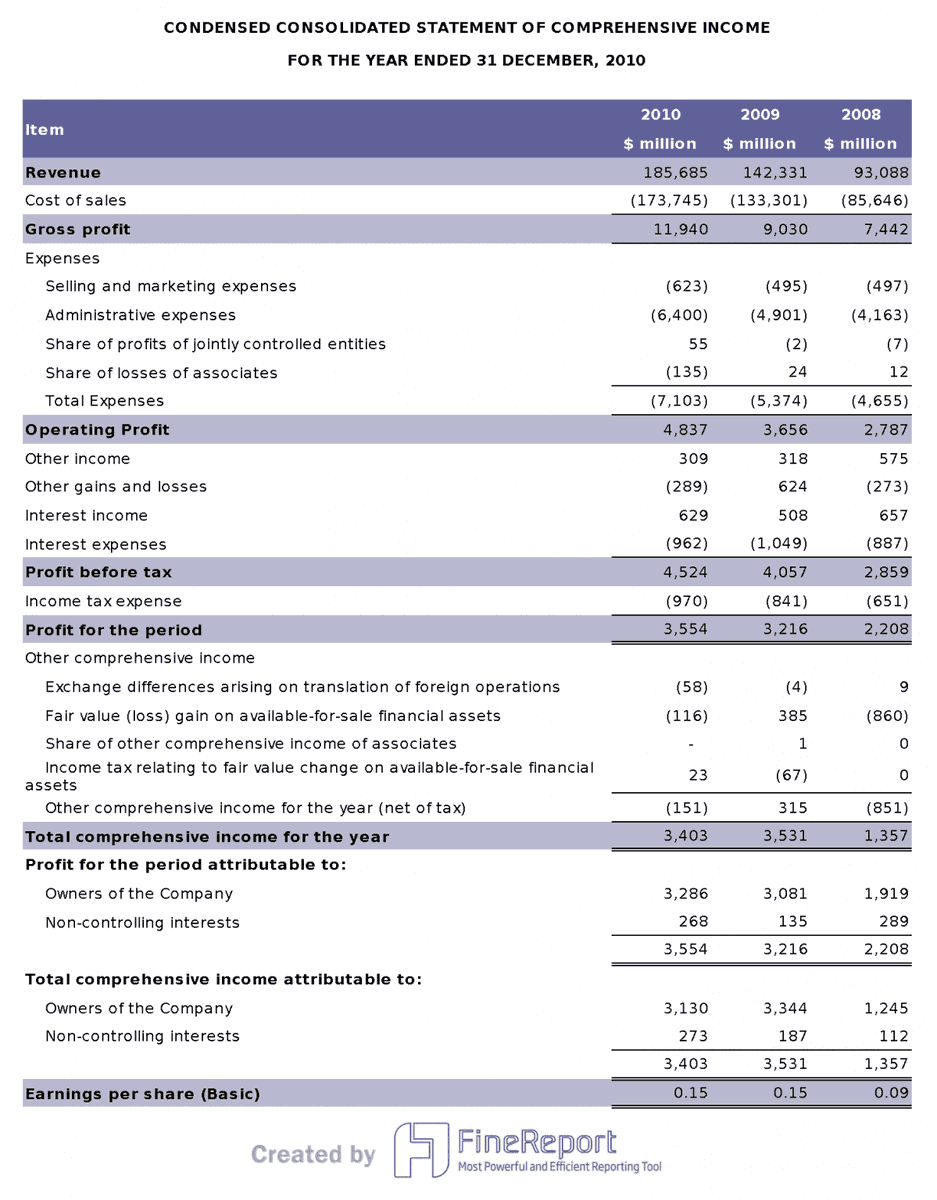
📈#FinancialStatements are vital for corporate reporting, offering a detailed insight into a company's operational health.
👉 Dive into the importance, types, and examples of financial statements in our latest blog! https://t.co/mxhIoN7hRf
🌐 Exciting news! FanRuan's new office building is ready for the world to see!
Experience it firsthand with #FineVis, our cutting-edge data visualization tool.
Reach out to us today to learn more and discover the power of FineVis.
#FanRuan#dataviz#businessintelligence
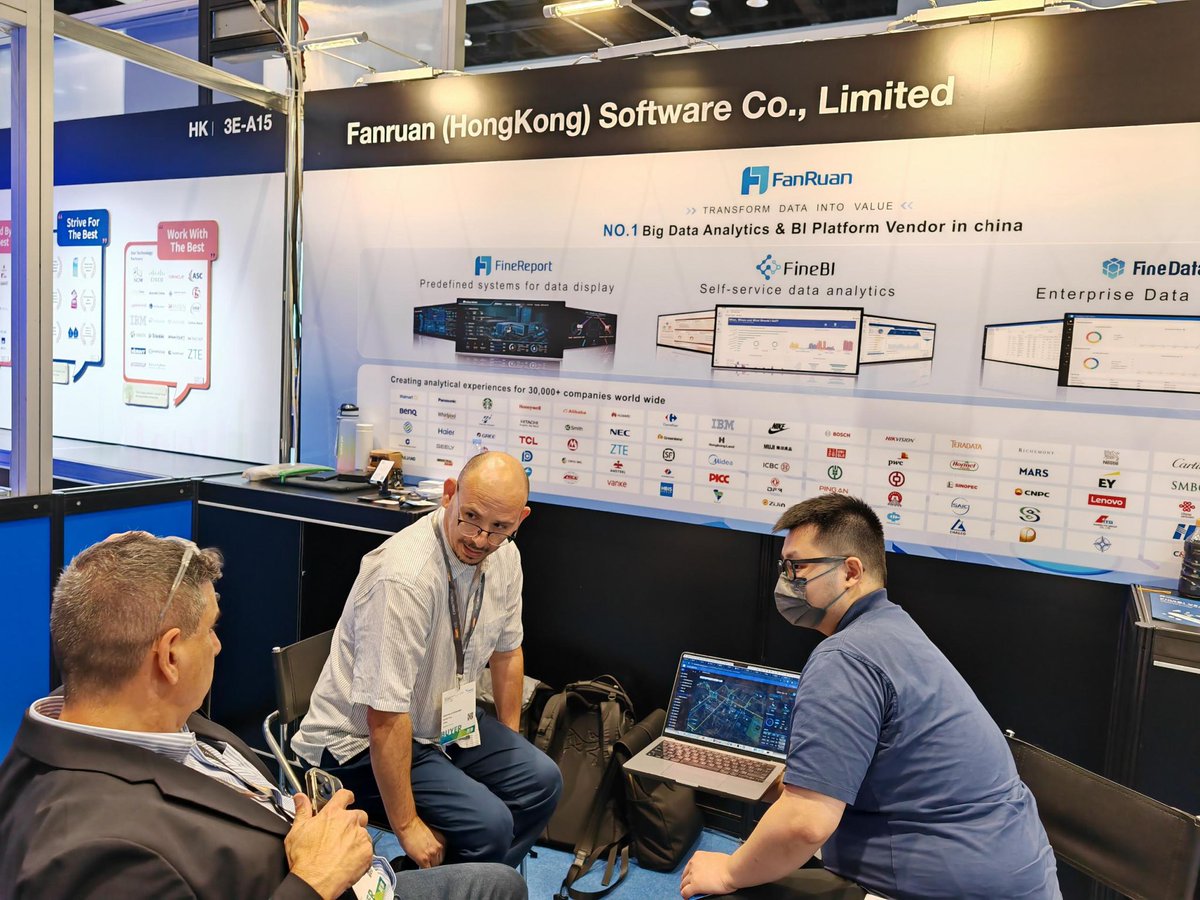
🎉 FanRuan Software successfully participated in the 2024 HONG KONG ELECTRONICS FAIR (SPRING).
During the event, we showcased our latest innovations in business intelligence and analytics platforms.
#FanRuan#BusinessIntelligence
"We’re thrilled to share that FineReport is now officially a partner of Huawei Cloud!
Get a 20% discount on FineReport enterprise version here → https://t.co/sTiiEnykGQ
Learn more about Huawei Cloud Festival and get more discount here → https://t.co/J7H4yykPIa"