CNX IT
Last week was a brief challenge for the Indian IT stocks based on the potential impact of AI on the future of majority IT companies!
The sell-off, which began on 04 February, intensified after artificial intelligence firm Anthropic unveiled a new AI tool capable of automating complex tasks, raising fears of structural disruption across the outsourcing industry.
The market is worried about how new technology provides opportunities by unlocking incremental addressable spend. Indian IT companies, which derive a substantial portion of their revenue from the U.S., remain particularly sensitive to changes in the American economic outlook.
Let's observe what is seen with the CNX IT chart and whether we can be take timely informed decisions.
➡️CNX IT hit a high of 39446.70 in January 2022
➡️We witnessed a triple bottom at 26184.45 from July 2022 to April 2023
➡️CNX IT crossed 39446.70 after a year in July 2024
➡️This gave a decisive upside to 46088.90 in December 2024
➡️Next came the sell-off which led to a double bottom scenario at 31320.15
➡️The pullback to 39446.70 happened thrice in June 2025, December 2025 & February 2025
➡️Last week's sell-off has given a retest of 31320.15 which is also a visible neckline for the Head & Shoulder pattern observed
➡️A breakdown below this critical neckline will give way for 26184.45 & 23926 in the short to medium term
➡️Full target potential is much below which won't be feasible to talk as of now. We need to observe the situation and let things unfold step by step
➡️Any reversals should be taken as opportunities to exit positions, and potential longs at the IT Index level can be taken into consideration only above 38560-39450 zone!
Can AI disrupt or give an opportunity for Indian IT stocks?
SJS Enterprises
Market Cap: 7061 cr
This stock has been steadily climbing for over two years. Every time it paused, it used that pause as a springboard for the next leg up.
Q4 & FY26 Performance Snapshot (Consolidated) — record quarter, margin expansion
Q4FY26 revenue: INR 2,601.2m (+29.7% YoY); management called this the “highest ever quarterly revenue”.
Q4FY26 EBITDA: INR 807.6m (+53% YoY) with EBITDA margin 30.3% (expansion of 424 bps) driven by “a richer product mix, higher export contribution and operational efficiencies.”
Q4FY26 PAT: INR 488.7m (+44.9% YoY); PAT margin 18.8% (record “highest ever quarterly PAT”).
FY26 revenue: INR 9,550.7m (+25.6% YoY); EBITDA INR 2,879.6m (+41.7%); PAT INR 1,718m (+44.6%).
Capital efficiency: FY26 ROE 19.5% (+226 bps YoY); ROCE 35.5% (vs 25.3%, +1,014 bps)—CFO termed these “best-in-class numbers for our space.”
The trend quality here is high.
The price consistently makes higher highs and higher lows across the entire chart — the most fundamental sign of a healthy uptrend.
The two moving averages visible are stacked in bullish order — short-term above long-term — and price is riding above both.
The consolidation around ₹1,344 was constructive. The stock tested that level, held it, and then moved higher rather than collapsing through it
Recent price action near the highs shows relatively tight candles — not wild swings. This tells you that whoever owns this stock isn't rushing to sell.
Low but steady volume during an uptrend often means the stock is in strong hands. Nobody is dumping it. Institutions are accumulating quietly, which is actually a positive sign for the trend's durability.
The sustained outperformance (the RS line at the bottom of the chart is in a strong uptrend and currently at a 52-week RS high) suggests S.J.S. is a sector leader, not just a market participant
A stock printing new RS high while also at 52-week price highs is the definition of institutional sponsorship
Investors should keep holding SJS Enterprises with a good outlook for FY27.
El Niño development is firing on all cylinders.
Sea temperatures in the central equatorial Pacific have now broken records for five days in a row. Tough times ahead🚨
INOX India
Market Cap: 12,818 cr
Global leader in cryogenic technology
30+ years of expertise
Operates in 100+ countries
Designs, manufactures & installs cryogenic equipment
Core use: Storage & transport of ultra-low temperature gases
🧩 CORE BUSINESS SEGMENTS
1️⃣ Industrial Gases (Largest Segment ~50–60%)
What they do:
Liquid oxygen, nitrogen, argon storage & distribution systems
Cryogenic tanks, cylinders, vaporizers
Customers:
Steel, healthcare, chemicals, manufacturing
👉 Nature: Stable, recurring demand
2️⃣ LNG (Fastest Growing Segment)
What they do:
LNG storage tanks
LNG transport trailers
Mini LNG terminals & regasification systems
Use cases:
Trucking fuel 🚛
Marine fuel 🚢
Remote power generation ⚡
👉 Key theme: Energy transition from diesel → cleaner LNG
3️⃣Cryo Scientific Division
What they do:
Advanced cryogenic systems for:
Space programs 🚀
Fusion energy ⚛️
Scientific research
Key projects:
ITER (global fusion project)
Space & semiconductor applications
👉 Nature: High-tech, high-margin niche
⚙️ WHAT IS CRYOGENICS? (CORE COMPETENCY)
Cryogenics = handling gases below -150°C
INOX enables:
Storage
Transportation
Industrial usage
👉 Critical for:
LNG
Hydrogen
Oxygen / Nitrogen
Space & fusion energy
Energy Value Chain Role:
Production → Storage → Transport → Distribution
↑
INOX INDIA
💰 Financial Snapshot (FY25)
Revenue: ~₹1,350 Cr
EBITDA Margin: ~24%
PAT Margin: ~16–17%
ROCE: ~34%
👉 High margin engineering business
Inox India supports the semiconductor industry by manufacturing and supplying the highly specialized equipment required to store, transport, and distribute ultra-high purity industrial gases like nitrogen, argon, helium, and oxygen. These gases are critical for advanced semiconductor manufacturing processes, including silicon layer deposition, etching, wafer cooling, and continuous equipment purging.
Specialized Clean Pipeline Infrastructure: Because India's tropical climate brings high levels of dust, domestic semiconductor plants require immense cleaning protocols. Inox caters to this by providing highly polished, entirely dust-free pipelines necessary for gas distribution, such as a 50-kilometer pipeline project for Tata in Dholera.
Inox India supplies its cryogenic and pipeline solutions to several major companies and projects within the semiconductor industry. Their current clients include:
Micron, with equipment supplied to their facilities in the USA and Dholera, India.
Foxconn, specifically for their facility located in Bangalore.
Tata, supporting their semiconductor plant in Assam as well as a major 50-kilometer pipeline project in Dholera.
The Air Liquide / Dresden project located in Europe
Technical Outlook
The stock has given a breakout from its base formation of one year- 1223 to 1058.40 range.
Previous high of 1504.40 hit in July 2024 should get retested and crossed if stock stays above the recent base formation high of 1223 for couple of days.
Summary
INOX enables liquid gas economy
Growth Potential:
Industrial Gases: Stable
LNG: High
Hydrogen: Very High
Cyro Scientific: Optional Upside
Satin Creditcare Network Ltd
Market Cap: 2667 cr
Stock has done reasonably well recently with a +81% up move in the last two months.
Satin Creditcare Network Limited (SCNL or Satin) is a leading microfinance institution (MFI) in the country with presence in 29 states & union territory and around 95,000 villages. The company’s mission is to be one stop solution for excluded households at the bottom of the pyramid for all their financial requirements. The company also offers financial products in the Non‐MFI segment comprising loans to MSMEs and housing finance through its subsidiaries Satin Finserv Ltd. and Satin Housing Finance Ltd.
Key pointers from Q4FY26:
1) Raised ₹10,826 Crores during FY26, have healthy balance sheet liquidity of ₹2,092 Crores and undrawn sanctions of ₹2,235 Crores
2) Marginal Cost of Borrowing reduced by 43 bps YoY to 10.82%
3) Secured a ₹500 Crores sanction from a leading PSU.
4) Raised ₹155 Crores sub-debt in FY26 and ₹200 Crores in FY27 YTD
5) Geographical Penetration: During FY26, the company opened 392 new branches
6) Asset Quality Intact: PAR 90 improved to 3.1% as of Mar’26; underscoring robust underwriting
7) 8% decline in Credit cost from FY25 (4.6%), which stood at 3.8% in FY26. Credit cost for Q4 FY26 at 2.5%
7) Top 4 states where Satin is present: Uttar Pradesh, Bihar, Assam & West Bengal
8) Q4 profitability consolidated PAT growth cited as +640% YoY, +125% QoQ. Management emphasized “There’s no one-off”; uplift attributed to reduced credit cost and the growth strategy.
9) Diversification strategy: moving from NBFC-MFI to rural financial services platform
Non-MFI now 17% of consolidated AUM; target 30% by 2030.
10) 2030 consolidated AUM target increased to ₹32,000cr (from ₹25,000cr), citing improving contribution/visibility from subsidiaries.
11) Satin Housing Finance (SHFL)
AUM ₹1,267cr, 3Y CAGR 36%
12) Satin Finserv (SFL) – MSME/secured & green finance
AUM ₹1,054cr (+92.5% YoY); 3Y CAGR 66%
Footprint: 14 states, 121 branches
Green finance: ₹255cr disbursed across 34 green loans, covering solar/renewable, EVs, enterprise EVs.
13) Satin Technologies (STL) – tech platform as a “kicker” to ROA
Strategic investment: stake in QTrino (IIT Patna incubated deep-tech cybersecurity firm) focused on post-quantum cryptography.
14) Satin Growth Alternatives (SGAL) – SEBI-licensed AIF
Received SEBI license for ₹200cr Category II AIF, described as “first of its kind gender lens impact fund focused on rural MSMEs.”
Team: all-women, combining impact + financial discipline.
15) FY27 outlook
Guidance (Standalone)
AUM growth 15–20% YoY (implying ₹14,800–₹15,100cr)
Credit cost 3.0–3.5% (vs 3.8% FY26)
On the Technical front, stock has done quite well & has key supports at 220-205-186 levels. Resistance is seen at 275-290 zone. Weekly close above this resistance zone will indicate further strength for the stock to continue its upward journey!
TD Power Systems
Market Cap: 20,513 cr
Q4FY26 transcript gave following insights:
1) Management frames the cycle as broad-based and “very buoyant” across segments, citing pull from:
“AI data centers”
“grid stabilization”
“basic power generation”
“push towards renewables” driving geothermal, hydro, waste-to-energy
A notable operational signal: the bottleneck is execution, not demand—“the focus right now is on execution.”
2) Gas turbine / gas engine generators (key growth engine)
Management calls growth “massive” and “continues to roll on without pause.”
Order profile shifting to large volume orders; strength expected beyond FY27: “forecast for next year continue to show strong upward growth… also for… FY ’28.”
Customer capacity expansion is the constraint and driver: turbine/engine OEMs “planning to double capacity by 2030 (some more, some less).”
Execution discipline is intense: customers “monitoring on twice a week basis our deliveries,” and “even like a 3-day delay, 4-day delay is being severely questioned.”
3) Strategic shift: scaling into “large generators”
Management is “putting a lot of focus on the large generator business” and preparing a capacity expansion program.
Historical context: TDPS built large generator capability in 2012–13 with stator line fully set up, but limited rotor investments due to a market downturn; now they must “make up that gap.”
Target capability: rotor manufacturing and large machining (for rotors) “maybe all the way up to 200-megawatt size.”
4) Capacity, capex, and revenue guidance (quantified)
Base capex (excluding large generator program):“~INR 50 crores” in FY27 and “approximately the same amount next year also” for debottlenecking + automation.
Revenue capacity ceiling with current facilities + these debottlenecking capex:“we can go up to about INR 30bn to INR 32bn… covering… sales for up to FY ’28.”
5) FY27 revenue guidance revised upward: “INR 2,400-plus crores” (INR 24bn+), with “extremely high probability to increase our guidance further” given Q4 order inflow trajectory.
6) Order book execution and growth: Backlog largely executes within FY27; for FY28 order inflow, management suggests “conservatively… grow 20% to 25% even next year” (i.e., FY28 over FY27).
Business Outlook
TDPS continues to see very strong demand across all verticals of the generator business .
Order booking continues to be very strong with the pipeline extremely buoyant.
The current rate of order inflow for the past two quarters has exceeded Rs. 600 crores and approaching an average of ~Rs 650 crores per quarter.
The stock is strongly poised near its all-time high of 1379.60 and has a possibility of giving an up move as per the attached chart.
Anant Raj Ltd
Market Cap: 21,227 cr
Today the company announced that ARL to invest approximately Rs. 25,000 Crore, for development of Data Center and Cloud Services in the state of Haryana.
Additional key pointers from Q4FY26 Presentation:
1) Anant Raj Cloud Pvt Ltd. has expanded the Data Centers and Cloud business, with 21 MW IT load capacity operational at Manesar and 7 MW at Panchkula, targeting 357 MW total IT load capacity by FY 2032. The Company continues to expand its Cloud services and Data Center capacity.
2) Signed an MOU with the Government of Andhra Pradesh for setting up additional data center capacity of 5O MW IT Load, strengthening the company's footprint in South of India. With this plan, the total planned Data Center capacity will reach to 357 MW IT Load, mix of Colocation and Cloud Services, out of which 117 MW IT Load will commence by FY 2028.
3) Strategic partnership with Spain-based AI solution provider i.e. Submer to develop operational, AI-ready, liquid-cooled data centers across India, enabling rapid deployment of high-density, energy-efficient platforms for sovereign and enterprise AI workloads at scale.
Recently, stock had hit a high of 946.75 in January 2025 and came down till 375 in April 2025 & 403 in March 2026.
Since then, there is an Inverse Head & Shoulder pattern visible in the chart which can be observed in the attached chart. If stock manages to sustain above the neckline, then we can see further upside.
Key support zone is 540-485.
@myBESTElectric No power in F/N Ward of Mumbai since 5:00 pm.
Gradually, the electricity power cut has extended to more areas since 08 hours now!
When can we expect electricity to resume?
Jain Resource Recycling Ltd
593 to 378 in 08 sessions!
Q4FY26 numbers were released yesterday and stock is down -35% in 02 days!
What is the exact reason for this fall after good numbers?
CNX IT
Last week was a brief challenge for the Indian IT stocks based on the potential impact of AI on the future of majority IT companies!
The sell-off, which began on 04 February, intensified after artificial intelligence firm Anthropic unveiled a new AI tool capable of automating complex tasks, raising fears of structural disruption across the outsourcing industry.
The market is worried about how new technology provides opportunities by unlocking incremental addressable spend. Indian IT companies, which derive a substantial portion of their revenue from the U.S., remain particularly sensitive to changes in the American economic outlook.
Let's observe what is seen with the CNX IT chart and whether we can be take timely informed decisions.
➡️CNX IT hit a high of 39446.70 in January 2022
➡️We witnessed a triple bottom at 26184.45 from July 2022 to April 2023
➡️CNX IT crossed 39446.70 after a year in July 2024
➡️This gave a decisive upside to 46088.90 in December 2024
➡️Next came the sell-off which led to a double bottom scenario at 31320.15
➡️The pullback to 39446.70 happened thrice in June 2025, December 2025 & February 2025
➡️Last week's sell-off has given a retest of 31320.15 which is also a visible neckline for the Head & Shoulder pattern observed
➡️A breakdown below this critical neckline will give way for 26184.45 & 23926 in the short to medium term
➡️Full target potential is much below which won't be feasible to talk as of now. We need to observe the situation and let things unfold step by step
➡️Any reversals should be taken as opportunities to exit positions, and potential longs at the IT Index level can be taken into consideration only above 38560-39450 zone!
Can AI disrupt or give an opportunity for Indian IT stocks?
Nitta Gelatin
Market Cap: 1105 cr
13/04/2026: 803.30
07/05/2026: 1228.50
53% upmove in less than a month!
Q4FY26 numbers came good
Sales at 162 cr
Operating Profit at 45 cr
OPM at 25%
PAT at 34 cr
EPS at 37.54
Nitta Gelatin India Ltd (NGIL) is a prominent Indo-Japanese joint venture (established 1975) between Kerala State Industrial Development Corporation (KSIDC) and Nitta Gelatin Inc., Japan, specializing in manufacturing gelatin, ossein, and collagen peptides. Based in Kochi, it is a key supplier to pharmaceutical and food industries, with over 60% exports to 35+ countries.
The Q4 outperformance was driven by a combination of demand resilience in pharma/nutraceuticals, a deliberate shift to value-added products, tight cost control leading to margin expansion, and strengthening in both domestic and export markets — pointing to a business that is improving structurally rather than just cyclically.
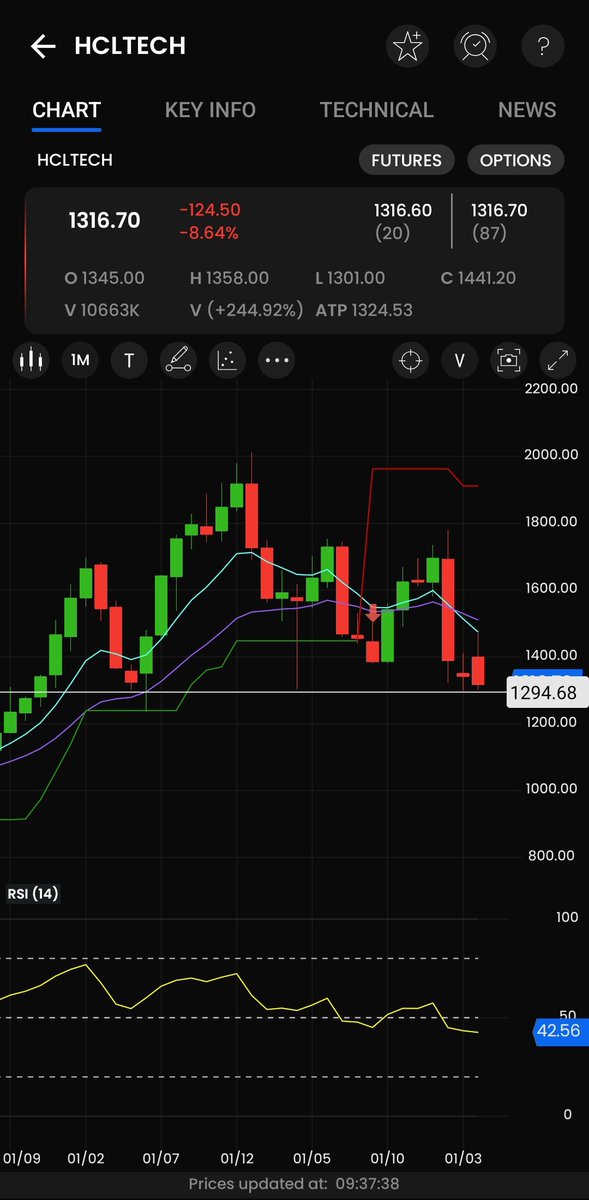
HCL Tech
Market Cap: 3,56,000 cr
Reports weak Q4FY26
Misses FY26 guidance and gives weak guidance for FY27
Operating Margin at 16.5% Misses estimate of 17.6%
Attached is the Monthly chart. Possible Head & Shoulder pattern seen. Breakdown below the neckline to be checked!
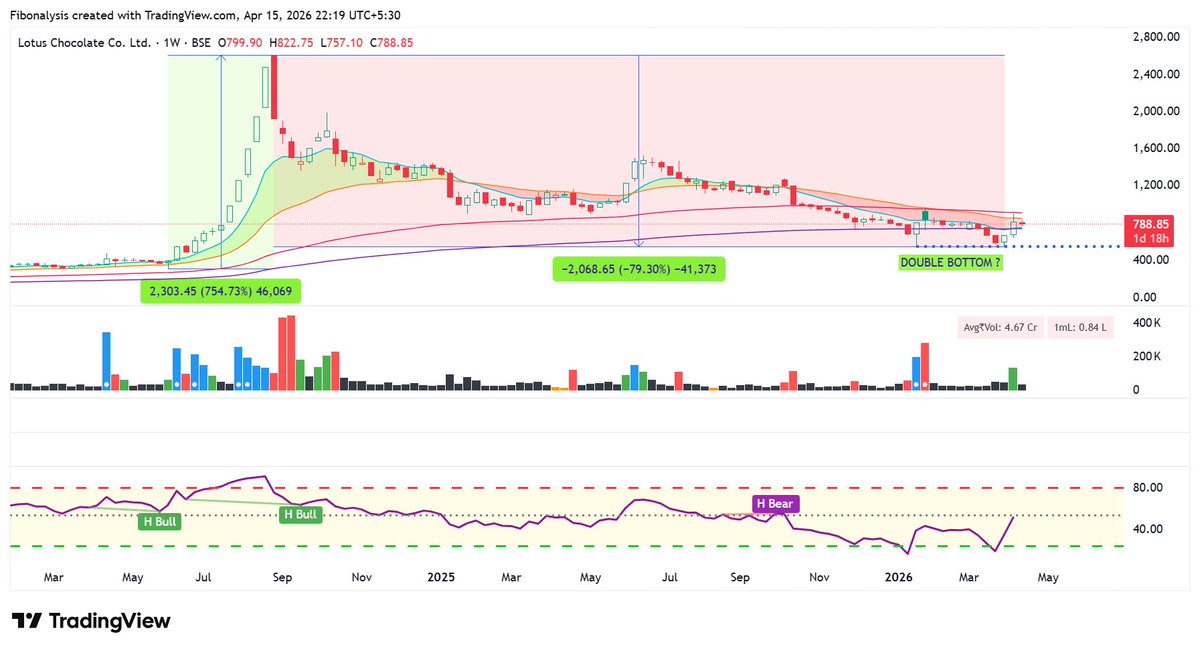
Lotus Chocolate Company Ltd
Market Cap: 1013 cr
Seems like the street doesn't like its chocolates!
Q4FY26 numbers are out and it has posted a loss.
Sales: declining / volatile
EBITDA: turned negative
PAT: sharply negative
EPS: collapsing
It’s a structural transition phase since Q3FY25!
Q3 FY25 → Q4 FY25
PAT already fell 29% QoQ in Q3FY25
Then Q4FY25 PAT dropped ~65% YoY despite strong revenue growth
👉 Early signal: Revenue growth ≠ profitability
Q2 FY26
PAT down 72% YoY
Expenses +34% YoY
Finance cost +225% YoY
👉 Signal: Cost structure started breaking
Q3 FY26
PAT down ~96% YoY
PBT down ~86% YoY
Expenses rising despite revenue growth
👉 Signal: Margins fully collapsed
Probable Reasons:
1) Business Model Shift (MOST IMPORTANT)
Company is transitioning from B2B cocoa supplier → B2C FMCG brand
Driven by Reliance Consumer Products (RCPL) takeover.
Impact:
B2B = low margin but stable
B2C = high margin but
requires: branding
distribution
marketing
working capital
👉 Short-term result: margin destruction
2) 🏭 Heavy Capex + Modernization
Company is upgrading plants & machinery for next phase
Impact:
Higher depreciation
Idle capacity during transition
Lower operating leverage
👉 EBITDA compression → visible in Q4FY26
3) 💸 Sharp Cost Inflation (Big Trigger)
Across FY25–FY26:
Employee cost ↑ sharply (up to +82–94% YoY)
Finance cost ↑ massively (~100–225% YoY)
Total expenses consistently rising
4) 📦 Inventory + Supply Chain Reset
Cocoa-based business → highly commodity-cycle driven
During transition: Legacy inventory mismatches
procurement vs demand misalignment
👉 Leads to:
Gross margin volatility
Write-offs / inefficiencies
🧩 Final Diagnosis (Simple Framework)
The decline is due to 3 overlapping forces:
🔴 A. Structural Transition
B2B �� B2C shift
Reliance-led transformation
🔴 B. Cost Explosion
Employee + finance + expansion
Margin compression
🔴 C. Execution Phase Losses
Capex
inefficiencies
scale-up costs
Technical Outlook:
The stock gave a crazy up move of +754% from 305 to 2608 in a span of almost 12 weeks!
And as the Quarterly numbers started its structural transition, the stock fizzled out and hit 540 recently. Down -79% from the high of 2608!
We will need to see whether the double bottom scenario at 540-545 seen in the chart holds its ground till there is a structural positive change in gross margins, EBITDA or revenue mix!