Market last week in 5 numbers:
+1.49% – S&P 500 weekly move: the index extended its winning streak to nine consecutive weeks and closed at another record.
+2.95% – Nasdaq weekly move (closed >30,000 for the first time ever!): tech led again, supported by AI infrastructure names and month-end momentum.
+33% – $DELL one-day move: shares jumped after a strong AI-driven quarter and evidence that enterprise hardware demand is accelerating.
3.8% – US headline PCE inflation: April’s print was the highest since May 2023 and kept inflation concerns alive.
1.6% – US Q1 GDP growth second estimate: growth was revised down from 2.0%, adding to stagflation concerns.
If you own anything in AI silicon, Wednesday matters.
$AVGO prints a $10.7bn AI-chip guide (+140% YoY) two weeks after $NVDA.
Our full preview, plus 6 more names 👇 https://t.co/13U5uFfWWD
By year-end, we might all be trading through agents.
📍 AI can execute
📍 AI can summarise
📍 AI can screen
But can it demonstrate investment judgment?
$HOOD opened its platform today: https://t.co/d1zWSb9cEw
Earnings to watch this week:
- $DELL and $SNOW test whether NVIDIA's print translates into wider corporate AI demand
- $PDD and $LI Auto on China consumer and EV price war
- $COST the cleanest US consumer read
Full breakdown: https://t.co/Qcmy0DUqme
Market last week in 5 numbers:
+85% – $NVDA (Nvidia) quarterly revenue growth: sales reached USD81.6 billion, underscoring how strong the AI infrastructure cycle remains.
+36.5% – $NVDA earnings beat versus analyst forecasts: net income came in well above expectations, reinforcing confidence in AI-related demand.
4.56% – US 10-year Treasury yield late in the week: yields eased from earlier highs but stayed elevated enough to keep pressure on valuation multiples.
$103.77 – Brent crude on Friday: oil stayed high as geopolitical concerns continued to keep inflation risk alive.
$1.3425 – GBP/USD late Friday: sterling stabilised as softer UK inflation helped ease near-term concerns over domestic inflation persistence.
Quote of the week: "The miracle of compounding returns is overwhelmed by the tyranny of compounding costs." - John Bogle
Case in point: what £50,000 could look like over 30 years under 4 fee scenarios and assuming a yearly return of 5.5% (source: Vanguard)
$NVDA reports Wednesday after close.
One print for the AI capex cycle.
Five for the call: Blackwell ramp, sovereign AI, China exposure, gross margin, 2027 demand visibility.
Full earnings map: https://t.co/13U5uFfWWD
$CBRS closes day one at $311.07, up 68%
📍from the $185 IPO price (itself was walked up twice from the initial $115-125 range)
📍Peaked $386 intraday. Mcap ~ $85bn
Biggest IPO of 2026 so far, adding to the semiconductors rally
US April PPI: hot 🔥 +6.0% YoY
- est. +4.9%, prior +4.3%
- biggest annual since Dec 2022
Services +1.2%, most in over 4 years. May CPI tracking above 4%
-> Fed cuts look more and more remote
Stock-picking: What is your edge?
In a previous thread, we explained why data backs passive investing. But active investing can still earn its place as a targeted approach.
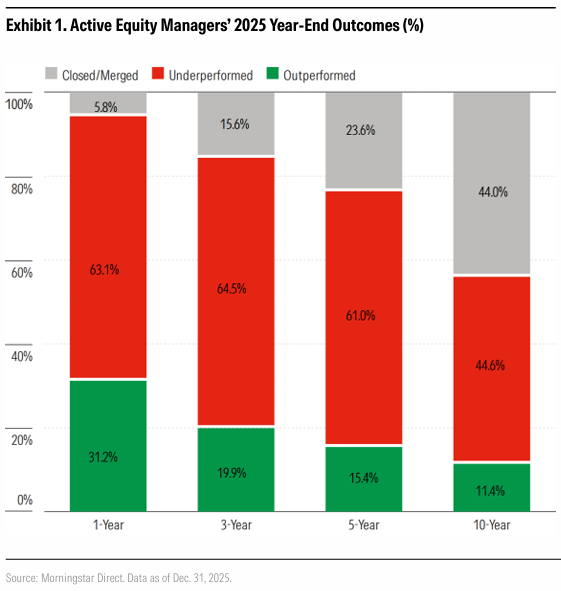
It makes sense where markets are less efficient: In sectors like biotech, small caps, or specialised credit, skilled investors may find mispriced opportunities that ETFs simply can’t capture. And the Morningstar data confirms it (see chart)
#PassiveInvesting #ActiveInvesting #PortfolioConstruction #PersonalFinance
1/3 🧵 Why chase the needle when you can own the entire haystack? 🌾
Passive investing captures market returns by tracking an index 1-to-1 at a fraction of the cost.
The structural edge? Fees: U.S. index ETFs average a 0.18% expense ratio, while active funds hit 0.66% meaning more money stays in your account to compound.
So can this impact the performance of active managers compared to the passive benchmark? (see chart below and part 2)
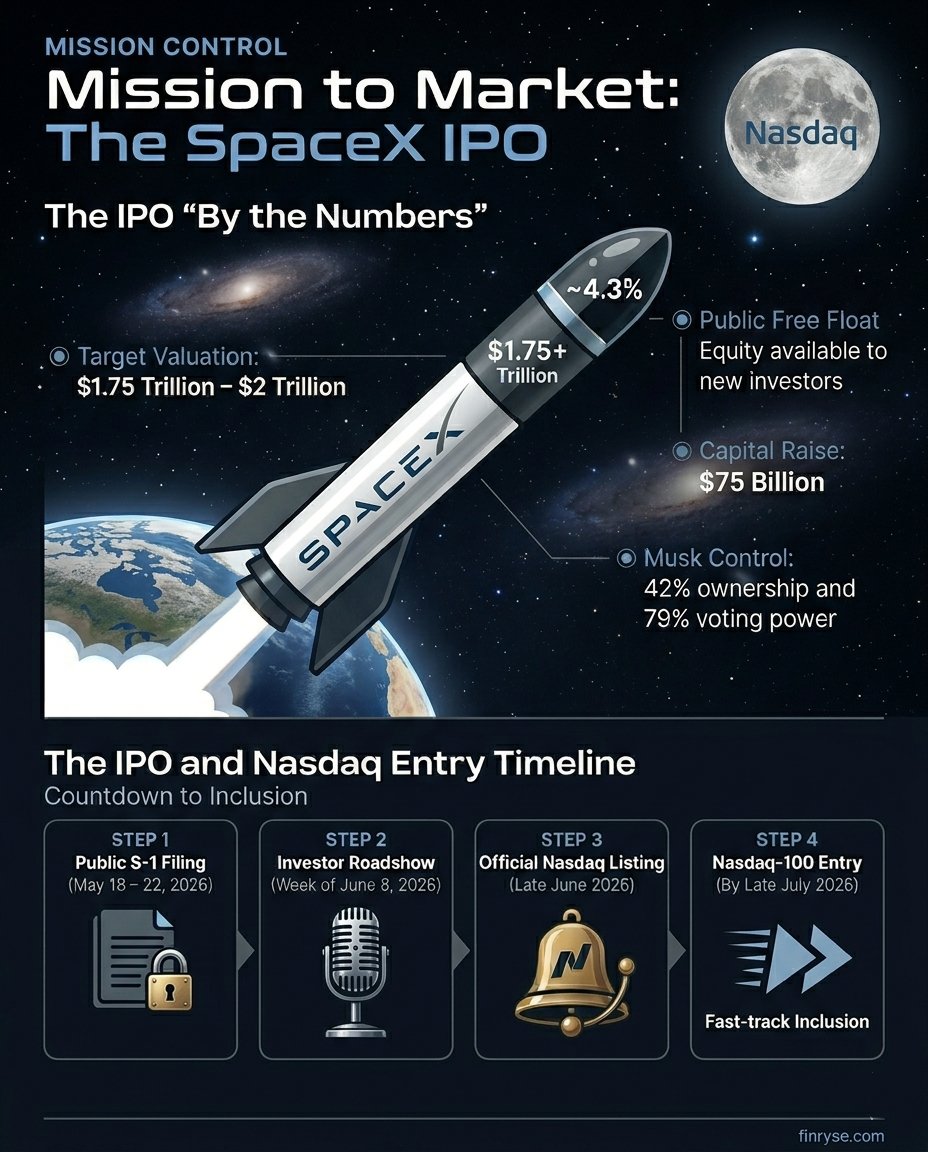
🚀 The countdown to the largest IPO in history has begun.
SpaceX is officially targeting a $1.75T–2T valuation.
But the real story is the "Fast-Track" Nasdaq entry.
We have analysed what this could mean for investors (in comment).
Check out our breakdown below. 👇 #SpaceX#IPO #Nasdaq100 #ElonMusk #FinRyse
In a few days, SpaceX is filing its S-1 at ~100x sales.
It might still rally.
The reason might have to do with $3bn of forced index-tracker buying, under rules three major index providers rewrote in the past six weeks.
Full breakdown here: https://t.co/1Exe1izwY7
The biggest earnings of the week don't print in the US.
📍$2222 Aramco (~$1.8T) Monday, into Brent +25% sequentially and a re-cut $85B dividend frame.
📍$TCEHY Tencent Wednesday, first 2026 quarter, AI capex re-up is the pressure point.
📍$RCRUY Friday, Indeed's numbers, the cleanest corporate read on US labour demand this season.
US side:
$CEG on AI-power, $CSCO on hyperscaler orders (ran $2.1B in 90 days last quarter), $AMAT on the HBM4 ramp.
Full breakdown: https://t.co/y70NR7EJZ6
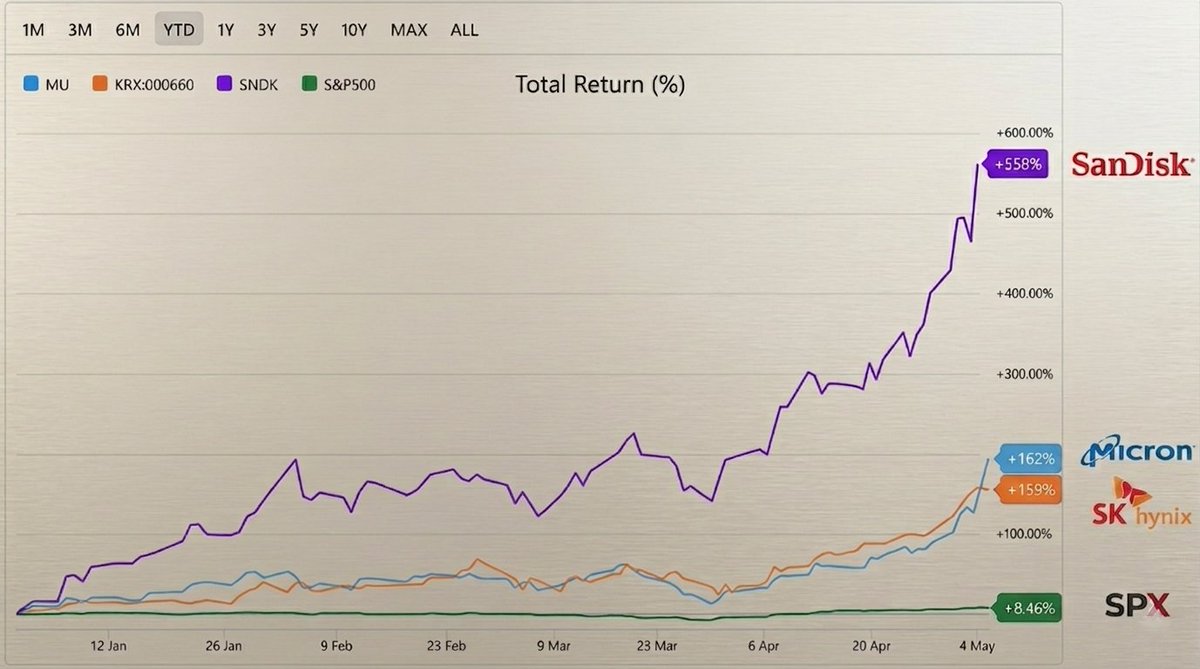
Memory is still the trade in this AI-led supercycle (?)
SK Hynix (000660.KS), Micron ($MU), and SanDisk ($SNDK) all just posted monster results, but the bigger story is supply: $MU's High Bandwidth Memory (HBM) production capacity is 100% sold out for 2026, with major supply already locked into 2027! SK Hynix and SanDisk are showing the same demand-capacity mismatch.
$MU’s Q1 revenue beat estimates by c. 19% and EPS by c. 32%; SK Hynix and $SNDK also crushed expectations (e.g. $SNDK posting a 251% revenue surge).
That’s reflected in the YTD share price performance: $SNDK +558%, $MU +162%, SK Hynix +159%, all well ahead of the S&P 500 at +8%.
The key debate now is whether the upside is limited by capacity expansion timelines, since demand is still outrunning supply across the chain.
3/3 🧵 The most effortless tool for the passive strategy is the ETF. A single MSCI World ETF trade gives you instant exposure to c. 1,600 global companies.
Compared to traditional funds, ETFs are cheaper, more tax-efficient, and can be traded instantly on the exchange like a stock.
But active management / stock-picking can still make sense. We'll discuss when and how it adds value in a future post!
#Investing #ETFs #PassiveInvesting #IndexInvesting #PortfolioDiversification
1/3 🧵 Why chase the needle when you can own the entire haystack? 🌾
Passive investing captures market returns by tracking an index 1-to-1 at a fraction of the cost.
The structural edge? Fees: U.S. index ETFs average a 0.18% expense ratio, while active funds hit 0.66% meaning more money stays in your account to compound.
So can this impact the performance of active managers compared to the passive benchmark? (see chart below and part 2)
2/3 🧵 The data is a reality check for stock-pickers. According to Morningstar, by late 2025, the 10-year success rate (% outperforming the passive benchmark) for active equity managers was just 11.4%.
And it seems the "stock-picker edge" decreases in mature, sizeable markets with the success rate being at 5% for U.S. Large-Cap and 4% for Eurozone Large-Cap vs. 20% for Emerging Markets.
Worse, 53% of active funds failed to even survive a 15-year period due to mergers or liquidations. Passive is the reliable default because it eliminates individual "manager risk".