Diving deep into stocks & fintech my way: wild ideas, contrarian calls, and the occasional market rant. Alpha hunter by day, equity philosopher by night.
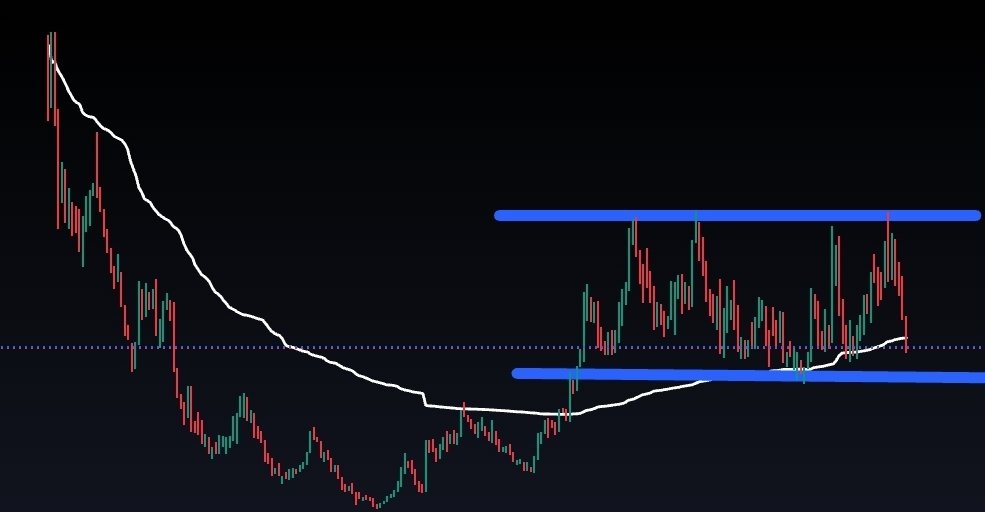
$OSCR — When in doubt, zoom out. The stock has been consolidating sideways for two years, building a massive base. And the bigger the base, the bigger the breakout. Patience is key. I still see this as a $30+ name in 2026.
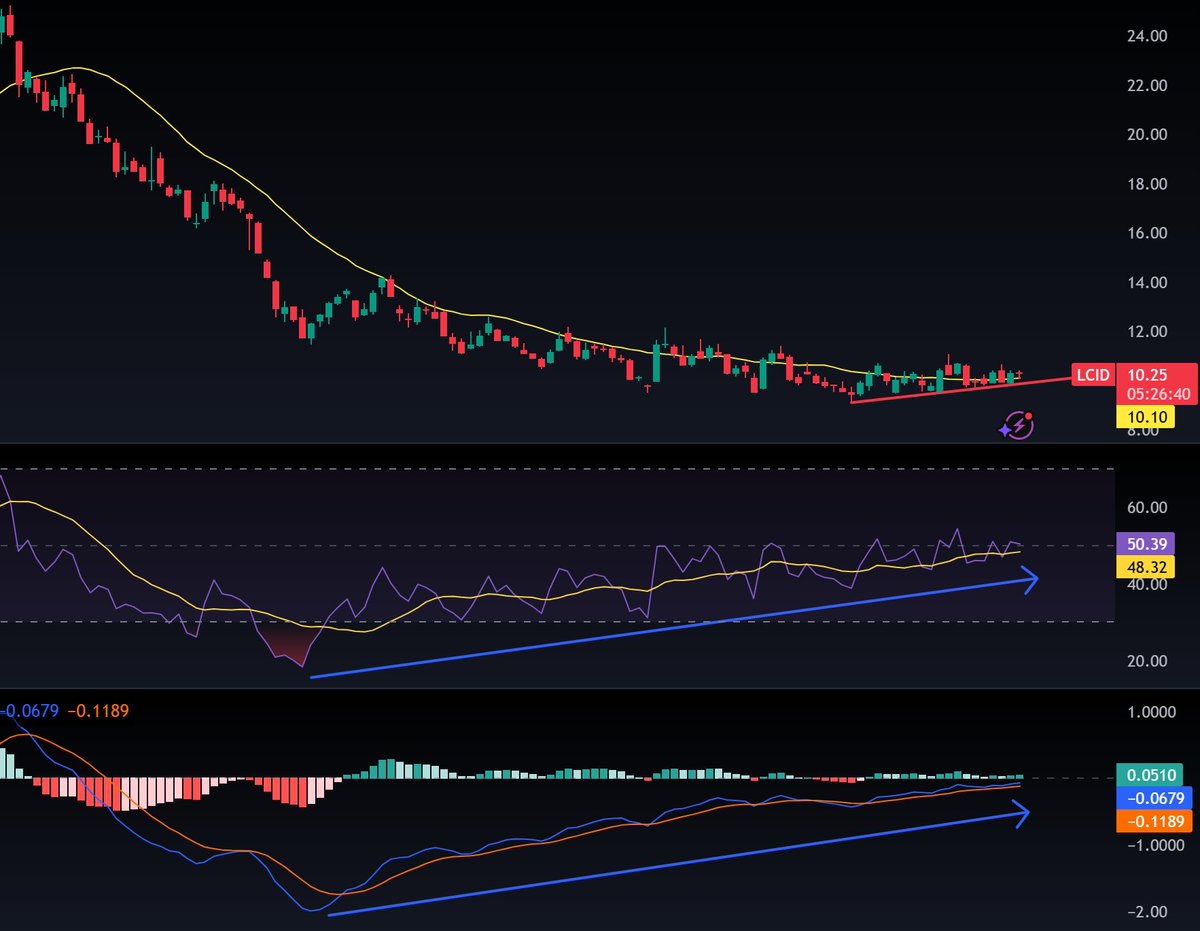
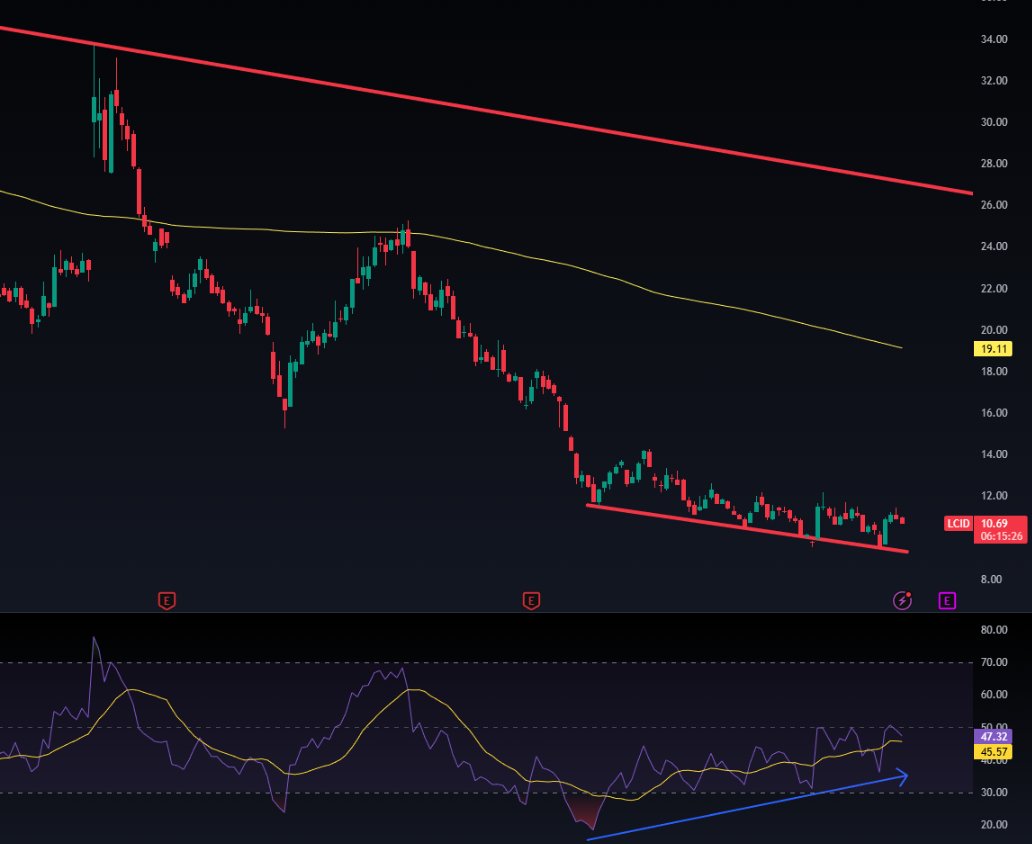
$LCID price continues to compress despite a very weak market, showing clear relative strength. The 20 SMA has flattened and price is holding above it. The bullish RSI divergence on the daily chart is now extremely strong, and MACD is confirming the same setup. As soon as the broader market stabilizes, which looks very close, this stock is well positioned to curl higher and accelerate into a strong relief rally. Momentum is building for a move ahead of the midsize vehicle reveal, and the current price action looks like accumulation before a breakout.
Of everything unveiled at $LCID Investor Day (March 12, 2026), the most bullish development may have been Lucid Lunar.
A purpose-built 2-seat robotaxi built on Lucid’s midsize platform.
• Best-in-class efficiency: 5.5–6.0 mi/kWh → 400+ mile potential range
• ~40% lower cost per mile vs. traditional rideshare + ultra-fast charging
• Premium cabin: 42"+ legroom, massive display, no driver controls
• L4-ready autonomy with an advancing Uber partnership for scaled deployment
$LCID All the negativity in the media and on social platforms is just noise.
Tune it out and focus on the chart.
Yes, it’s in a clear downtrend.
Yes, it’s been rejected at the 20SMA for months.
Nothing exciting about the price action right now.
But… let the chart speak.
RSI and MACD have been steadily rising while price keeps making lower lows. That’s a strong bullish divergence building under the surface and that’s worth paying attention to.
Is it signaling a trend reversal or just setting up for an oversold bounce? Too early to call. Price will confirm.For now, it’s on watch. 👀
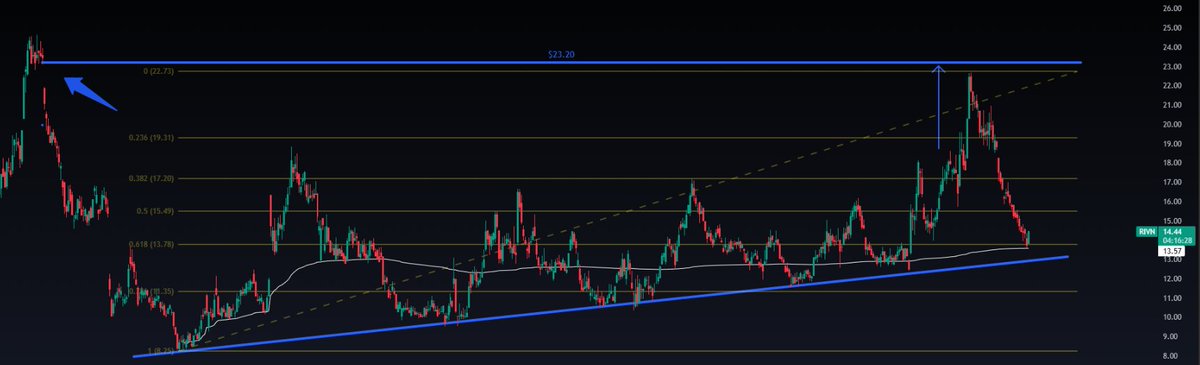
I call these speed bumps, lol, areas where supply and demand really battled before. That’s why I think the 23 to 25 zone won’t break easily on the first try.
If we push through that area with strength, 32 is my yearly target. We could get there, or even overshoot it, if the new chair of the Fed starts adding real liquidity to the market.
Right now the tape is rough and growth is getting crushed, so the strength in Rivian is definitely welcome. I think that starts to shift in March as the market begins to price in Powell’s exit and the possibility of a policy pivot. If there is a pivot, beaten down stocks like $OPEN, $LCID, $CHPT and others can absolutely fly.
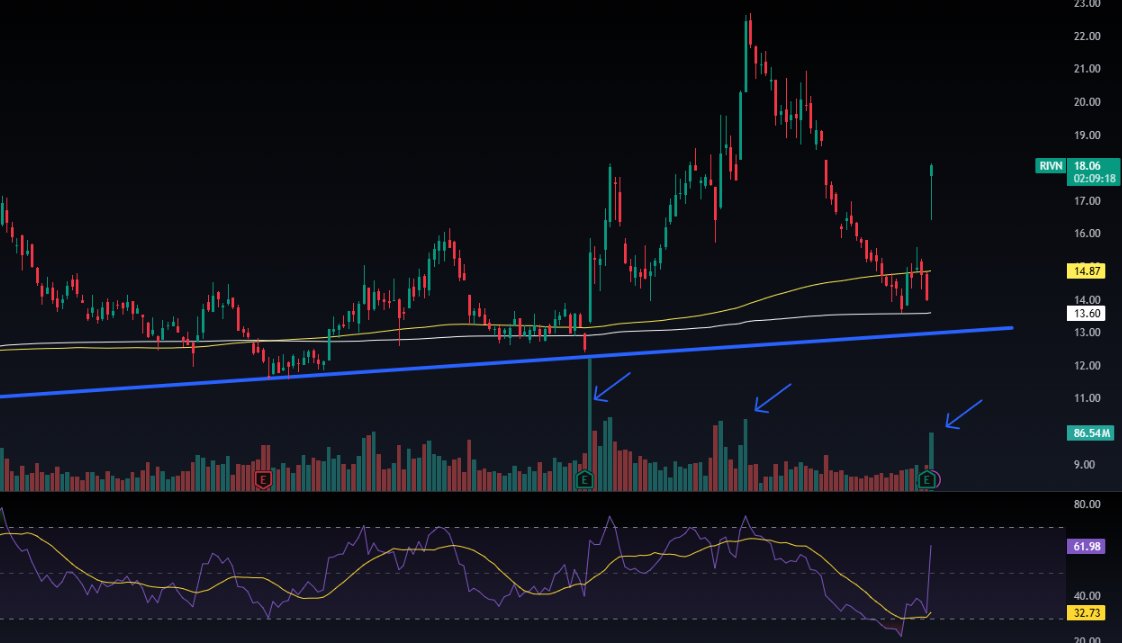
$RIVN my Feb 6 bottom call was right on target.
The stock has now impressively reclaimed all its major moving averages in a single session. The volume profile looks constructive as well, with lighter volume on red days and stronger participation on green days exactly what you want to see in a developing uptrend.
My target remains a gap fill at $23.20.
$RIVN If yesterday wasn’t the bottom, it’s extremely close. The stock dropped right to two key levels: the anchored VWAP from the all time lows, which also lines up with the 0.618 Fibonacci extension. A critical area to watch for potential support.
With $RIVN rallying like there’s no tomorrow, I want to bring back my beach ball analogy.
$LCID’s chart is extremely compressed, with multi-month bullish divergences building beneath the surface. The longer this coil tightens, the more powerful the release could be.
The shorts have been holding this beach ball underwater for a while now, but those hands are getting tired.
It’s undeniable that $RIVN has a stronger business model, better finances, and a more established leadership than $LCID.
But a ~582% difference in market cap? That doesn’t add up.
Wall Street is pricing Lucid as if bankruptcy is imminent — and that feels extreme.
This is the classic beach ball held underwater analogy. The longer it’s suppressed, the more violent the rebound when a real catalyst hits.
Lucid has arguably world-class EV technology, industry-leading range, efficiency, and design, that’s incredibly hard to replicate quickly and often underappreciated by the market.
At today’s levels, the stock looks mispriced relative to its tech value and future optionality:
Autonomy
Strategic partnerships
Robotaxi potential
The risk-reward is compelling. And once AMP-2 is production-ready and the midsize platform is officially announced, that beach ball may not just bounce — it could launch.
Trimming my $PLTR position significantly and opening a hedge with $PLTZ. ⚖️
$PLTR is showing clear signs of exhaustion — RSI divergence, heavy volume on down days, weak volume on up days, and a big stretch above the 200 SMA. A pullback to the 50 SMA looks likely. 📉
$NFLX wow, this thing is really oversold 😮💨
That said, I think there may still be a bit more downside. I’m watching the $75–$70 zone as a potential area to start a position. 👀📉
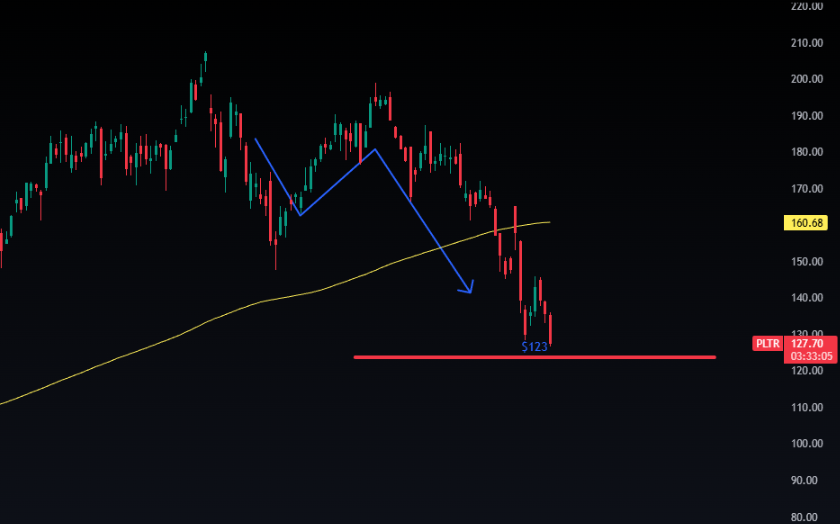
$PLTR a name I alerted on and exited back in November, is now flashing oversold conditions. While I still expect it to trade below $100 later this year, a near-term bounce from the ~$123 level looks possible.
Trimming my $PLTR position significantly and opening a hedge with $PLTZ. ⚖️
$PLTR is showing clear signs of exhaustion — RSI divergence, heavy volume on down days, weak volume on up days, and a big stretch above the 200 SMA. A pullback to the 50 SMA looks likely. 📉
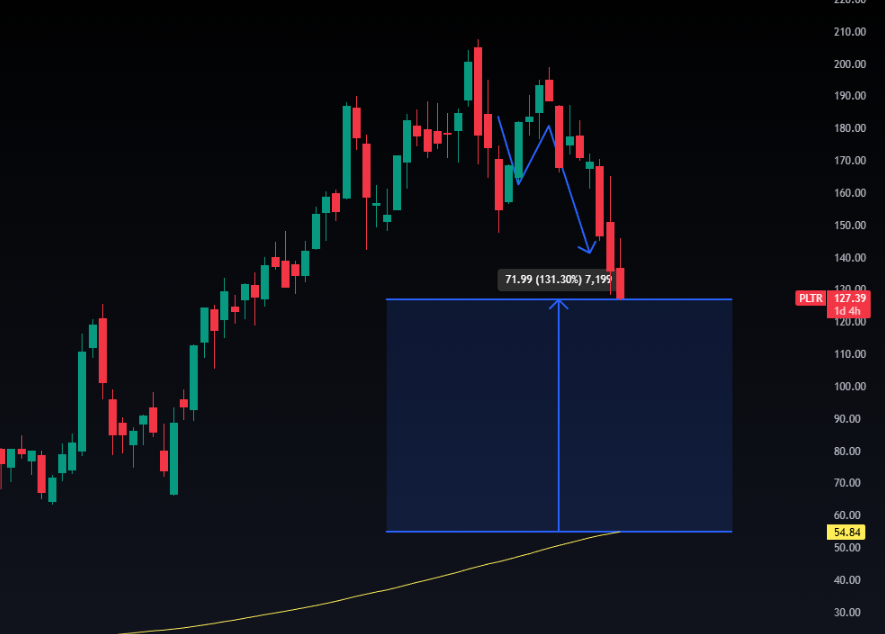
$PLTR update to my November post. It’s now trading ~131% above its weekly 200SMA. While that’s down from the prior ~361% premium, it’s still significantly extended.
Long term, I see two main scenarios:
1. Further downside to move closer to the weekly 200SMA
2.A multi-month consolidation while the 200SMA rises to meet price
Keep hearing all the buzz about Michael Burry shorting $PLTR. Sorry, Palantir bulls, but I couldn’t agree more. The stock is trading a whopping 361% above its 200SMA, showing clear RSI divergence and heavy volume on down weeks, all signs a correction is coming. If you’re long, consider hedging with $PLTZ, the 2x short leveraged ETF.
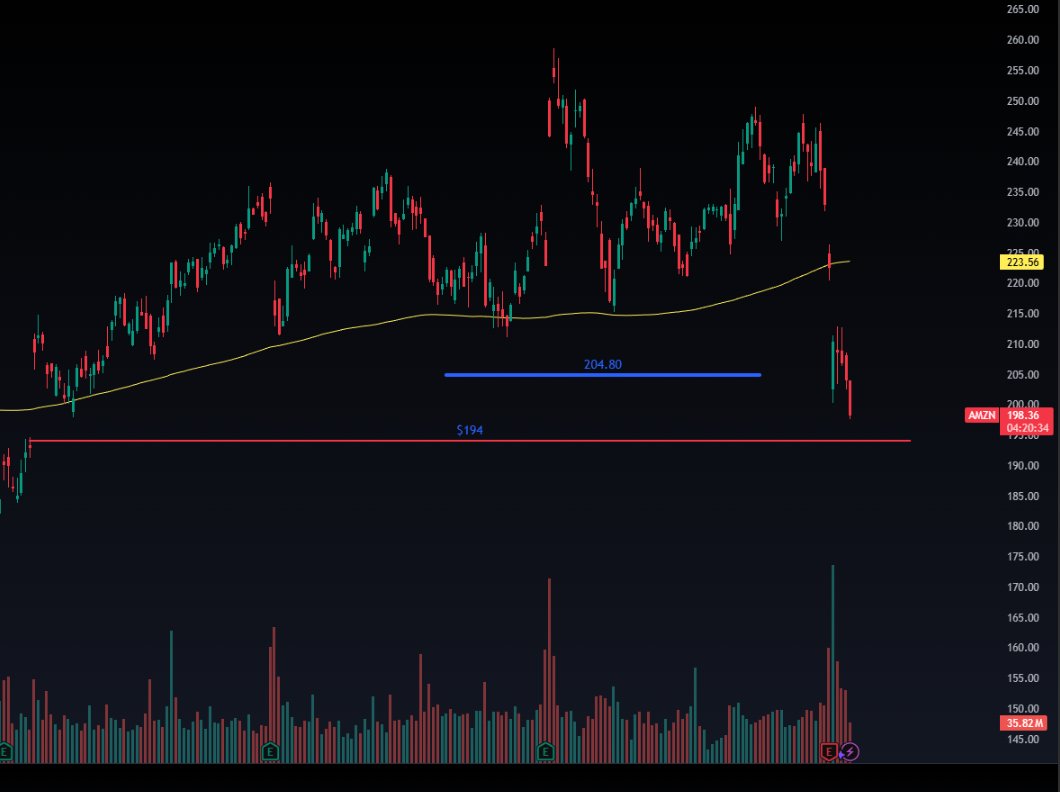
$AMZN finally undercut my $204.80 target and now looks set to fill the $194 gap. The stock is deeply oversold, so a relief bounce from this area wouldn’t be surprising.
Amazon $AMZN – I haven’t traded this name in a while. As the saying goes, from failed moves come fast moves. Amazon has been cascading since its failed breakout. I expect it to initially test the 200 SMA and potentially undercut it to the $204.80 level.
$LCID Multi month RSI divergence is building on the daily chart and starting to show on the monthly as well. These take time to play out, but they often signal major trend reversals.