#Bitcoin#CryptoAI
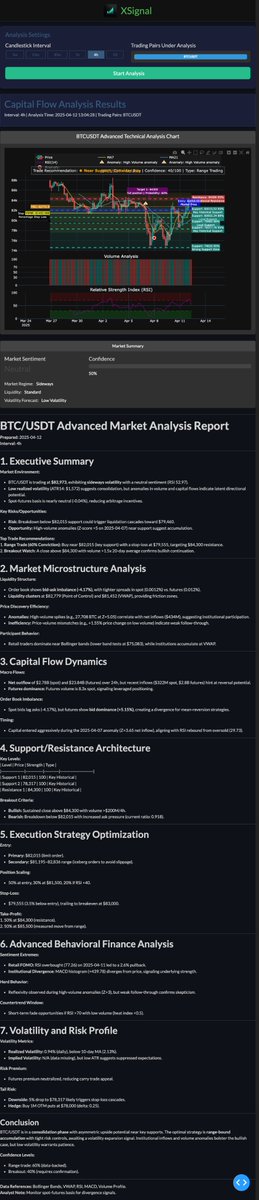
XSignal AI integrates:
• On-chain capital flow micro-analysis
• Large model training on 8 years of quantitative trading history
• Real-time order book deep learning
Enabling you to think like a professional market maker
Breaking my X hiatus because this is fascinating. I ran threat disruption at Meta for 8 years, where we routinely released reports like the Anthropic report out today. It’s noteworthy that Anthropic is being this transparent, and they deserve credit if we want this level of visibility into AI companies going forward. Here's what stood out to me, and where I'd push back. 🧵
I just went through Anthropic’s threat report & woah!
This is genuinely the craziest article I’ve read all month.
They documented hackers, governments, scammers and Chinese AI labs all using Claude in completely different ways.
& some of the cases are insane.
Here’s a TLDR;
⟣ A suspected Russian state linked group used Claude across phishing, intrusion, data theft and malware development, including rebuilding malware after security products detected it.
According to the article, more than 20 organizations were targeted.
⟣ ShinyHunters-linked hackers used AI agents to scan 1.8M Android apps for exposed secrets and help run breaches across multiple companies.
Anthropic says the agents did nearly all the work in some operations.
⟣ A China-based group built an automated exploit setup that could research vulnerabilities, build offensive tools and keep working against targets with little to no supervision.
⟣ Claude was also being used for government surveillance.
One consultant used it to build Lakana 360 for Mali’s intelligence service, a system designed to monitor roughly 25M SIM cards across the country, including calls, messages, voice interception, watchlists and automated intelligence dossiers.
The finished system runs locally, so even if anthropic bans the account, it won’t shut it down.
⟣ Anthropic found Claude being used across six weapons programs.
One Yemen-based group used multiple Claude Code instances while working on guided rockets, ballistic missiles and a hypersonic-glide project.
They actually tested one of the rockets, it failed, and they returned to Claude afterwards to diagnose the problem.
⟣ A Russia-based team was working on autonomous FPV kamikaze drones capable of identifying target classes, including humans, and approving lethal engagement without a human making the final call.
⟣ One China-linked project built electronic-warfare and air-defense suppression systems, then later changed its scenario to 12 targets in Taiwan, including radar sites, air bases and command infrastructure.
⟣ Anthropic found multiple influence operations too, including fake news networks, fake political accounts, propaganda operations and systems built to copy the writing style of real people.
⟣ Then there’s this fucking dating operation.
More than 20 dating apps.
> 4,700+ AI personas.
> 25,000+ people talking to them.
> Around 2.36M Claude messages in two weeks.
And when someone wanted a video call or social follow, real gig workers could step in to make the fake profile look legit.
⟣ Then Anthropic gets into distillation.
They say they’ve now caught campaigns from Alibaba, Moonshot, DeepSeek, https://t.co/ld9O2bPADg, Xiaomi, SenseTime and MiniMax.
Alibaba alone allegedly ran 151M+ Claude exchanges between May and July, peaking at almost 3M per day.
(I just wrote a piece on distillation before this)
> Moonshot: 23M+.
> DeepSeek: 12.1M+ in 14 days.
And this is where it gets messy.
Anthropic says Moonshot and DeepSeek were sometimes routing requests from their own users through Claude without telling them.
Those requests included internal company documents, source code, live credentials, surveillance data and other sensitive information.
⟣ Some labs were also actively trying to extract Claude’s hidden reasoning.
Anthropic says one lab tested 12,000+ different requests, each trying a different method, until it found techniques that worked and scaled them up.
That’s the TLDR.
Got me feeling like 👇
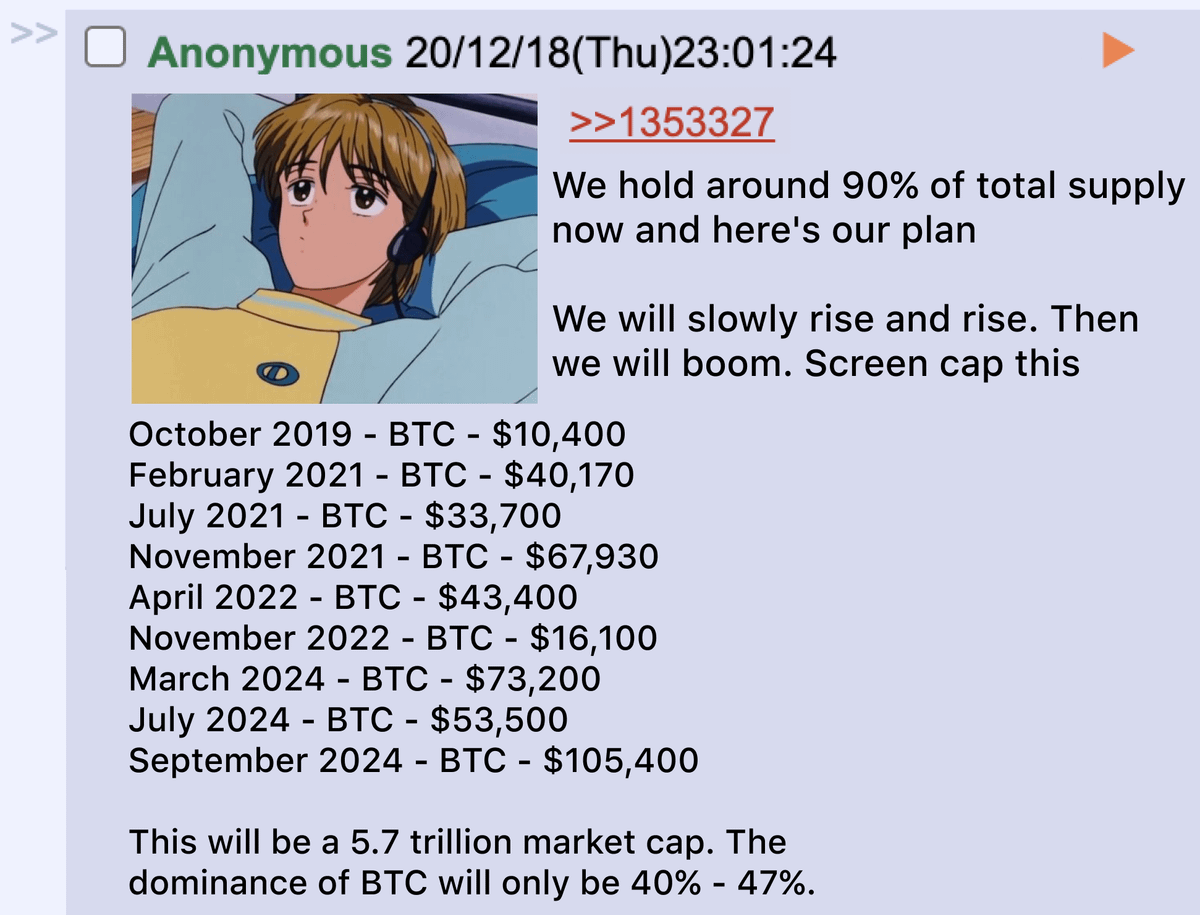
"Today, President Donald J. Trump signed an Executive Order to establish a Strategic Bitcoin Reserve...With a fixed supply of 21 million coins, there is a strategic advantage to being among the first nations to create a Strategic Bitcoin Reserve."
https://t.co/d9MJlgUjZd
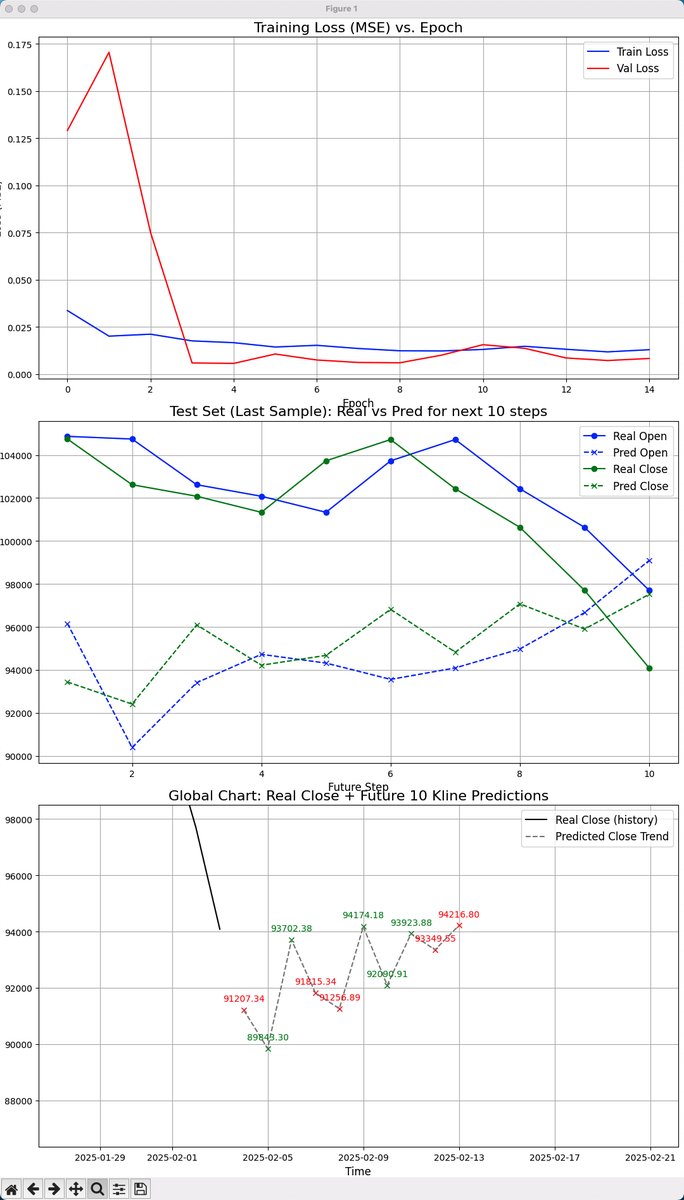
#Bitcoin 3 Feb 2025 Deep Learning Model Prediction for Bitcoin for the Next 10 Days:
The actual opening price has gradually decreased from approximately 104,000 to about 96,000, and the predicted opening price roughly follows this trend. The trends of the actual closing price and the predicted closing price are similar. Overall, the prediction results reflect the fluctuation trend of the actual data, but there is still room for improvement in precision.
Historical data shows that between January 29, 2025, and February 1, 2025, the closing price fluctuated between approximately 89,000 and 94,000. The predicted future closing price trend shows significant fluctuations between February 3, 2025, and February 21, 2025. The overall trend is consistent with historical data, but there are noticeable errors at certain time points.
#Bitcoin#Bitcoinprice#AI The artificial intelligence model predicts Bitcoin prices, comparing historical real closing prices with predictions for future closing prices over the next 10 K time points.
Refer to the chart at the bottom:
Horizontal Axis (Time): Displays the time period from 06:30 to 10:30 on the 29th.
Vertical Axis (Price): Also displays the price.
Black Line (Real Close (history)): Represents the actual historical closing prices.
Red Dashed Line and Crosses (Predicted Close): Shows the model's predictions for future closing prices.
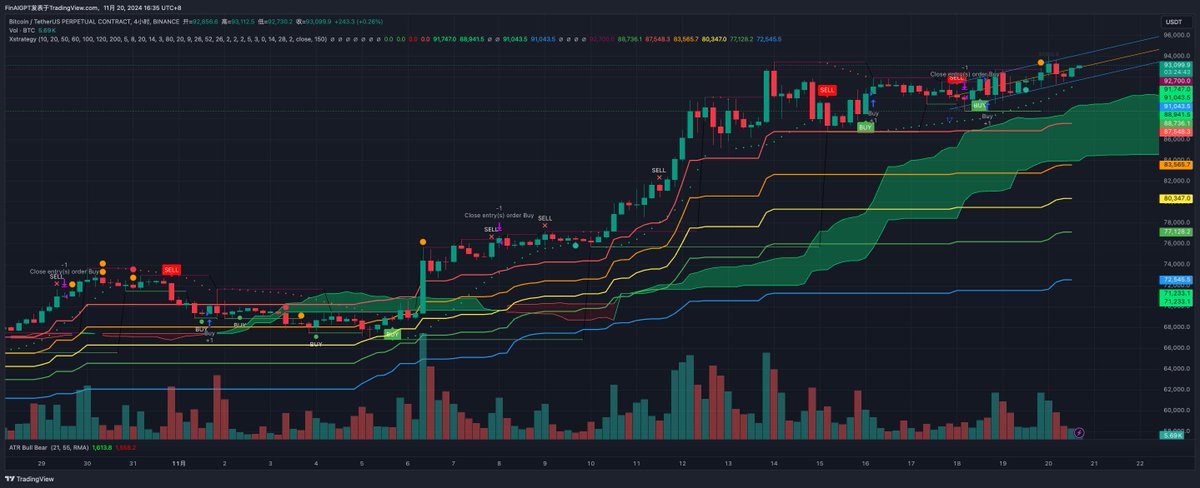
#BTC /USDT 11 20, VIP Technical Analysis
https://t.co/ruvMBbd0Yj
Data
Opening price: 92,856.6 USDT
Highest price: 93,112.5 USDT
Lowest price: 92,730.2 USDT
Closing price: 93,099.9 USDT
Price fluctuation: +243.3 USDT (+0.26%)
Transaction Volume
Transaction volume: 5.69K BTC
The transaction volume significantly increases when the price fluctuates drastically, reflecting changes in market participation.
Technical Indicators
Moving Average (MA)
The short-term moving averages (e.g., 10, 20 periods) are above the long-term moving averages (e.g., 50, 100 periods), indicating a strong upward trend in the short term.
Moving averages of various periods:
10-day MA: 91,747.0 USDT
20-day MA: 91,043.5 USDT
50-day MA: 88,736.1 USDT
100-day MA: 87,548.3 USDT
200-day MA: 83,665.7 USDT
Ichimoku Cloud
Conversion line (Tenkan-sen): 88,941.5 USDT
Base line (Kijun-sen): 88,736.1 USDT
Leading Span A (cloud upper boundary): 91,747.0 USDT
Leading Span B (cloud lower boundary): 91,043.5 USDT
The current price is above the cloud, indicating a bullish market trend.
Buy/Sell Signals
Multiple buy and sell signals marked:
The most recent buy signal appeared before the price rise, indicating accurate signals.
Recent sell signals appeared before the minor price correction.
Average True Range (ATR)
Current ATR value: 1,613.8
A high ATR value indicates high market volatility.
Support and Resistance Levels
Main support levels:
88,736.1 USDT
87,548.3 USDT
83,665.7 USDT
Main resistance levels:
91,747.0 USDT
91,043.5 USDT
Data Trend Analysis
Price Trend
The price has been rising overall recently, with the short-term price moving above the cloud, indicating strong bullish sentiment in the market.
Short-term moving averages are above the long-term moving averages, suggesting a strong upward momentum in the short term.
Transaction Volume Changes
Transaction volume significantly increases when the price fluctuates drastically, indicating an increase in market participation.
High transaction volume is usually accompanied by price fluctuations, so be alert to possible price corrections.
Technical Indicator Trends
Both short-term and long-term moving averages are upward, indicating the overall market is bullish.
The short-term average is above the long-term average, suggesting strong upward momentum in the near term.
Ichimoku Cloud Signals
The price is running above the cloud, showing strong future support.
Both the conversion line and the base line are upward, indicating that the bullish market trend has not changed.
Buy/Sell Signals
Multiple buy and sell signals provide a reference for market sentiment, with the most recent buy signal being accurate.
The buy signals in the short term show that the bullish sentiment in the market is strong.
Volatility (ATR)
The ATR value is 1,613.8, indicating high market volatility.
High volatility means that the price may fluctuate drastically, so it should be treated with caution.
Support and Resistance
Support and resistance levels provide important price reference points, which are helpful for judging possible price corrections and breakthroughs.
Conclusion
Overall Trend: The market is in a bullish trend, and the price has the potential to rise further.
Risk Control: Due to high market volatility, investors need to set reasonable stop-loss and profit targets.
Support and Resistance: Pay close attention to important support and resistance levels, and judge possible price corrections and breakthrough positions.
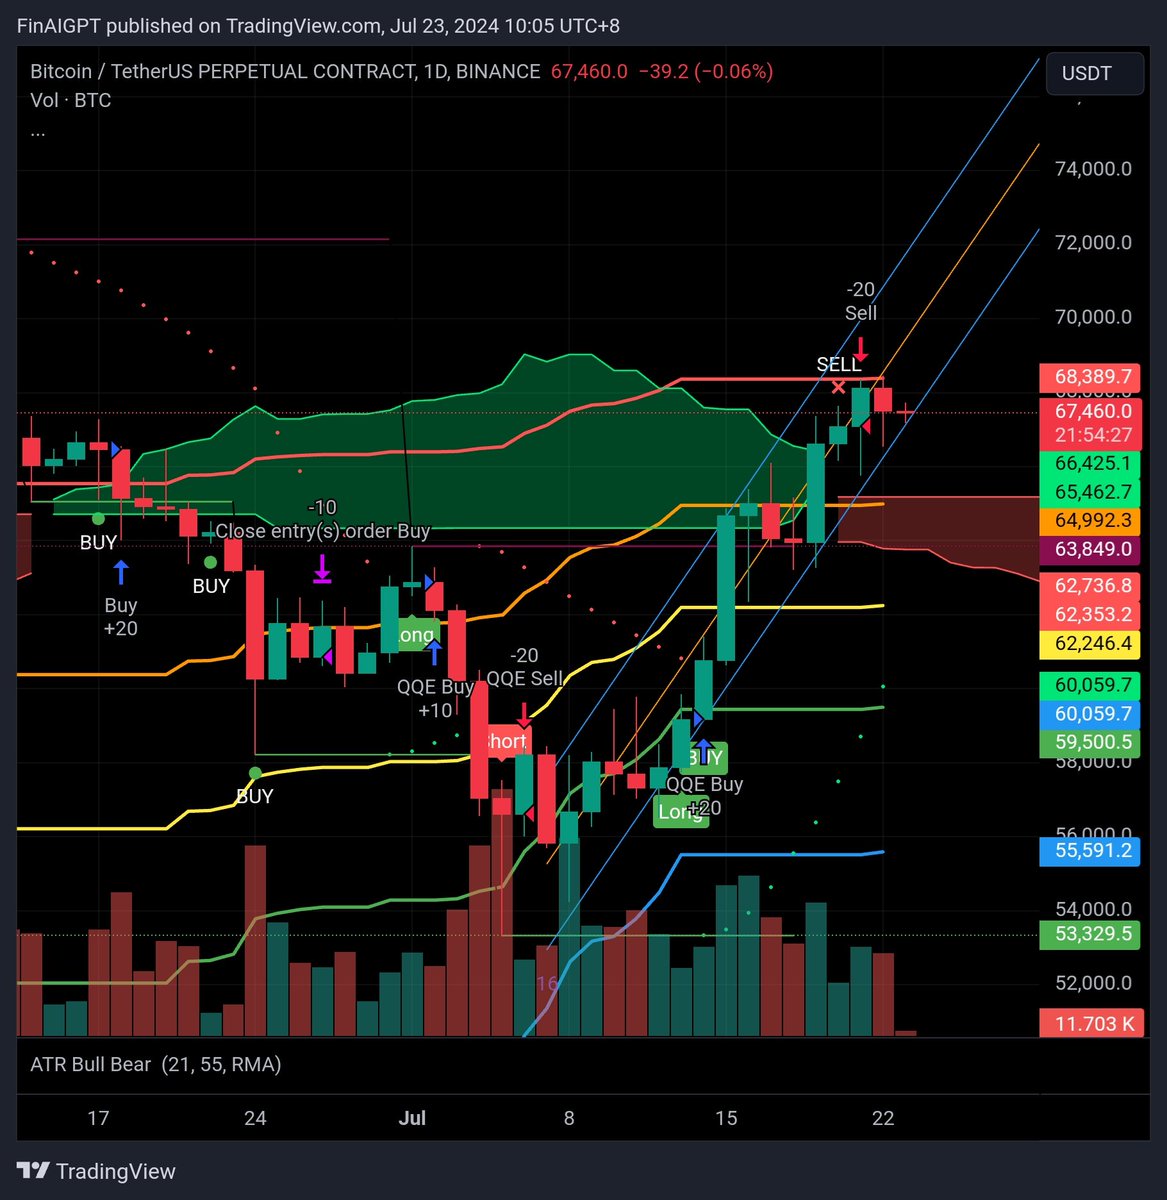
7.23 #BTC /USDT Analysis
Fibonacci Retracement Analysis
1. **Fibonacci Retracement Levels**:
- From the lowest point (around 53,329.5 USDT) to the highest point (around 72,000.0 USDT), the key Fibonacci retracement levels are as follows:
- 0.236: approximately 66,425.1 USDT
- 0.382: approximately 65,462.7 USDT
- 0.5: approximately 62,246.4 USDT
- 0.618: approximately 59,500.5 USDT
- The current price at 67,499.2 USDT is close to the 0.236 Fibonacci retracement level (66,425.1 USDT).
#### Ichimoku Cloud (Ichimoku Kinko Hyo)
1. **Main Components**:
- **Base Line (Kijun-sen)**: Current value is around 65,462.7 USDT, acting as a support and resistance level for the mid-term trend.
- **Conversion Line (Tenkan-sen)**: Current value is around 66,425.1 USDT, indicating the short-term trend.
- **Leading Span A (Senkou Span A)**: Current value is around 65,462.7 USDT, representing support/resistance for the next 26 periods.
- **Leading Span B (Senkou Span B)**: Current value is around 55,591.2 USDT, representing support/resistance for the next 26 periods.
- **Lagging Span (Chikou Span)**: The current price shifted 26 periods back, confirming the current trend.
#### Other Technical Indicators
1. **Bollinger Bands**:
- Bollinger Bands Middle Line (Green): Current value is around 65,462.7 USDT.
- Bollinger Bands Upper and Lower Lines are 66,425.1 USDT and 60,059.7 USDT respectively, indicating significant market volatility.
2. **Buy and Sell Signals**:
- The recent buy signal appeared at the 62,246.4 USDT level.
- The sell signal is near the 66,425.1 USDT level.
3. **ATR Bull Bear (21, 55, RMA)**: Current values are 2,408.8 (Green) and 2,463.7 (Red), indicating market volatility and trend strength.
### Detailed Analysis
- **Support and Resistance**:
- Major support levels: 65,462.7 USDT (Kijun-sen), 59,500.5 USDT (Fibonacci 0.618).
- Major resistance levels: 66,425.1 USDT (Fibonacci 0.236), 72,000.0 USDT (upward channel upper line).
- **Trend**:
- The current price is above the Ichimoku Cloud, indicating a strong upward trend.
- The upward movement of the Conversion Line and Base Line supports the bullish trend in the short and mid-term.
### Conclusion
- Based on Fibonacci retracement and Ichimoku Cloud analysis, the current price oscillates between the support at 66,425.1 USDT and the resistance at 72,000.0 USDT, with an overall bullish trend. Key support levels are at 65,462.7 USDT and 59,500.5 USDT, and resistance levels are at 66,425.1 USDT and 72,000.0 USDT.
---
## ETH/USDT Perpetual Contract Detailed Analysis
### Chart Analysis
#### Fibonacci Retracement Analysis
1. **Fibonacci Retracement Levels**:
- From the lowest point (around 2,800.00 USDT) to the highest point (around 3,790.18 USDT), the key Fibonacci retracement levels are as follows:
- 0.236: approximately 3,599.35 USDT
- 0.382: approximately 3,445.13 USDT
- 0.5: approximately 3,271.68 USDT
- 0.618: approximately 3,137.98 USDT
- The current price at 3,438.09 USDT is close to the 0.382 Fibonacci retracement level (3,445.13 USDT).
#### Ichimoku Cloud (Ichimoku Kinko Hyo)
1. **Main Components**:
- **Base Line (Kijun-sen)**: Current value is around 3,346.03 USDT, acting as a support and resistance level for the mid-term trend.
- **Conversion Line (Tenkan-sen)**: Current value is around 3,419.07 USDT, indicating the short-term trend.
- **Leading Span A (Senkou Span A)**: Current value is around 3,346.03 USDT, representing support/resistance for the next 26 periods.
- **Leading Span B (Senkou Span B)**: Current value is around 3,137.98 USDT, representing support/resistance for the next 26 periods.
- **Lagging Span (Chikou Span)**: The current price shifted 26 periods back, confirming the current trend.
#### Other Technical Indicators
1. **Bollinger Bands**:
- Bollinger Bands Middle Line (Green): Current value is around 3,445.13 USDT.
- Bollinger Bands Upper and Lower Lines are 3,599.35 USDT and 3,137.98 USDT respectively, indicating significant market volatility.
2. **Buy and Sell Signals**:
- The recent buy signal appeared at the 3,137.98 USDT level.
- The sell signal is near the 3,599.35 USDT level.
3. **ATR Bull Bear (21, 55, RMA)**: Current values are 142.75 (Green) and 151.22 (Red), indicating market volatility and trend strength.
### Detailed Analysis
- **Support and Resistance**:
- Major support levels: 3,346.03 USDT (Kijun-sen), 3,137.98 USDT (Senkou Span B).
- Major resistance levels: 3,445.13 USDT (Fibonacci 0.382), 3,599.35 USDT (Fibonacci 0.236).
- **Trend**:
- The current price is above the Ichimoku Cloud, indicating a strong upward trend.
- The upward movement of the Conversion Line and Base Line supports the bullish trend in the short and mid-term.
### Conclusion
- Based on Fibonacci retracement and Ichimoku Cloud analysis, the current price oscillates between the support at 3,445.13 USDT and the resistance at 3,599.35 USDT, with an overall bullish trend. Key support levels are at 3,346.03 USDT and 3,137.98 USDT, and resistance levels are at 3,445.13 USDT and 3,599.35 USDT.
#Bitcoin (#BTC) & #ETH Technical Analysis https://t.co/YFXOcNsytT
1. Price Trend
**Current Price**: 54,906.7 USDT
2. Ichimoku Cloud Analysis
- **Price Location**: The price is below the cloud, indicating a bearish trend.
- **Conversion Line (Tenkan-sen) and Base Line (Kijun-sen)**: Both are above the price, further confirming the bearish trend.
- **Leading Span A and B**: The cloud is above the price, indicating strong resistance.
3. Support and Resistance
- **Support Levels**: 54,524.7 USDT, 53,329.5 USDT, 49,262.6 USDT
- **Resistance Levels**: 58,220.6 USDT, 61,916.5 USDT, 66,489.5 USDT
4. Fibonacci Retracement Levels
- **38.2% Retracement Level**: Around 58,220.6 USDT
- **50% Retracement Level**: Around 61,916.5 USDT
- **61.8% Retracement Level**: Around 66,489.5 USDT
5. Technical Indicator Analysis
- **Average True Range (ATR)**: High volatility (2,257.6 USDT), indicating significant market fluctuations.
- **Sell Signals**: Prevalent, indicating bearish market sentiment.
Comprehensive Analysis
Bitcoin is currently in a downtrend, with prices hovering around key support levels. If the price continues to break below 54,524.7 USDT, it may further decline to 49,262.6 USDT. Conversely, if the price can successfully break through the resistance level at 58,220.6 USDT, it may have the potential to rise further.
Ethereum (ETH) Technical Analysis
1. Price Trend
**Current Price**: 2,911.20 USDT
2. Ichimoku Cloud Analysis
- **Price Location**: The price is below the cloud, indicating a bearish trend.
- **Conversion Line (Tenkan-sen) and Base Line (Kijun-sen)**: Both are above the price, further confirming the bearish trend.
- **Leading Span A and B**: The cloud is above the price, indicating strong resistance.
3. Support and Resistance
- **Support Levels**: 2,985.68 USDT, 2,911.20 USDT, 2,683.13 USDT
- **Resistance Levels**: 3,198.19 USDT, 3,336.92 USDT, 3,673.63 USDT
4. Fibonacci Retracement Levels
- **38.2% Retracement Level**: Around 3,198.19 USDT
- **50% Retracement Level**: Around 3,336.92 USDT
- **61.8% Retracement Level**: Around 3,673.63 USDT
5. Technical Indicator Analysis
- **Average True Range (ATR)**: High volatility (146.74 USDT), indicating significant market fluctuations.
- **Sell Signals**: Prevalent, indicating bearish market sentiment.
Comprehensive Analysis
Ethereum is also in a downtrend, with prices hovering around key support levels. If the price continues to break below 2,911.20 USDT, it may further decline to 2,683.13 USDT. Conversely, if the price can successfully break through the resistance level at 3,198.19 USDT, it may have the potential to rise further.
Summary
Currently, both BTC and ETH exhibit clear downtrends with bearish market sentiment. Investors should pay close attention to key support and resistance levels and market volatility and operate cautiously.
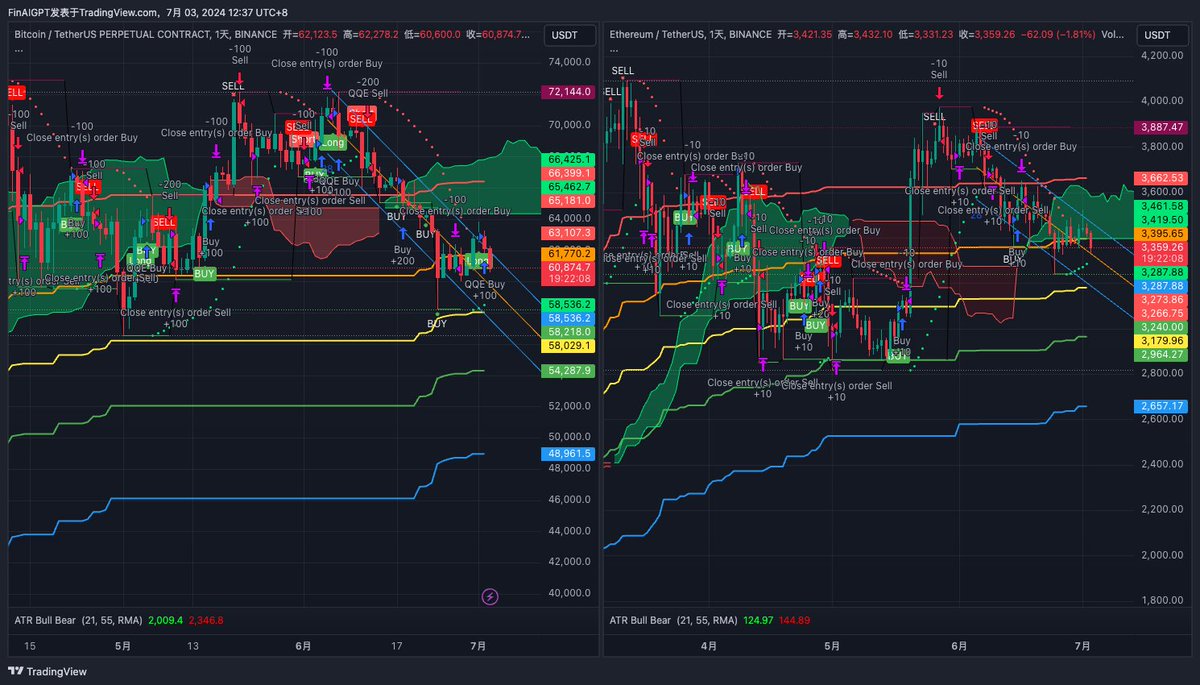
#Bitcoin (BTC) and #Ethereum (ETH) Technical Analysis
https://t.co/YFXOcNsytT
#BTC Technical Analysis
1. Price Trend
Current Price: 60,874.7 USDT
2. Ichimoku Cloud Analysis
The price is below the cloud, indicating a bearish trend.
Both the Conversion Line (Tenkan-sen) and the Base Line (Kijun-sen) are above the price, further confirming the bearish trend.
The Leading Span A and B form a cloud above the price, indicating strong resistance.
3. Support and Resistance
Support Levels: 58,536.2 USDT, 58,029.1 USDT, 54,287.9 USDT
Resistance Levels: 63,107.3 USDT, 66,625.1 USDT, 72,144.0 USDT
4. Fibonacci Retracement Levels
Although the chart does not show specific Fibonacci retracement levels, we can roughly estimate:
38.2% Retracement Level: Around 61,770.2 USDT
50% Retracement Level: Around 63,107.3 USDT
61.8% Retracement Level: Around 66,625.1 USDT
5. Technical Indicator Analysis
ATR (Average True Range) indicates high volatility (2,009.4 USDT), showing significant market fluctuations.
Sell signals are prevalent, indicating bearish market sentiment.
Comprehensive Analysis
BTC is currently in a downtrend, with prices hovering around key support levels. If the price continues to break below 58,536.2 USDT, it may further decline to 54,287.9 USDT. Conversely, if the price can successfully break through the resistance level at 63,107.3 USDT, it may have the potential to rise further.
Ethereum (ETH) Technical Analysis
1. Price Trend
Current Price: 3,359.26 USDT
2. Ichimoku Cloud Analysis
The price is below the cloud, indicating a bearish trend.
Both the Conversion Line (Tenkan-sen) and the Base Line (Kijun-sen) are above the price, further confirming the bearish trend.
The Leading Span A and B form a cloud above the price, indicating strong resistance.
3. Support and Resistance
Support Levels: 3,240.96 USDT, 3,179.96 USDT, 2,964.27 USDT
Resistance Levels: 3,461.58 USDT, 3,662.53 USDT, 3,887.47 USDT
4. Fibonacci Retracement Levels
Although the chart does not show specific Fibonacci retracement levels, we can roughly estimate:
38.2% Retracement Level: Around 3,288.88 USDT
50% Retracement Level: Around 3,273.86 USDT
61.8% Retracement Level: Around 3,461.58 USDT
5. Technical Indicator Analysis
ATR (Average True Range) indicates relatively low volatility (124.97 USDT), but significant fluctuations still exist.
Sell signals are prevalent, indicating bearish market sentiment.
Comprehensive Analysis
ETH is also in a downtrend, with prices hovering around key support levels. If the price continues to break below 3,240.96 USDT, it may further decline to 2,964.27 USDT. Conversely, if the price can successfully break through the resistance level at 3,461.58 USDT, it may have the potential to rise further.
Summary
Currently, both BTC and ETH exhibit clear downtrends with bearish market sentiment. Investors should pay close attention to key support and resistance levels and market volatility and operate cautiously.
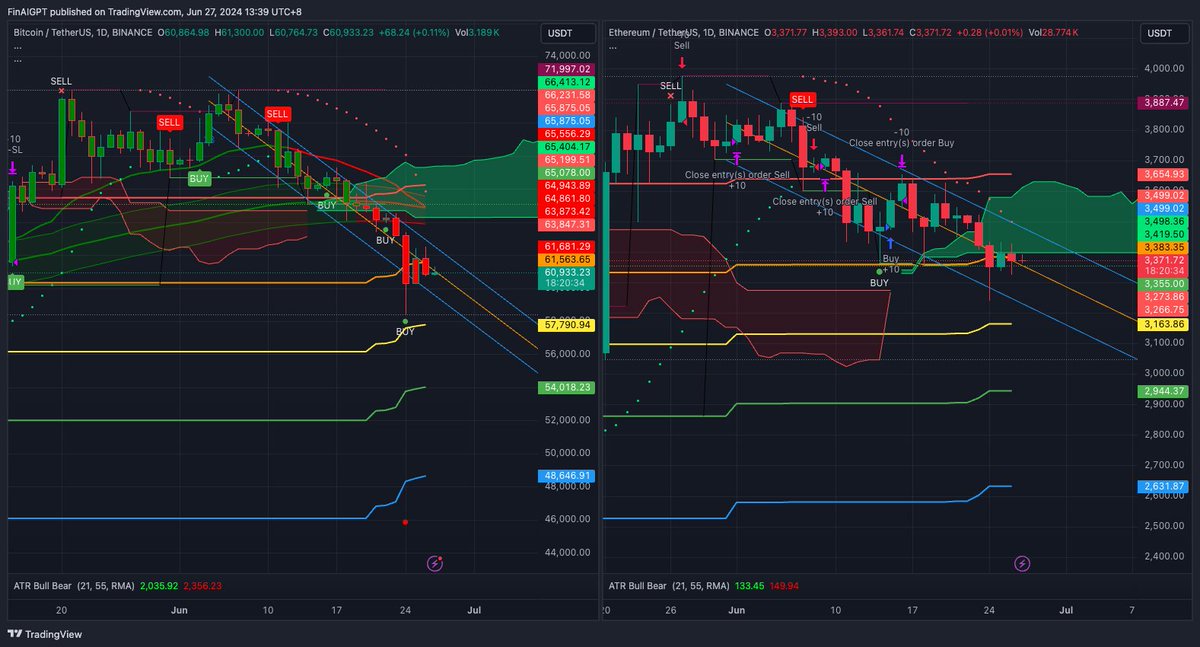
BTC ETH 6.27 VIP Technical Analysis
https://t.co/YFXOcNsytT
Bitcoin (#BTC ) Daily Chart Technical Analysis
Price Trend:
Current price: 60,960 USDT.
The price is in a downtrend, within a descending channel, and has been fluctuating near the lower band of the channel in recent days.
Support and Resistance:
Major Resistance: 65,675.85 USDT (Bollinger Band upper band).
Major Support: 57,790.94 USDT (Bollinger Band lower band).
Technical Indicators:
Bollinger Bands:The upper and lower bands of the Bollinger Bands are at 65,675.85 USDT and 57,790.94 USDT, respectively.
The current price is near the lower band, indicating a potential oversold condition, suggesting a possible rebound from a statistical perspective.
Moving Averages:Short-term moving averages (e.g., 5-day and 10-day) are trending downwards, indicating strong short-term selling pressure.
Long-term moving averages (e.g., 50-day and 200-day) are also trending downwards, indicating a bearish mid-to-long-term trend.
Moving Average Crossovers: The short-term moving averages crossing below the long-term moving averages form a “death cross,” signaling a strong bearish indication.
RSI (Relative Strength Index):The RSI is not shown in the chart, but if it is below 30, it is considered oversold, and if above 70, it is overbought.
Given the price is near the lower Bollinger Band, the RSI might be close to 30, suggesting a short-term rebound opportunity.
MACD (Moving Average Convergence Divergence):If the MACD line and the signal line are in the negative region with the MACD line below the signal line, it indicates a strong downtrend.
ATR (Average True Range):The ATR indicator shows the current volatility at 2,035.92, indicating high market volatility, which suggests potential for significant price swings.
Ichimoku Cloud:
Cloud: The current price is below the cloud, indicating a bearish trend.
Kijun-sen (Base Line) and Tenkan-sen (Conversion Line): Both are above the price, indicating strong short-term and medium-term downward pressure.
Lagging Span: Although not shown in the chart, if the Lagging Span is below the price, it further confirms the current downtrend.
#Ethereum (#ETH ) Daily Chart Technical Analysis
Price Trend:
Current price: 3,374.61 USDT.
The price is in an overall downtrend, within a descending channel, and has been fluctuating near the lower band of the channel in recent days.
Support and Resistance:
Major Resistance: 3,499.02 USDT (Bollinger Band upper band).
Major Support: 3,266.75 USDT (Bollinger Band lower band).
Technical Indicators:
Bollinger Bands:The upper and lower bands of the Bollinger Bands are at 3,499.02 USDT and 3,266.75 USDT, respectively.
The current price is near the lower band, indicating a potential oversold condition, suggesting a possible rebound from a statistical perspective.
Moving Averages:Short-term moving averages (e.g., 5-day and 10-day) are trending downwards, indicating strong short-term selling pressure.
Long-term moving averages (e.g., 50-day and 200-day) are also trending downwards, indicating a bearish mid-to-long-term trend.
Moving Average Crossovers: The short-term moving averages crossing below the long-term moving averages form a “death cross,” signaling a strong bearish indication.
MACD (Moving Average Convergence Divergence):MACD Line: Typically the 12-day EMA minus the 26-day EMA.
Signal Line: Typically the 9-day EMA.
If the MACD line and the signal line are in the negative region with the MACD line below the signal line, it indicates a strong downtrend.
MACD Histogram: Reflects the difference between the MACD line and the signal line. If the histogram is below zero and shortening, it may indicate weakening bearish momentum, suggesting a potential rebound.
ATR (Average True Range):The current ATR value is 2,035.92, indicating high market volatility. Higher ATR values signify greater market volatility and potential for significant price swings.
Volume:The chart shows relatively low trading volume, indicating subdued market activity. Low volume typically suggests a lack of momentum, and prices may continue to oscillate between support and resistance levels.
Ichimoku Cloud:
Cloud: The current price is below the cloud, indicating a bearish trend. The cloud, formed by Senkou Span A and Senkou Span B, provides support during an uptrend and resistance during a downtrend.
Kijun-sen (Base Line) and Tenkan-sen (Conversion Line): Both are above the price, indicating strong short-term and medium-term downward pressure. A “death cross” occurs when the Conversion Line crosses below the Base Line, signaling a strong sell indication.
Lagging Span: If the Lagging Span is below the price, it further confirms the current downtrend.
Comprehensive Analysis and Trading Strategy
Comprehensive Analysis:
Both Bitcoin and Ethereum are currently in a downtrend, with prices near the lower Bollinger Band and major support levels, suggesting a potential short-term rebound.
The RSI may be approaching oversold levels, and the MACD indicates a possible weakening of bearish momentum, supporting the short-term rebound hypothesis.
However, overall technical indicators (moving averages, Ichimoku Cloud, etc.) still show a bearish mid-to-long-term trend, implying that any rebound might be limited.
Trading Strategy:
Short-term Trading:If the price stabilizes near the support levels (Bitcoin: 57,790.94 USDT; Ethereum: 3,266.75 USDT) and shows rebound signals (e.g., candlestick patterns, RSI bouncing from oversold levels), consider short-term buying.
Target price could be set near the middle or upper Bollinger Band (Bitcoin: middle band around 61,733.40 USDT, upper band around 65,675.85 USDT; Ethereum: middle band around 3,382.89 USDT, upper band around 3,499.02 USDT).
Stop-loss can be set below the major support level (Bitcoin: 57,000 USDT; Ethereum: 3,200 USDT).
Mid-to-long-term Trading:Given the overall bearish trend, wait for more clear trend reversal signals, such as the price breaking and staying above the long-term moving averages (Bitcoin: 50-day MA around 59,000 USDT; Ethereum: 50-day MA around 3,350 USDT).
If a “golden cross” (short-term moving average crossing above the long-term moving average) or price breaking above the Ichimoku Cloud occurs, consider mid-to-long-term buying.
Stop-loss can be set below the long-term moving averages.
Conclusion
Currently, both Bitcoin and Ethereum are in a downtrend, with a potential short-term rebound as prices approach the lower Bollinger Bands and major support levels. However, overall technical indicators suggest a bearish mid-to-long-term trend. Traders should set their entry and exit points and stop-loss levels based on specific technical signals and their risk tolerance, proceeding with caution.