Bitcoin is holding steady around $59,000–$60,000 even after a tough few weeks.
ETF outflows are slowing.
Global tensions are cooling.
Market uncertainty may be near its peak.
But this is often where opportunities appear.
Weak hands fold,
Smart hands accumulate.
What are you doing right now?
The Fear & Greed Index just hit 19
Meaning extreme fear.
You know what this means?
People are scared. They are selling.
But for you, it can mean opportunity.
When others fear, it’s a good idea to start accumulating.
We’re migrating FinSaiX to a brand-new platform
It is built to deliver a faster, smoother, and more powerful trading experience.
While this migration is underway, you can continue to access your account and all services on the current platform:
https://t.co/D0GhGvWPHJ
Thank you for your patience and support during this transition.
Exciting upgrades are on the way.
Temporary Pause for a Better Experience
FinSaiX exchange operations will be on hold for the next few days as we roll out an important upgrade.
We’re working behind the scenes to enhance performance, strengthen security, and bring you a smoother, more powerful trading experience.
What this means for you:
• Trading and exchange operations will be temporarily unavailable
• Your funds and data remain safe and secure
• Services will resume soon with improved capabilities
We appreciate your patience.
Stay tuned! We’ll be back, better than ever.
You now know:
✅ What S&R levels are
✅ How to identify strong ones
✅ Why breakouts flip resistance into support
The next step? Automation.
Join traders using structure, not guesswork. Trade Crypto on FinSaiX.
Bear markets aren’t meant to be fought.
They’re meant to be navigated.
📉 Downtrend confirmed.
⚡ Strategy decides survival.
Don’t fight the bear.
Outrun it.
The breakout rule professionals trade by:
When resistance breaks, it often becomes new support.
Example:
ETH broke above $3,800 --> price now respects $3,800--> It becomes the new support zone.
Stay tuned for the Final part: how to spot these levels automatically --> (5/5)
Support & Resistance Masterclass (3/5)
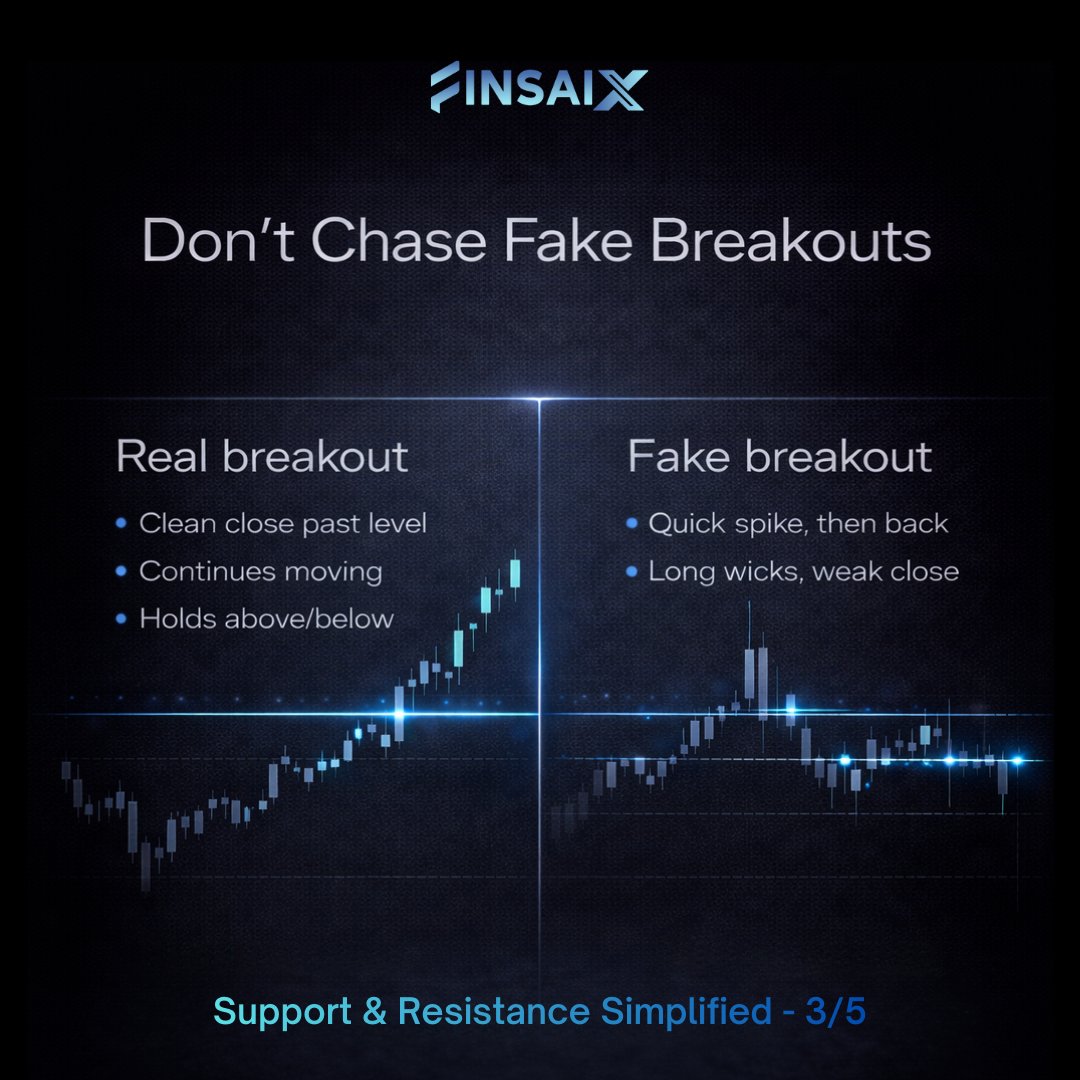
Most traders don’t lose on timing.
They lose on fake breakouts.
Don’t rush. Let price confirm.
Next: what happens after a real breakout (4/5)
Support & Resistance Masterclass ( 2/5)
How to find real S&R levels (not random lines):
1️⃣ Zoom out (daily / weekly view)
2️⃣ Mark price areas where reversals happened 2+ times
3️⃣ More touches = stronger level
Example:
BTC holding ~$96K after 3 reactions means strong support.
But here’s the part most traders miss:
Not all breakouts are equal.
Next: how to tell real breakouts from traps --> (3/5)
NEW SERIES: Support & Resistance Masterclass (Day 1/5)
Why does Bitcoin keep reacting near $88K, $94K, $100K?
Not luck. Not bots.
It’s market memory.
In this 5-part series, you’ll learn to spot key levels before most traders do.
The basics most people rush past:
• Support = where buyers step in (the floor)
• Resistance = where sellers take profit (the ceiling)
Simple definitions.
Complex consequences, especially when these levels break.
Next: how to actually find them on a chart --> (2/5)