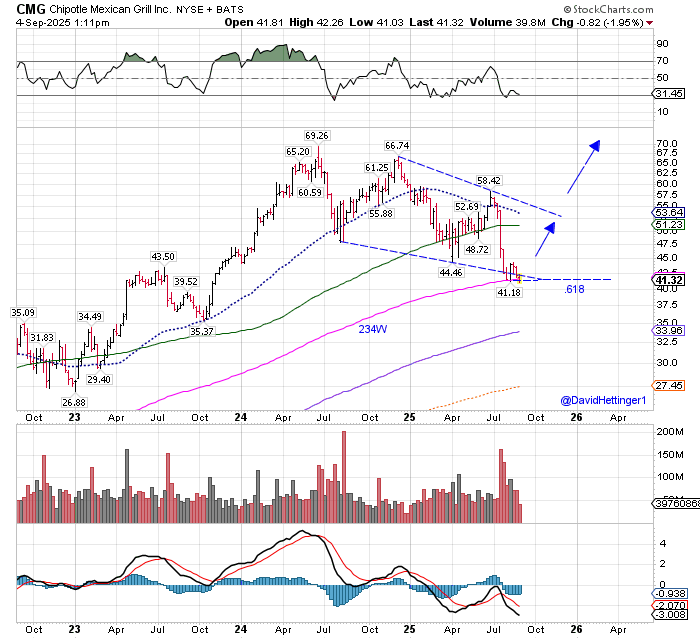
$CMG has declined in 5 waves, an A.B.C.D.E. The fact that the waves are overlapping usually means that the decline is corrective. The .618 began the day at $41.18, while the 234-week ma. comes in $41.60. Our proprietary Bottom Picker gives a range of $40.99-$42.49. We are buyers of Nov. calls and using a stop of 38.75.
$CMG has declined in 5 waves, an A.B.C.D.E. The fact that the waves are overlapping usually means that the decline is corrective. The .618 began the day at $41.18, while the 234-week ma. comes in $41.60. Our proprietary Bottom Picker gives a range of $40.99-$42.49. We are buyers of Nov. calls and using a stop of 38.75.
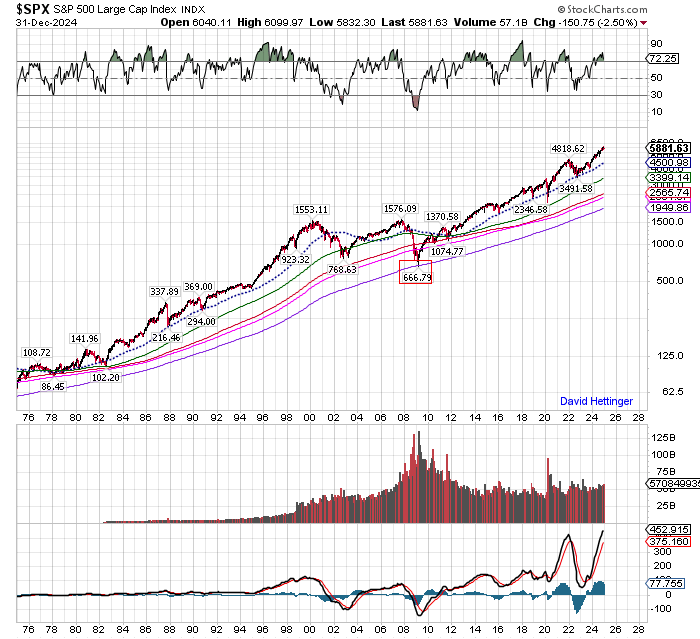
Below is a 50-year chart of the S&P(monthly). It's charts like this that helped me call the low on March 6th, 2009. Charts like this can also tell you where to add to your favorite stock or commodity. They can tell you what moving averages have worked in the past.
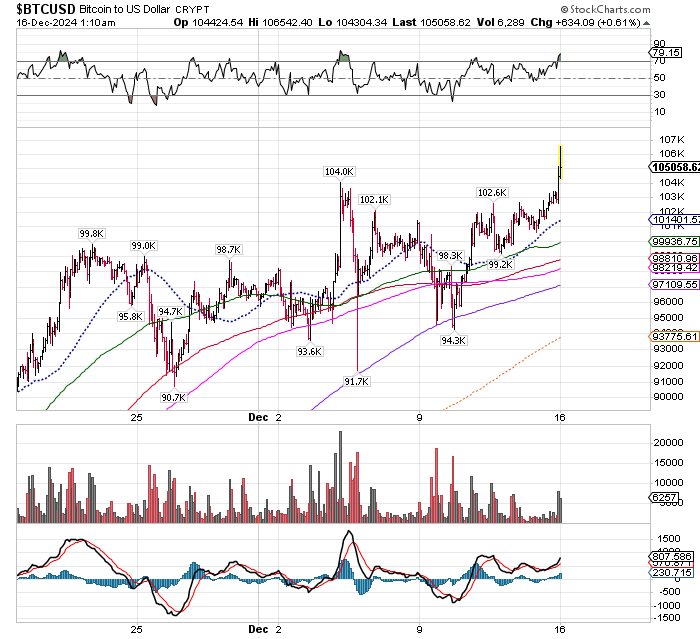
All I can say is that BTC Loves Technical Analysis!!
The Pattern over the last 3 weeks is an Expanding Wedge which suggests a further drop to ~$90,700.
The 3rd Cycle line boosted my confidence that a top was close by. I posted on X that I was flat, having been Bullish since 8/5. Shortly thereafter I bot BITI, making me effectively short BTC for the first time in my life.
This is just a trade, nothing more.
I sold my $BTCUSD shortly after the opening this a.m.
I was long from 7/5 where #BTCUSD completed a
#Bullish 3-Wave #Correction and a #BullFlag. My Gain~30%. Looking for a correction before a move to new all-time #highs in the coming months.
@DanielTNiles I bot AAPL in mid-April for the following reasons:
It bottomed on 2 of my daily ma's.
It bottomed exactly on 1 of my weekly ma's, 117-Week.
The seasonals were positive into July.
It completed a large A.B.C Correction.
And, finally, #AAPL declined in Q1 when everything else rose
#NVDA gapped to a new all-time high this am. and reversed back down thru yesterday's high and close. I call this the"Oops" trade. It is a signal to sell longs and get short. $SPX did the opposite of this trade on 10/13/22....a classic buy signal.
Thank you!!! I had my best year last year, up 575%!!! I am sure that almost no one believes me. I respect and appreciate how well you have done because I know how much hard work it takes...the hours of reading, studying, viewing chart after chart . I am beyond grateful that you
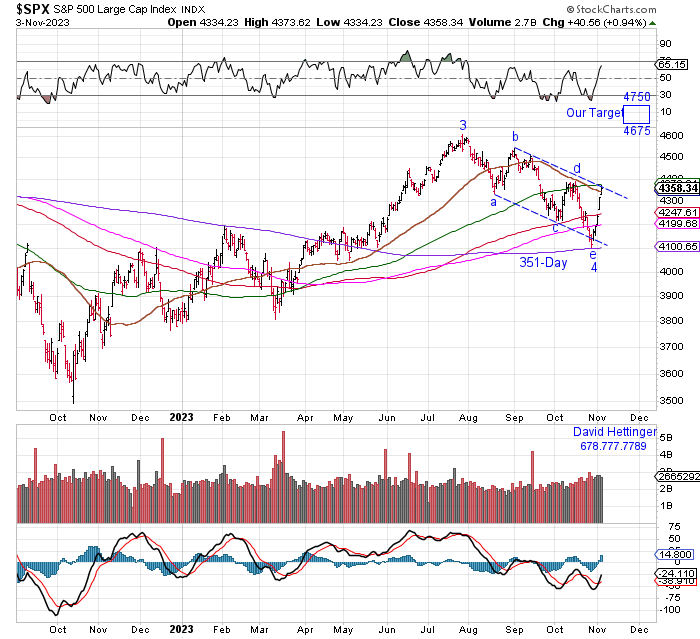
We believe that $SPX concluded an a.b.c.d.e correction to the 10/27 low and our 351-day ma.
Another October low is in place and our target is 4675-4750, which we think will be hit by mid-January at the latest. #TechnicalAnalysis#ElliottWave#Seasonals#MovingAverages
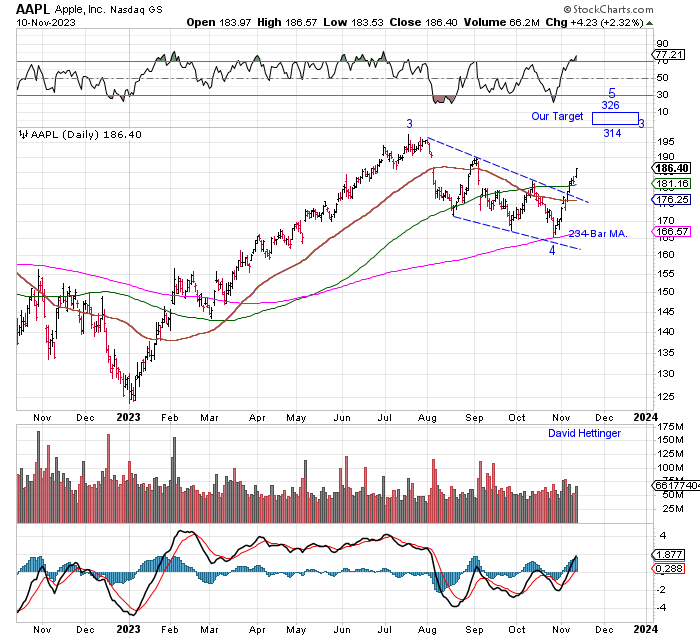
#AAPL $AAPL declined in 5 waves, unlike $TSLA which fell in 3 waves. But the sell-off was still corrective, because the waves overlapped. And it still halted it's decline right at our 234-day #MovingAverage. We are confident that $AAPL will reach our target of 314-326.
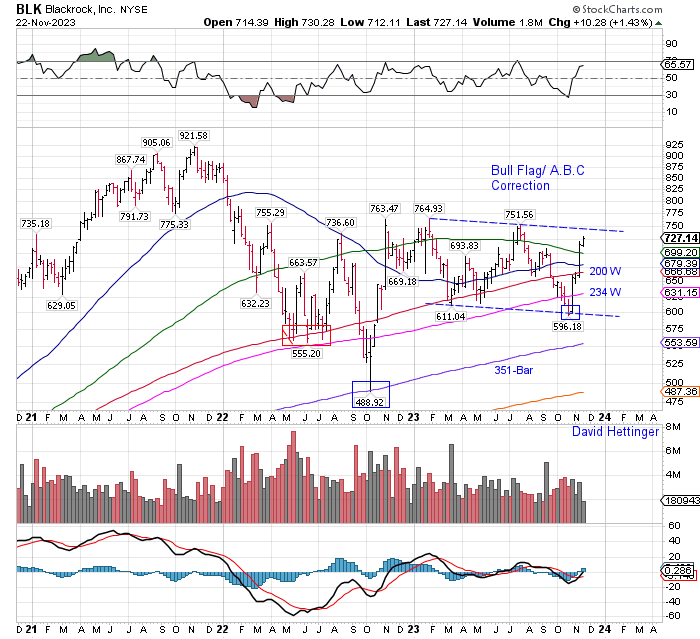
I kinda chuckled at J Lebenthal's purchase early this week of #BLK. My tools produced a Major Buy on 10/13/22 and a Strong Buy on 10/30 a month ago as it gapped from "the low close of the move'. Apparently no techies on his staff!! The A.B.C pullback below was close to perfection
Over time, the most common months for a significant bottom are October & March. Case closed. Finally, huge volume might have helped you pinpoint the 3/20 low.