This is my current take on $BTC.
Invalidation would be a sharp V-shape or a weekly close above 70. The latter takes 7 days to confirm, so I'd rather look for the first.
A sharp V-shape requires us to get way above 68-70 in the next few days.
As long as this is not the case, we're just barely holding 200W-SMA support, which is a bearish sign, because the 200W is not something you want bulls to barely defend. For a bullish bias, we need to see big reactions here.
@benjamincowen Momentum down is extremely strong and difficult to reverse.
Very high chance we will break the 200W SMA. I'm looking at a potential drop below (due to high local momentum) + failed breakout (due to swing momentum from ATH running out).
@benjamincowen Momentum down is extremely strong and difficult to reverse.
Very high chance we will break the 200W SMA. I'm looking at a potential drop below (due to high local momentum) + failed breakout (due to swing momentum from ATH running out).
$BTC key support was shattered with a strong impulse.
Now we're trading on the bearish side of the swing again. This means the risk of continuing lower has increased.
Technically, we still have a higher low right here at 65-66, but in terms of probabilities, this will be difficult to defend.
To summarize where we stand:
- Ultra long-term trend (2009-today):
still bullish, turning neutral
- Long-term trend (2025-today):
bearish (cyclical bear market)
- Current intermediate swing (Jan 26-today):
was bullish before, with a real chance to hit 90k+ ... but has now turned bearish again, with a higher chance to hit the 50ks
What we need to see to flip it bullish again:
Bulls need to get back to the level of the 100D SMA asap, which would require a quick bottom or V-shape. This would be a decent start.
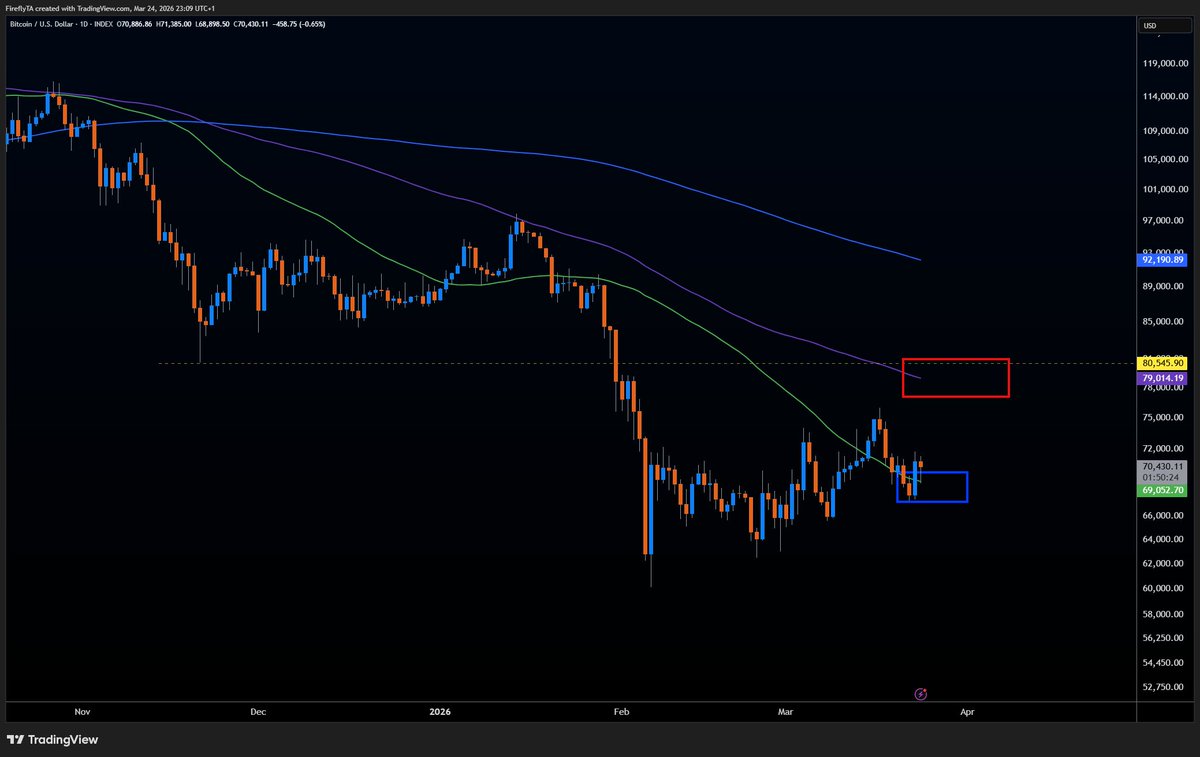
$BTC closing in on key support.
This comes after price was rejected at the 200D SMA and horizontal swing resistance.
The 100D SMA is about to break, we're already below it.
The green box is a very important key confluence level where the parallel channel and the downtrend line traverse and cross.
BEAR CASE:
A strong bearish impulse can pierce through and potentially trigger the trend to new lows.
Temporary BULL CASE:
If momentum slows down and buyers can form a bottom in this area around 68-70k, there's a good chance to approach the 200D SMA again, which is now at 79k.
$BTC
If the situation is locally bullish or bearish basically depends on this level.
If we fall back below, it's bearish. Otherwise bullish.
This level is so significant that it's not even necessary to look at anything else right now.
In 2018, I had an idea.
In 2019, I started building it.
In 2025 - 6 years later - it's done.
I spent a significant part of my life on this, probably around 10k hours in total, designing, developing and testing.
This is going to be, by a wide margin, the most sophisticated retail market analysis system I know of.
It's named Cloudy Trading System (CTS).
More about this soon.
Can't wait to show it to the world 😎
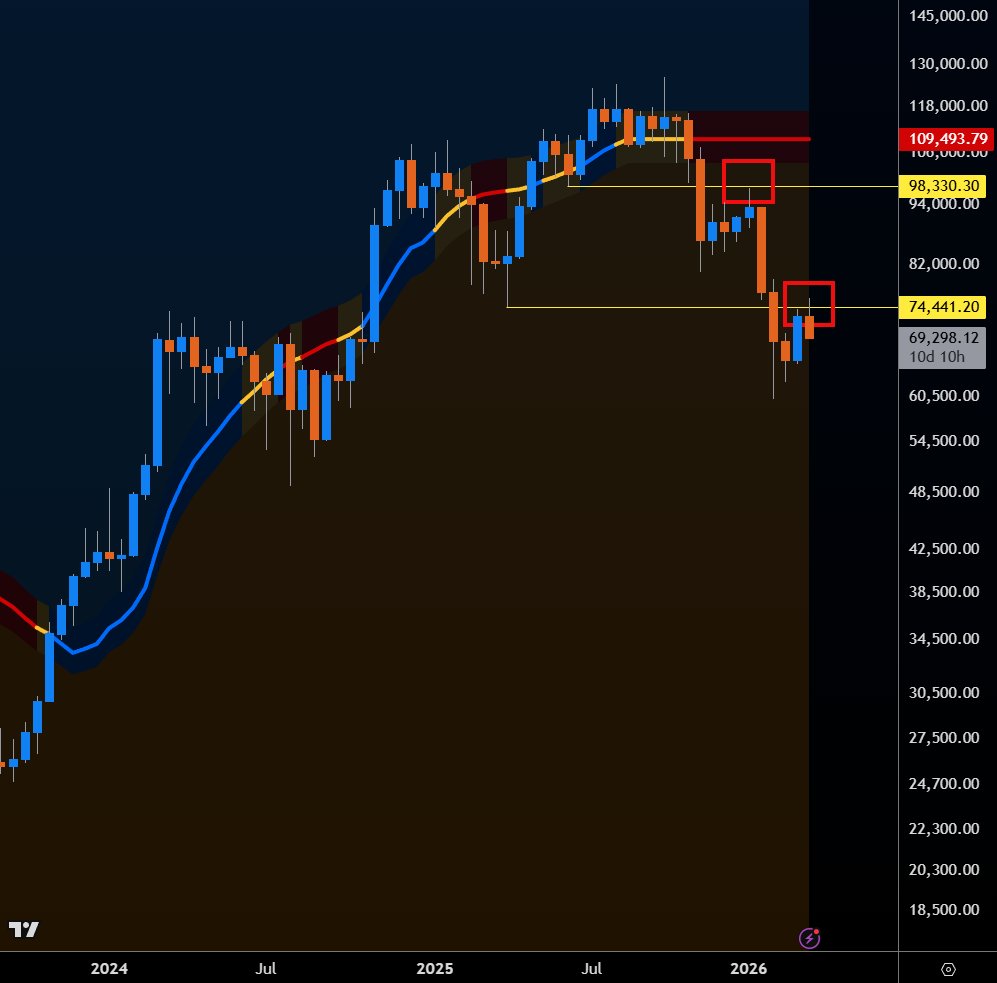
That’s a fair way to see it. What I see here is:
2019: didn't hit, bounce
2020: pierced through
2022: fell through, traded below, regained
2026: ??
The logical outcome for 2026 would be:
- price falls below
- trades below
- gets rejected (instead of regaining the level immediately)
- falls lower
- and then gets back up.
This is logical, because over time, bullish price action has become weaker (makes sense on the log chart as more capital is involved). Weaker bullish PA means price action closer to the averages up to the point where price starts hovering around them. It's a sign of macro trend shift from bull to neutral, and this is very obvious in Bitcoin.
But since nothing is set in stone and markets and their trajectories can change, if we indeed see a bullish development from this single bounce, it will give Bitcoin a much more bullish outlook for the next years. Odds are not very high, though.
$BTC trying to break bullish structure. Not confirmed yet. 200D-SMA is still a significant resistance entity.
Eyes on 80.3. Buyback above that level = bullish thesis remains intact. Some HTF closes below = situation flips bearish immediately.
bitcoin:native
83.3 acting as resistance as expected (200D-SMA). The situation is rather simple:
It's bullish as long as 80.3 holds. That's where price needs to defend its breakout above the parallel channel and the red key resistance level.
bitcoin:native
83.3 acting as resistance as expected (200D-SMA). The situation is rather simple:
It's bullish as long as 80.3 holds. That's where price needs to defend its breakout above the parallel channel and the red key resistance level.
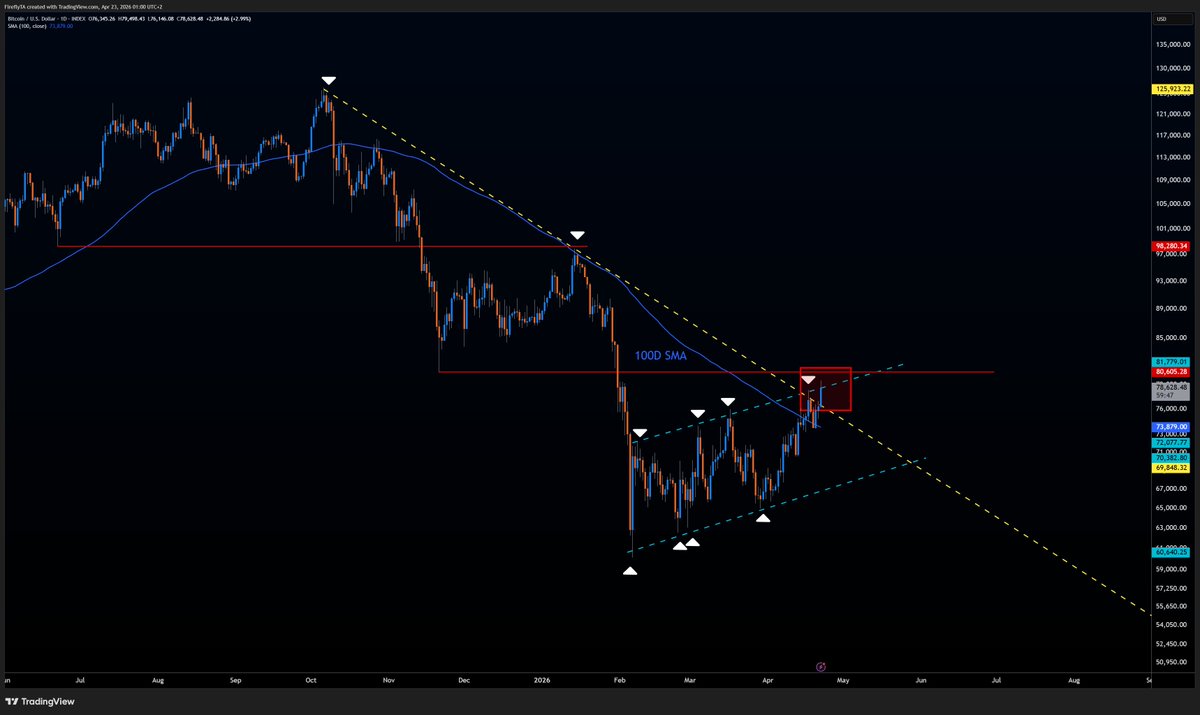
$BTC Update
We're still in the danger zone where rejection is still possible.
Fortunately for bulls, we just got a clean bullish retest of the major downtrend line (yellow). If followed through, the 80k resistance could be flipped soon.
This retest makes it easier to spot a true reversal here: If bulls don't follow through and price drops below the yellow trendline and also the blue 100D-SMA, I'd estimate the chance to approach the 60-70k region at >80%.
Failed breakouts around key resistance levels in a bear trend are extremely reliable. Same goes for failed breakouts at key support in bull trends.
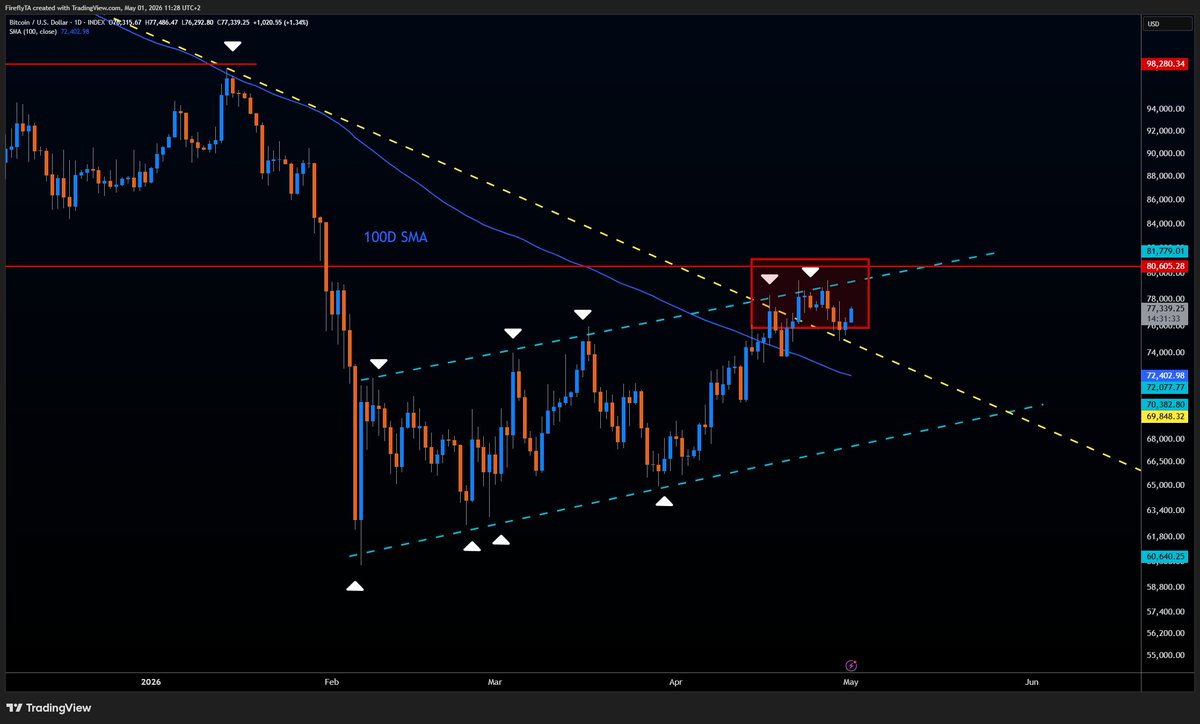
$BTC Rally ongoing.
Two things to be seen here:
1. Price is attempting a breakout:
- above the yellow downtrend line
- above the channel ceiling
- above the 100D SMA
All at the same time.
This makes the move very dangerous with a risk of rejection.
2. Price is approaching the key horizontal resistance level 80500. The same kind of resistance rejected the last bounce (first red line).
The difference is that before, in addition to the level, there was the 100D SMA acting as resistance as well. Now price has already confirmed support on the medium timeframes.
This strengthens the likeliness of breaking above the red 80k resistance and approach the 90s, but as I said, this zone up to 81k is a high-risk zone. Price could dump from here extremely fast in case bull momentum runs out.
When does the rally count as a failed one?
Look for:
1. Price falling below the yellow downtrend line again, deep into the channel
2. Sharp rejection, not a weak grind down
Interesting $BTC price action around the 50d-SMA, which could indicate a pump.
If bulls can defend this break-in and confirm the 50d🟢 as support, a move to the 100d🟣 becomes more likely.
The 100d is exactly at horizontal key resistance, forming some nice confluence at around $79,000-80,500.
This is invalidated the moment price closes daily candles below the 50d again.
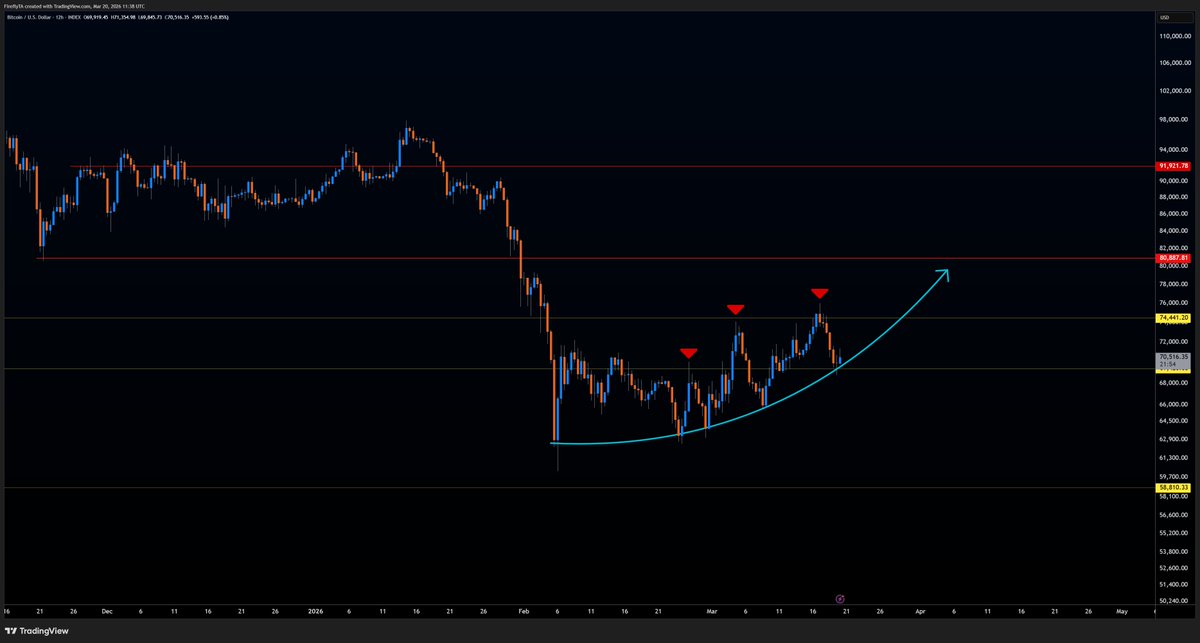
One of my favorite structures on $BTC.
I have often talked about this in the past. When price slowly builds momentum and starts following a parabolic trajectory after a major decline, the situation becomes much harder to trade.
Why?
1. The major decline causes aftershocks (lingering downside momentum), so price cannot simply lift off and reverse. Long entries can easily get caught by strong, sudden dumps like the ones marked in red. You never know whether they will break structure or maintain the parabolic trajectory.
2. A parabolic structure relies on multiple confirmations and retests of its trajectory line (here in teal) to build trust. Compounding trust fuels FOMO and draws in more traders, which accelerates upside momentum and creates the steep incline toward the end. Because trust takes time to build, traders are often late to the move.
Such situations can therefore be interpreted as both bullish and bearish, similar to how @PeterLBrandt discusses the possibility of this turning into a “horn” or bear flag.
A key indicator of the outcome is the strength and velocity of the dumps while price still respects the structure. The red arrows show violent moves rather than soft landings, which points toward a potential bearish structure break in the near future.
tl;dr - When price falls gently along the trajectory line, forming well-rounded bottoms with downside wicks (indicating buyback at key support), it is the ideal setup for a strong parabola. Violent sell-offs within the structure significantly increase risk of structure break.
$BTC
Quick Bitcoin update: We got a clean bearish retest of the first HTF key resistance level.
But: the candle hasn't closed yet. Never do analysis on unfinished candles.
However: The rejection is very sharp. Chances are high we will see a move to the range lows or new cycle lows.
This current trend is very standard for a bear market.
I'm still expecting the 40-60k range to be the most important price range for a potential bottom later this year.