This growth rate is truly astonishing! Stock tokenization is becoming increasingly prominent, and the lines between traditional finance and the crypto market may become increasingly blurred in the future🚀
Simple Bitcoin Strategy.
Buy Bitcoin when 50% of the supply is at a loss.
Sell or take profits when 90% of the supply is in profit.
I timed the exact Bitcoin bear market bottom using this indicator.
One of the few indicators who actually nailed it.
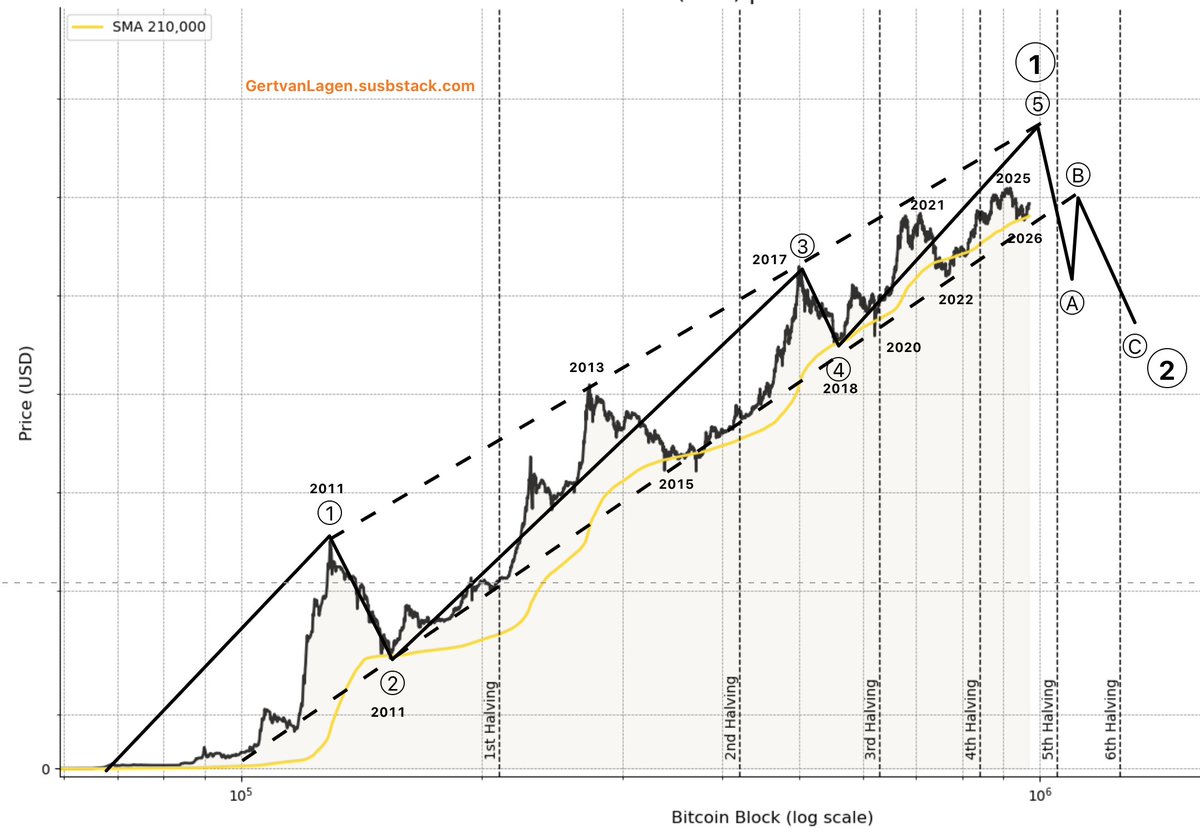
$BTC is setting up for a 2013/2017-style blow-off top, completing the final impulsive (4)–(5) advance.
2026 target: $450K–$500K, marking the pre-recession macro peak before the first true secular bear market.
1/2 $BTC [2009+] has bounced from the golden bull-market support — the 210K blocks SMA — as in 2011, 2015, 2018, 2020 & 2022.
Major wave ① nears completion, with final subwave ⑤ targeting ±$450K.
Then... followed by major wave ② correction toward sub-$3K.
$BTC IS not priced by 20M coins. It is priced by the few million that are actually for sale.
That distinction matters.
~81% of BTC hasn’t moved in 6+ months
~33% hasn’t moved in 5+ years
Only ~2.5–2.7M BTC sits on exchanges
New supply is just ~450 BTC/day
After the next halving: ~225 BTC/day
First principle:
Price is set at the margin.
If 16M coins are effectively unavailable, demand does not need to compete for 20M BTC.
It competes for the small liquid float.
And that float keeps shrinking as coins move into long-term wallets, ETFs and corporate treasuries.
That is why Bitcoin can look dead for months and then suddenly move 20%, 30%, 50%.
Adoption accumulates slowly.
Liquid supply disappears slowly.
Price adjusts suddenly.
The market keeps watching total supply.
The variable that matters is supply actually willing to sell.
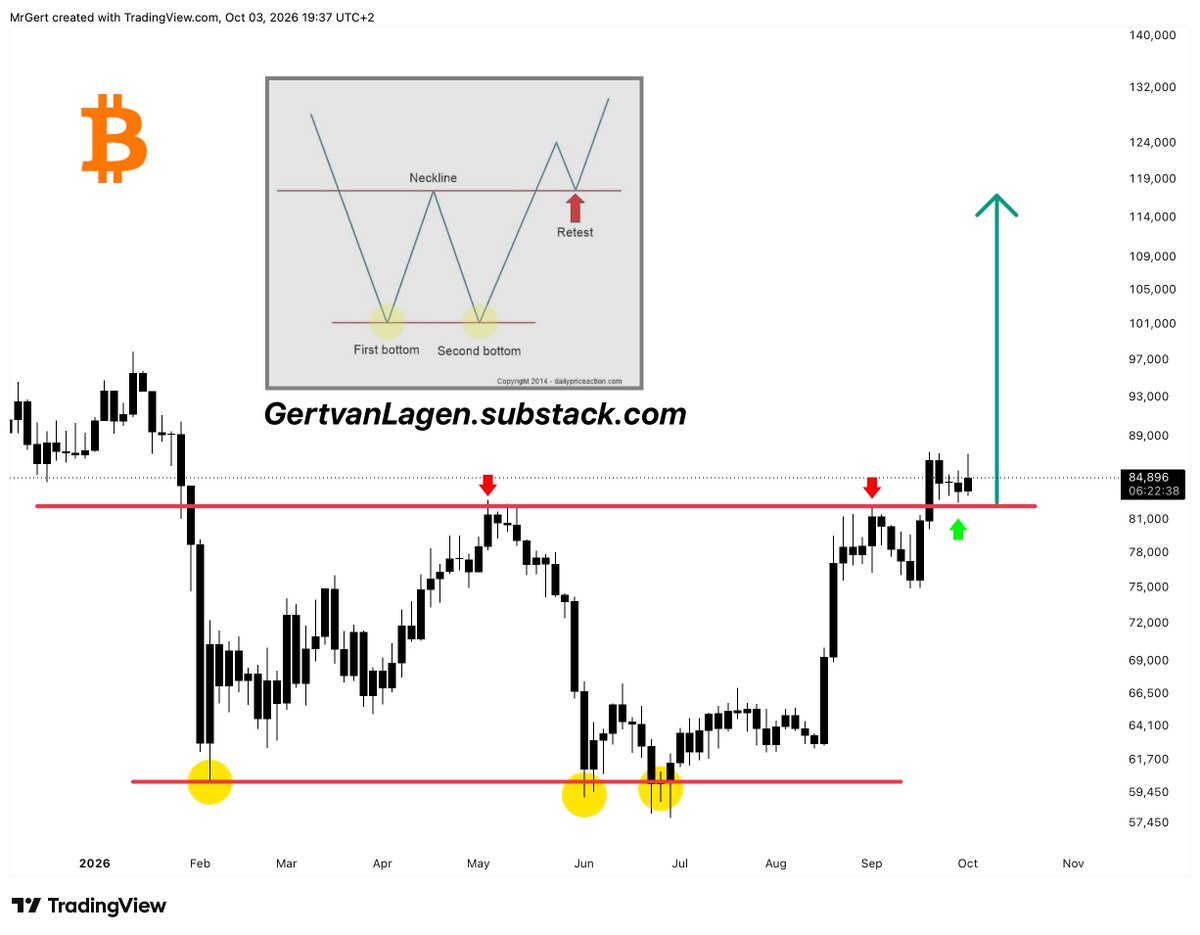
$BTC has printed a huge double bottom in 2026, targeting the ATH-zone.
Currently the neckline is being retested.
Double bottoms are known for extreme volatile continuation after breakout 🧨🧨🤞