Two things happened this week that matter more than they appear to.
1. THE RBI HELD, BUT THE INTERESTING PART WAS THE PATH
On 5 August the Monetary Policy Committee kept the repo rate unchanged at 5.25%, unanimously, with a neutral stance. Governor Sanjay Malhotra described the position as neither dovish nor hawkish.
The headline is boring. The forecast is not.
RBI now projects FY27 inflation at 5.0%, marginally lower than its earlier 5.1%. But look at the quarterly path: 5.3%, then 4.7%, then 5.9%, then 5.5%. Inflation is expected to dip, then peak in Q3, driven mainly by food and fuel. Growth was nudged up to 6.7% from 6.6%.
Why this matters when reading company results: the cost environment a business faces in October-December is likely to be harder than the one in July-September. Any company telling you today that margins have structurally improved is making a claim that gets tested in about two quarters, not two years.
Next policy meeting: 5-7 October.
2. THE EARNINGS SEASON HAS A SPLIT PERSONALITY
Over 6,000 listed companies must file June-quarter results by 14 August, and roughly 350 reported in the first week of this month.
The pattern is consistent: revenue growth is healthy, profit growth is not. Costs are absorbing the difference.
A CompoundingAI study of 379 companies above Rs 1,000 crore market capitalisation, across 13 sectors, found median profit growth of 26.5%, with all 13 sectors positive. Sounds excellent.
Inside that same aggregate: building materials grew profit by 80.5%, oil refining shrank it by 76.2%.
That is not one market. That is two markets sharing a spreadsheet.
The banking and lending data was even more instructive. Median margin improvement read as a healthy 134 basis points, but only about 17% of lenders actually expanded margins. A handful of banks were carrying the whole sector average.
WHAT WE TAKE FROM THIS
Three things the team at FolioMax will apply to every result we read for the rest of this season.
First, aggregates are actively misleading right now. When dispersion is this wide, a sector average tells you almost nothing about the company you own. A median is a statistic, not a description.
Second, revenue growth and profit growth have separated, and the separation is the story. Cummins India is this week’s clearest example. Standalone sales rose 18% to Rs 3,375 crore, domestic sales up 22% to Rs 2,854 crore. Standalone profit still fell about 8% to Rs 543 crore. Nothing went wrong operationally. Commodity costs compressed PBT margin by 70 basis points to 21.4%, and the year-ago quarter carried a Rs 44.15 crore exceptional gain that flattered the comparison. Both facts were disclosed. Neither was in the headline.
Third, check what the base was made of. Alkyl Amines reported profit up 91.4% and Balaji Amines up 97.2% on the owners’ share. Both are genuine numbers from genuinely better quarters. Both also sit on an FY26 base flattened by pharma and agrochemical destocking. A number can double because the business improved, or because the previous one was unusually poor. Only one of those repeats.
THE UNCOMFORTABLE PART
Rate stability feels like good news, and in one sense it is. But a steady policy rate does not steady input costs, and the RBI has effectively told us food and fuel pressure builds from here.
So the businesses worth studying now are the ones that can grow volume without raising price, and convert profit into actual cash. Not the ones with the largest percentage on the first line of the press release.
Reading a result properly takes longer than reading a headline about it. That gap is where most of the work lives.
We will keep doing that work. See you next week.
—
Educational content only. Not investment advice. Not SEBI registered. DYOR.
Tracking things are not time period and Tgt. Balaji Amines investors trackable things should be : (i) whether volumes recover alongside realisations, since a 22% volume decline against 63% higher pricing describes a market in transition rather than a business gaining share, and volume weakness would leave earnings fully exposed if spreads normalise; (ii) DME plant utilisation and market development for LPG blending and aerosol propellants, which is the genuine structural differentiator and where Balaji has no domestic competition; (iii) Chinese amine pricing and any renewed dumping pressure, alongside a valuation that has doubled year-to-date... As of now i am assuming NQs growth in range of 23-25% and OPM 23-24%...Valuing it on EV/Ebitda and P/E basis ...If this will held for next 2 yrs mcap can cross well above 10k, if any thing change inbetween all assumptions will change...next reveiew will be in Q2...
Dono ne Q1 FY27 mein profit lagbhag double kiya. Dono aliphatic amines banate hain. Par filings padhne pe pata chalta hai ki tareeka alag tha.
SECTOR
Amines building block chemicals hain — pharma APIs, agrochemicals, water treatment, rubber chemicals. Raw material methanol aur ammonia, dono crude-linked. FY26 slow tha; pharma aur agrochem customers destocking kar rahe the.
ALKYL AMINES:
1979 mein Yogesh Kothari ne promote ki. Reg office Vashi, Navi Mumbai. Ek hi segment: “Speciality Segment”
Q1 FY27:
Revenue Rs 528.01 cr vs Rs 405.53 cr — 30.2% up; QoQ Rs 386.91 cr se 36.5% up
PAT Rs 94.63 cr vs Rs 49.44 cr — 91.4% up
EPS Rs 18.50 vs Rs 9.67
EBITDA margin 18.9% se 25.3%
Ek trap dekhiye. Cost of materials Rs 218.31 cr se Rs 316.09 cr — 44.8% up, revenue se tez. usi filing mein “changes in inventories” line Rs 48.04 cr ki hai, yani utna material inventory mein gaya, bika nahi. Dono milakar net material cost revenue ka 54.2% se ghat kar 50.8% ho gaya.
Asli leverage other expenses mein hai — Rs 81.82 cr se Rs 90.05 cr, sirf 10% up jabki revenue 30% up. Other income mamooli hai (Rs 9.30 cr). Profit plant se aaya.
BALAJI AMINES :
1988 se, Solapur. MD D. Ram Reddy. Ek subsidiary — Balaji Speciality Chemicals. Do segments: Amines & Speciality Chemicals, aur ek Hotel Division.
Q1 FY27 (consolidated):
Revenue Rs 455.93 cr vs Rs 358.34 cr — 27.2% up; QoQ Rs 394.79 cr se 15.5% up
PBT Rs 106.20 cr vs Rs 49.01 cr
EBITDA margin 15.3% se 25.4% — ~1,015 bps
EPS Rs 23.13 vs Rs 11.73
Yahan PAT do jagah; Group ka total PAT Rs 78.12 cr hai; usme se Rs 3.18 cr non-controlling interests ka, yani subsidiary ke minority shareholders ka. Aapka hissa Rs 74.94 cr, vs pichle saal Rs 38.00 cr.
Twist: pichle saal NCI minus Rs 1.47 cr tha. Subsidiary loss mein thi, isliye owners ka share group total se zyada dikh raha tha. Ab woh loss profit ban chuki hai.
Balaji ka margin driver bhi other expenses hai — Rs 71.16 cr se Rs 61.24 cr, absolute terms mein 14% KAM, jabki revenue 27% badha.
CONCERNS
1.Base. Dono ke 90%+ jumps ek kamzor FY26 base pe hain. Woh base normal nahi tha.
2.Input volatility. Methanol aur ammonia crude-linked hain. Aaj ka spread permanent nahi. China ki dumping wapas aayi toh yeh domestic duopoly turant test hogi.
3.Balaji ka Hotel Division. Segment revenue Rs 10.27 cr se ghat kar Rs 7.99 cr, segment PBT Rs 3.84 cr se Rs 1.54 cr — 60% neeche. Rs 63.15 cr ke assets us par lage hain. Chemicals company ke liye structural sawaal.
4.Alkyl mein succession. 1 October 2026 se Yogesh Kothari (77) Executive Chairman, aur Kirat Patel (73) tatha Suneet Kothari (50) Joint MD. Suneet, Yogesh ke bete hain. Non-executive directors ko net profit ka 1% tak commission ka proposal bhi hai, April 2027 se 5 saal. Sab postal ballot pe.
5.Alkyl ki filing mein disclosure hai ki Executive Director-Operations Rakesh Goyal ke khilaf unke pichle employer National Peroxide ne criminal aur civil case file kiya tha, financial irregularities ke aarop mein. Matter sub-judice hai. Filing yeh bhi kehti hai ki koi director SEBI ya kisi regulator dwara debarred nahi hai. Yeh aarop hai, faisla nahi.
6.Alkyl ka Q1 PAT Rs 94.63 cr hai, jabki poore FY26 ka PAT Rs 180 cr tha. Ek quarter mein aadha saal — repeat hona zaroori nahi.
AAGE KYA
Balaji ki investor presentation ke mutabik 1,00,000 TPA DME plant May 2026 se commercial hua, aur FY27 ka target 20-30% volume growth hai — DME, acetonitrile aur NMM se. Rs 750 cr ka phased expansion subsidiary mein chal raha hai. Results filing mein guidance nahi hai.
Alkyl ne koi public guidance nahi di. Uska board abhi succession pe kaam kar raha hai.
Dono ka model alag hai. Alkyl depth bech rahi hai — ek business, koi subsidiary nahi. Balaji width bech rahi hai — naye molecules, naya fuel, ek subsidiary aur ek hotel.
Q1 dono ke liye achha tha. Asli sawaal tab pata chalega jab base normal ho jaayega.
—
Educational purpose only. Not investment advice. Not SEBI registered. DYOR.
Aapki SUV ka alloy wheel dhyaan se dekhiye. Woh chamakta hua piece sirf design nahi hai — usme casting, heat treatment, machining aur balancing ki poori engineering chhupi hai. India mein yeh banane wale gine-chune players hain. Unme se ek hai Enkei Wheels.
COMPANY
Enkei Wheels (India) Ltd (BSE: 533477) aluminium alloy wheel manufacturer hai. Plant aur registered office dono Shikrapur, Tal. Shirur, Pune mein. Company 2009 mein Enkei Castalloy (aaj ki Alicon Castalloy) ke demerger se bani. Promoter hai Enkei Corporation, Japan — 1950 se Hamamatsu mein, F1 aur Super GT motorsport mein decades ka naam. Promoter holding ~74.97%. MD: Kenjiro Hama.
BUSINESS AUR MOAT
Ek hi operating segment — “Automotive Wheels”. 2-wheeler aur 4-wheeler dono ke liye alloy wheels, mostly OEM supply. Moat teen jagah se: Japanese parent se technology transfer (casting process, dies, quality systems); OEM approval cycle jo saalon mein clear hota hai aur uske baad model ki poori life tak supply chalti hai; aur Pune auto cluster mein plant.
Note: is company ka financial year Jan-Dec chalta hai. Toh 30 June 2026 wali quarter iski Q2 hai, Q1 nahi.
QUARTER ENDED 30 JUNE 2026
Revenue: Rs 319.03 cr vs Rs 233.16 cr — 36.8% up YoY, 6.7% up QoQ
PAT: Rs 10.25 cr vs pichle saal Rs 1.71 cr ka loss
EPS: Rs 5.70 vs Rs (0.95)
H1: Revenue Rs 618.09 cr vs Rs 461.14 cr; PAT Rs 9.64 cr vs Rs 7.01 cr ka loss
Ab “why”, kyunki number se zyada uski wajah important hai. Other income ulta GIRA hai — Rs 2.08 cr se Rs 0.20 cr. Yani profit treasury gain ya one-off se nahi, plant se aaya. EBITDA margin ~7.2% se ~10.7%.
Kaise? Operating leverage. Stores & spares Rs 17.80 cr se ghat kar Rs 14.01 cr — 37% zyada revenue pe absolute cost kam. Other expenses Rs 53.05 cr se Rs 51.24 cr. Employee cost revenue ka 5.85% se 4.61%. Fixed cost same, volume badha, margin nikal aaya.
Ek cheez ulti bhi gayi: material cost revenue ka ~56.5% se ~64.2% ho gaya. Raw material side pe pressure hai.
CONCERNS —
https://t.co/KrmGEe7sQ3 flow. PAT positive hai, lekin H1 mein operations se Rs 53.86 cr cash BAHAR gaya — pichle saal isi period mein Rs 43.70 cr andar aaya tha.
2.Wajah working capital hai. Receivables Rs 123.59 cr se Rs 182.19 cr (+47%) jabki revenue 34% badha. Payables Rs 102.18 cr se Rs 56.04 cr — suppliers ko pehle se jaldi pay ho raha hai. Dono milakar lagbhag Rs 105 cr ka drain.
3.Debt. Borrowings 6 mahine mein Rs 210.04 cr se Rs 307.19 cr — 46% up. Debt-to-equity 0.88x se 1.23x. Yeh meaningful deterioration hai.
https://t.co/q0fpeb7inl cost dhoka de sakta hai. Quarter mein Rs 5.76 cr vs Rs 6.14 cr — debt badhne ke bawajood kam. Note 7 padhiye: H1 mein Rs 3.36 cr ke forex gains interest ke against adjust hue (pichle saal Rs 0.87 cr). Raahat currency se aayi, sasti borrowing se nahi.
5.Capex vs depreciation. H1 depreciation Rs 29.38 cr, capex sirf Rs 11.10 cr. PPE Rs 323.31 cr se ghat kar Rs 305.77 cr. Assets sweat ho rahe hain — abhi theek, par volume aise hi badha toh capacity ka sawaal aayega.
6.Concentration. Ek product, ek segment, ek country, handful OEM customers.
7.Track record. CY2025 poore saal ka PAT sirf Rs 5.13 cr tha, Rs 971.63 cr revenue pe — aur usme New Labour Code ke wage definition change ka Rs 4.58 cr exceptional charge bhi tha. Ek achhi quarter trend nahi hoti.
AAGE KYA
Structurally: India mein SUV mix badh raha hai, aur SUV matlab bada diameter wheel, zyada alloy penetration, per-wheel realisation zyada.
Track karne wali cheezein: operating cash flow wapas positive hota hai ya nahi, receivables normalise hote hain ya nahi, double-digit EBITDA margin repeat hoti hai ya nahi, aur debt yahin rukta hai ya nahi.
Yeh quarter ek genuine operational turnaround dikhata hai — profit other income se nahi, factory se aaya. Par balance sheet aur cash flow us turnaround ke saath abhi chale nahi hain.
Jab company tez badhti hai, working capital sabse pehle bolta hai. Yahan woh bol raha hai.
—
Educational purpose only. Not investment advice. Not SEBI registered. DYOR.
Patience is the only edge that cannot be arbitraged away.
Everyone has the same screener. Everyone reads the same filings. Everyone sees the same results on the same day.
The one advantage nobody can copy from you is your willingness to wait.
A good business does not become great because you found it. It becomes great because it kept doing ordinary things well, for longer than most people were willing to watch.
Ek hi quarter, do alag profit numbers: 44.75 crore aur 29.3 crore.
Dono sahi hain. Aur inke beech ka farq hi is company ko samajhne ki chaabi hai.
KDDL Limited
NSE: KDDL | BSE: 532054
HQ: Chandigarh | 1983 se
Chairman: Yashovardhan Saboo
Karti kya hai?
Pehla business — manufacturing. Ghadi ke parts: dial, hands (sui), indexes, bracelets — Swiss aur global luxury brands ko supply. Saath mein precision engineering: aerospace, defence, EV, medical devices ke parts.
Doosra — retail. Ethos, India ki sabse badi luxury watch retail chain.
Teesra, naya — Silvercity, Swiss subsidiary, jisne purana brand Favre Leuba khareeda hai.
Ab wo do numbers
Ethos alag se listed hai (NSE: ETHOSLTD). KDDL uski majority owner hai, par 100% owner nahi.
Accounting ka rule: majority owner ho toh uska poora revenue aur profit apni books mein dikhana padta hai. Phir jo hissa doosron ka hai use alag ghata dete hain — “minority interest”.
Isliye:
44.75 Cr = poore group ka profit
29.3 Cr = usme se jo KDDL ke shareholders ka hai
Beech ka ~15 Cr Ethos ke doosre shareholders ka hai. Matlab KDDL shareholder ka hissa 29.3 se juda hai, 44.75 se nahi.
Q1 FY27 (consolidated, ₹ Cr)
Revenue: 633.8 vs 465.0 = +36.3%
EBITDA: 95.2 vs 68.4 = +39.2% | margin 15.03% vs 14.72%
Profit (total): 44.75 | KDDL shareholders ka: 29.3 vs 20.4 = +43.6%
Gaur karne layak: revenue 36% badha, par EBITDA margin sirf 31 basis points — 14.72% se 15.03%.
Matlab growth volume se aayi, efficiency se nahi. Zyada becha, par har rupaye par pehle jitna hi kamaya.
Moat kahan hai?
Manufacturing side par. Swiss luxury brands apna dial supplier aasani se nahi badalte — tolerance bahut tight hota hai aur approval mein saal lagte hain. KDDL 30 saal se ye kaam kar rahi hai.
Retail par moat alag hai — exclusive dealership aur showroom location.
Premiumisation — asli theme yahi hai
KDDL premiumisation ka seedha khiladi hai — dono taraf se.
Retail par: India mein log ab ghadi zaroorat ke liye nahi, pehchaan ke liye khareed rahe hain. Jo pehle 20,000 ki ghadi leta tha, wo ab 2 lakh ki soch raha hai. Ethos usi upar wale hisse mein khada hai.
Manufacturing par: KDDL ka dial mass-market ghadi mein nahi jaata. Wo Swiss aur global premium brands ko jaata hai.
Aur Favre Leuba isi soch ka agla kadam hai — component banane se aage badhkar apna brand khada karna, jahan margin sabse zyada hoti hai.
Honest concerns
1. Ye ab mainly retail company hai. Revenue ka bada hissa Ethos se. Luxury retail mein inventory bhaari, rent bhaari, margin patli. 15% EBITDA margin isi wajah se.
2. Profit ka teesra hissa aapka nahi. Jab bhi koi “KDDL ka profit 44 crore” kahe, ye yaad rakhiye.
3. Ethos alag se listed hai. Sirf luxury retail chahiye toh wo seedha mil sakta hai. KDDL matlab retail + manufacturing dono, aur ek holding structure bhi.
4. Premiumisation cyclical bhi hai. Ghadi zaroorat nahi, shauk hai. Economy dheemi padi toh sabse pehle asar isi kharidari par padta hai. Theme lambi hai, par raasta seedha nahi.
5. Do board members ek mahine mein gaye. Ek independent director ka term poora hua (27 July 2026), ek non-executive director ne personal time ki wajah se resign kiya (22 June 2026).
6. Favre Leuba abhi saabit nahi hua. Purane Swiss brand ko dobara khada karna mehnga aur lamba kaam hai. Paisa lag raha hai, revenue abhi nahi aa raha.
7. Segment-wise Q1 numbers abhi nahi mile. Manufacturing aur retail alag-alag kaisa chala, ye concall se pata chalega.
Bottom line: 40 saal se ek company chupchaap Swiss brands ko dial bech rahi thi. Aaj wo India ki sabse badi luxury watch chain bhi chalati hai, aur apna Swiss brand bhi khada kar rahi hai.
Component banane wale se brand banane wale tak ka safar — ye India ki premiumisation story theme hai
Number kiska hai, ye poochna zaroori hai. Par kahani kahan ja rahi hai, ye dekhna usse bhi zyada zaroori hai.
#KDDL #Premiumisation #LuxuryRetail #FolioMax
Not SEBI Registered. Not Advice. DYOR.
Working capital 190 din se 143 din par aa jaaye — achhi khabar hai.
Par concall mein CEO ne bataya ye kyun hua. Aur wajah wo nahi thi jo aap sochenge.
Pehle poori kahani, phir wo baat.
Yasho Industries Limited
NSE: YASHO | BSE: 541167
HQ: Mumbai | MD & CEO: Parag Jhaveri | CFO: Chirag Shah
Karti kya hai?
Yasho specialty chemicals banati hai — jo doosri companies apne products mein daalti hain:
Aroma chemicals — perfume, sabun, detergent ki khushboo
Food antioxidants — packaged food jaldi kharab na ho
Lubricant additives — engine oil ke liye
Rubber chemicals — tyre aur rubber ke liye
Naam kisi packet par nahi dikhega, par maal aapke ghar ke kai saamaan mein hai.
69% revenue export se. Industrial chemicals bada hissa hain, aur management kehta hai ye ~90% tak ja sakta hai.
Q1 FY27 (consolidated, ₹ Cr)
Revenue: 307.7 vs 198.6 = +54.9% | QoQ +25%
EBITDA: 74.4 = +127.6% | margin 24.2% (pehle ~17%)
PAT: 36.05 vs 3.64 | Volume growth: 42%
Margin itna kyun sudhra?
Management ne teen wajah batayi, aur teeno logical hain:
1. Plant zyada bhar gaya. Utilisation ~50% se 60-65% par, target 70-75%. Plant zyada chale toh per-unit cost girta hai.
2. Naye product behtar hain. Pichhle 12 mahine ke naye products purane se 10-12% behtar margin dete hain.
3. Contract badal gaye. Pehle 30-40% business long-term pricing par tha, ab 50%+. In contracts mein price formula se tay hota hai, market se nahi — raw material mehnga hua toh customer se automatically zyada milta hai.
CEO ne kaha wo FY27 mein ye margin bana ke rakhna chahte hain.
Sabse badi khabar: capex double
FY27 ka planned capex 125 Cr se badha kar 250 Cr kar diya gaya hai.
Pakajan facility mein do building — Phase 1 (~100 Cr) Q1 FY28 tak, Phase 2 (~150 Cr) Q4 FY28 tak. Iske liye ~100 Cr ka aur karza lene ka plan hai.
Revenue target bhi 1,600 Cr se zyada kar diya gaya — aur ye nayi buildings ka revenue jode bina. Management ne khud kaha asli growth FY29 se aayegi.
Balance sheet mazboot hui
CRISIL aur ICRA dono ne rating BBB+ se A- kar di. Net debt to EBITDA 3.75x (Q4 FY26) se ghatkar 1.86x. Ye asli sudhaar hai.
Ab wo baat — working capital
Working capital 190 din se 143 din par aaya. Kaagaz par shandaar.
Par CEO ne concall mein khud maana: inventory isliye kam hui kyunki raw material mein “genuine supply issue” tha. Container booking ka bhi problem — kabhi 3-4 hafte intezaar, kabhi booking milti hi nahi.
Matlab inventory efficiency se nahi giri — isliye giri kyunki maal aa hi nahi raha tha.
Demand mazboot hai, par supply chain kaanp rahi hai.
Honest concerns
1. Working capital ka sudhaar poora asli nahi. Supply normal hui toh inventory wapas badhegi, aur 143 din ka number upar ja sakta hai.
2. Base effect. PAT 3.64 Cr se 36 Cr. Par pichhle saal ka base lagbhag zero jaisa tha. Agle saal ye percentage apne aap chhota dikhega.
3. Nayi capacity ka 35-40% customer abhi nahi mila. CEO ke shabdon mein — “up to 60-65 percent we have customers, balance we need to search.” Yaani 250 Cr ka capex ho raha hai jiska ek-tihai demand tay nahi.
4. Karza badhega. 100 Cr ka naya borrowing plan hai. Abhi 1.86x comfortable hai, par expansion mein dobara chadh sakta hai.
5. Concentration badh rahi hai, ghat nahi. Industrial chemicals ~90% tak, export 70-75% par. Dono jagah nirbharta badh rahi.
6. Faayda door hai. Phase 1 Q1 FY28, Phase 2 Q4 FY28, aur management ke apne shabdon mein material growth FY29 se. Aaj kharcha, kamai 3 saal baad.
Bottom line
Yasho ka margin sudhaar structural lagta hai — utilisation, product mix aur long-term contracts, teeno asli levers hain. Rating upgrade aur 1.86x leverage bhi asli.
Par do baatein yaad rakhiye. Working capital ka sudhaar aadha supply ki majboori se aaya. Aur 250 Cr capex ka ek-tihai hissa abhi customer dhoondh raha hai.
#YashoIndustries #SpecialtyChemicals #FolioMax
Not SEBI Registered. Not Advice. DYOR.
₹9 crore. 1,217 crore revenue wali company ke liye ye kuch bhi nahi.
But, Ather Energy ke liye ye pehli baar hai. Aur pehli baar maayne rakhti hai — bas utni nahi jitni log samajh lete hain.
Ather Energy Limited
NSE: ATHERENERG | BSE: 544397
HQ: Bengaluru | 2013 se
Co-founder & CEO: Tarun Mehta | Co-founder: Swapnil Jain
Business
Ather electric scooters banati hai — 450 series aur Rizta, total 9 variants.
Par sirf scooter bechna iska poora business nahi. Software (AtherStack), charging network, accessories aur services — ye “non-vehicle” business ab operating revenue ka 14% hai, aur AtherStack Pro ka attach rate 94%. Company khud ko manufacturer nahi, ecosystem maanti hai.
Q1 FY27 (₹ Cr)
Revenue from operations: 1,216.9 vs 644.6 = +88.8% YoY | QoQ +3.6%
Total income: 1,260 vs 673 = +87.2%
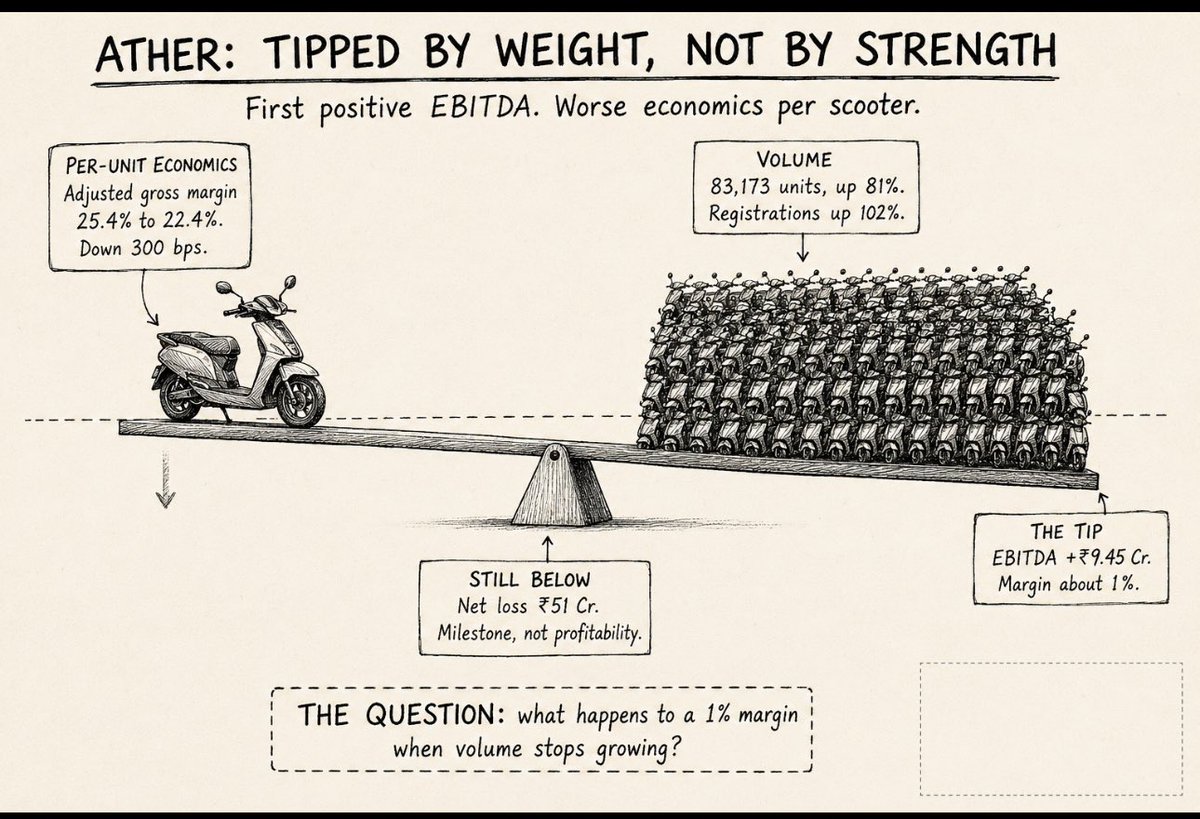
EBITDA: +9.45 vs -105.97 = pehli baar positive | margin ~1% vs -16%
Net loss: 51.1 vs 178.2 = 71% kam
Wholesale volume: 83,173 units = +81%
Registrations: 90,808 units = +102%
ASP: ₹1.61 lakh (pichhle quarter ~1.50 lakh)
Dealer inventory: 3 days, earlier 14 days
Worth to be noted: registrations wholesale se tez badhe — lagatar chauthe quarter. Matlab dealer ka stock nikal raha hai, asli customer demand hai.
Industry ka context
E2W registrations industry-wide +68% YoY. EV penetration total two-wheeler market ka 11% — pehli baar 10% paar. Scooters mein 25% se upar. Ather ke apne numbers: enquiries +95%, pre-orders +158%.
Geography mein dilchasp baat — Middle India retail +141%, rest of India +118%, South India +76%. Tier 2 aur tier 3 shehron mein growth engine shift ho raha hai.
Ab asli sawaal: ye EBITDA positive aaya kahan se?
Adjusted gross margin is quarter mein 25.4% se GIRKAR 22.4% ho gaya — poore 300 bps, commodity aur input cost badhne se.
Matlab per-scooter economics kharab hui hai, behtar nahi.
Toh EBITDA positive kaise hua? Volume se. 83,000 units par fixed cost bant gaya. Operating leverage ne wo kaam kiya jo unit economics nahi kar payi.
Ye buri baat nahi — scale ka yahi matlab hai. Par farq samajhiye: ye margin expansion nahi, volume ka asar hai. Volume ruka toh 1% margin turant wapas negative.
Future plan
Factory 3.0, AURIC (Chhatrapati Sambhaji Nagar) mein — production Q3 FY27 se, phase 1 capacity 5 lakh units saalana, lambe samay ka target 10 lakh. Naye EL platform ka pehla production scooter 29 August 2026 ko.
Honest concerns
1. Company abhi bhi loss mein hai. 51 Cr ka net loss chhota nahi. EBITDA positive milestone hai, profitability nahi — depreciation aur interest ke baad tasveer alag hai.
2. 1% margin par koi cushion nahi. Ek quarter mein commodity aur mehnga hua, ya volume flat raha — aur ye number wapas negative. Itni patli margin ko “turnaround” kehna jaldbaazi hogi.
3. Dilution lagatar ho rahi hai. 1,300 Cr ka QIP, 1,200 Cr ka preferential issue (jisme Hero MotoCorp 960 Cr), aur 14 August ki EGM mein 1,199 Cr aur uthane ka proposal. Growth funding zaroori hai, par har round mein purane shareholder ka hissa ghatta hai.
4. Supply demand se peeche hai. Management ne khud kaha demand supply se aage nikal gayi. Dealer inventory 3 din par. Ye demand ka signal hai, par saath mein ye bhi ki bikri ka mauka nikal raha hai jab tak Factory 3.0 nahi aata.
5. Competition tez hai. TVS, Bajaj, Ola Electric, aur Hero MotoCorp — jo investor bhi hai aur competitor bhi. Ye rishta aage dekhne layak hai.
6. Policy par nirbharta. EV penetration ka growth policy support se juda hai. Policy badli toh demand curve badlegi.
Bottom line
Ather ne ek asli threshold paar kiya. 83,000 scooters bechna, retail ka wholesale se tez badhna, tier 2-3 mein growth shift — ye sab real hai.
Par is quarter mein per-scooter economics kharab hui, aur EBITDA sirf volume ke dam par positive hua.
Pehla positive quarter aur consistent profitability — do alag manzilein hain. Beech ka raasta lamba hai.
#AtherEnergy #EV #ElectricVehicles #FolioMax
Not SEBI Registered. Not Advice. DYOR.
Aaj se India ka market band hone ka tarika badal gaya hai.
3 August 2026 se SEBI ka Closing Auction Session (CAS) live ho gaya hai. Zyadatar log isko sirf “timing change” samajh rahe hain. Ye usse kaafi bada hai.
Pehle kya hota tha
Kisi stock ka closing price uske aakhri 30 minute (3:00–3:30 PM) ke saare trades ka volume-weighted average hota tha. Yaani VWAP.
Problem ye thi ki us aakhri window mein concentrated trading se average ko hilaya ja sakta tha. SEBI ne apne January 2026 circular mein maqsad saaf likha — “a more robust and manipulation-resistant closing price discovery mechanism.”
Ab kya hoga
CAS ek alag session hai, 3:15 se 3:35 PM tak, F&O-eligible stocks ke liye.
Is session mein orders turant execute nahi hote. Pehle saare buy aur sell orders collect hote hain, phir ek single equilibrium price nikala jaata hai — wo price jahan maximum quantity match ho sakti hai.
Matlab closing price ab kai trades ka average nahi hai. Ye wo ek price hai jahan market sach mein clear hota hai.
Mechanics jo jaanna zaroori hai
Reference price: 3:00–3:15 PM ke trades ka VWAP
Price band: reference price se +/- 3%
Order types: sirf limit aur market orders. Stop loss aur iceberg orders allowed nahi hain.
Market Price Protection is session mein applicable nahi hai
Timings ab teen alag hain:
CAS stocks: continuous trading 3:15 PM par khatam
Non-CAS stocks: 3:30 PM tak normal
Equity derivatives: 3:40 PM tak
Ye sirf traders ka mamla nahi hai
Closing price ka use kahan-kahan hota hai, ye dekhiye:
Derivatives settlement
Index calculation
ETF rebalancing
Mutual fund NAV
Yaani agar aap ek bhi index fund ya ETF rakhte hain, toh aapki NAV ab ek naye mechanism se nikle price par bani hai. Aapne koi order nahi diya, phir bhi ye aap par lagu hai.
India ab global practice ke saath hai
NYSE, London Stock Exchange, Euronext, Hong Kong Exchange, ASX — Nasdaq, SGX — ye sab pehle se closing auction use karte hain. India un badi markets mein se tha jo abhi tak simple average par tikka hua tha.
Aage aur badlega
Usi SEBI circular ke tehat morning pre-open session bhi 7 September 2026 se restructure hoga. Tab opening aur closing, dono ki price discovery ek jaise tareeke se kaam karegi.
Auction mechanism concentrated last-minute trading ka asar kam karta hai, ye sach hai. Par auction ke apne pattern hote hain — order imbalance, aur us 20-minute window mein liquidity ka behaviour. Global markets mein closing auction ab din ka sabse bada volume event ban chuka hai.
Naya system purane se behtar design hai. Par ye system ko badalta hai, insaan ki neeyat ko nahi.
Investor ke liye matlab
Agar aap long-term investor hain aur closing ke aas-paas order nahi dete, toh aapke liye seedha kuch nahi badla.
Par ek cheez samajh lijiye: market ka infrastructure chup-chaap badalta rehta hai, aur zyadatar log tab tak dhyan nahi dete jab tak koi order unexpected price par execute na ho jaaye.
#SEBI #StockMarketIndia #CAS #FolioMax
Not SEBI Registered. Not Advice. Educational only. DYOR.
Profit 5x isliye jump hua kyunki maize sasta mila — ye spread ka fayda hai, company ki koi nayi capability nahi. Market ise cyclical maan raha hai, peak earnings pe multiple nahi deta, isliye 172% profit growth pe bhi sirf 2% move aur ₹180.90 ka gap sell ho gaya.
Bade volume pe stock na chalna matlab distribution — achhi news ko exit liquidity ki tarah use kiya gaya.
These may be probable reasons
Ek quarter mein profit 41% gir jaaye aur phir bhi kuch galat na ho — aisa kab hota hai?
Jab aap seasonality ko structure samajh lete hain. Newgen ke saath aaj yahi ho raha hai.
Newgen Software Technologies Limited
NSE: NEWGEN | BSE: 540900
HQ: New Delhi | 1992 se
Chairman & MD: Diwakar Nigam | CEO: Virender Jeet (31 Aug 2026 tak)
Business
Newgen enterprise software banati hai — NewgenONE platform, jo content, processes aur communications ko ek orchestration layer mein jodta hai, AI poore system mein embedded.
Simple bhasha mein: bank ka loan approval, insurance ka claim processing, sarkari file ka movement — paperwork aur approvals ka jo jaal hai, Newgen usko software mein badal deti hai.
Customers: banking, insurance, government. Geography: India, US, EMEA, APAC.
Moat
Enterprise software ka moat switching cost hota hai. Ek baar bank ka poora loan processing system Newgen par chala gaya, toh usko badalna matlab operations rok kar dobara shuru karna. Koi ye risk nahi leta.
Q1 mein Forrester ne teen jagah recognise kiya — AP Invoice Automation Wave, Adaptive Process Orchestration, aur AppGen & Low-Code Landscape. Enterprise buyers in reports se vendor shortlist banate hain.
Q1 FY27 (₹ Cr)
Revenue: 357 vs 321 = +11.2% YoY | QoQ -21% (Q4: 452.7)
PAT: 63 vs 50 = +26% YoY | QoQ -41% (Q4: 106)
Geography:
US: 92 vs 72 = +28% YoY
APAC: 56 = +12% YoY
Revenue quality:
Annuity revenue: 254 Cr = +14%
Subscription: 146 Cr = +21%
SaaS + licence subscription: 60 Cr = +40%
10 naye customer logos. UK mein ek ECM deal GBP 1.13 mn (~₹14.5 Cr).
Ab QoQ giravat samajhiye
41% profit drop dekh kar ghabrahat hoti hai. Par Newgen ka calendar samajhiye.
Ye company licence revenue par chalti hai, aur enterprise clients budget saal ke aakhir mein kharch karte hain. Isliye March quarter bhaari, June quarter halka.
Proof: EBIT margin March quarter mein 31.5% thi, June mein 13.1%.
Ye margin problem nahi hai. Ye calendar hai.
Isiliye is business mein sirf trailing-twelve-month margin dekhna chahiye — jo ~24% par hai. Ek quarter ka number yahan matlab hi nahi rakhta.
Asli story quality mein hai
Headline growth 11% hai. Par andar dekhiye:
Annuity +14%, subscription +21%, SaaS +40%.
Matlab jo hissa recurring hai — jo har saal apne aap aata hai — wo headline se tez badh raha hai. Aur jo one-time licence hai, wo dheere.
Ye structural improvement hai. Jitna recurring badhega, utni hi ye quarterly lumpiness khud kam hoti jaayegi. Jo problem aaj hai, wo apne aap ghul rahi hai.
Guidance
Management FY27 ke liye 23-25% EBITDA margin guide kar raha hai, AI practices ke expansion ke sahare. Q1 ka ~12 Cr ka revenue shortfall bhi maana gaya hai, jo baaki teen quarters mein recover hone ki ummeed hai.
Risks:
1. CEO ja rahe hain. Virender Jeet 31 August 2026 ko chhod rahe hain — personal aur professional reasons. Timing important hai: company AI-enabled enterprise orchestration ki taraf reposition kar rahi hai, aur us mode mein leadership transition execution risk laata hai.
2. Shortfall recovery pe teen quarters ka dabaav. 12 Cr chhota lagta hai, par ab wo baaki saal mein adjust hona hai. Slippage ki gunjaish kam ho gayi.
3. US par nirbharta badh rahi hai. US +28% YoY, par QoQ -13%. Growth achhi hai, par global enterprise software budgets tight ho rahe hain. Ek geography par zyada tikna risk hai.
4. Other income ka role. Balance sheet net-cash hai, toh treasury income aata hai. Ye achhi baat hai — par ye operating profit nahi hai. PAT dekhte waqt ye alag karke dekhna chahiye.
Bottom line
Is quarter ka 41% profit drop khabar hai. Par khabar aur problem — do alag cheezein hain.
Asli sawaal ye nahi ki June quarter kamzor kyun tha. Asli sawaal ye hai ki 40% SaaS growth chalti rahegi ya nahi, aur naya CEO usi disha mein chalayega ya nahi.
Seasonality har saal wapas aati hai. Leadership transition ek baar hota hai.
NSE: NEWGEN | BSE: 540900
#Newgen #EnterpriseSoftware #SaaS #FolioMax
Not SEBI Registered. Not Advice. DYOR
Weekly Events: Five things happened in the Indian economy this week. None were dramatic. But, All of them matter.
At FolioMax we don’t track headlines for their own sake. We track them to ask one question: what does this change inside a company’s P&L?
1. The RBI meets next week, and almost nobody expects a move
In a Reuters poll conducted July 21–27, 68 of 72 economists expected the MPC to hold the repo rate at 5.25% when it concludes on August 5.
The interesting part isn’t the hold. It’s the tension behind it. Inflation rose to 4.38% in June — the first reading above the RBI’s 4% target since January 2025 — yet Governor Sanjay Malhotra has called it “premature” to discuss raising rates.
What this means: the RBI is choosing growth over inflation, for now. Borrowing costs stay put, which helps anyone mid-way through a capex cycle. But a central bank tolerating above-target inflation has less room later.
2. The oil bill is the story nobody is leading with
India’s crude import bill jumped roughly 60% in Q1 FY27 on elevated international prices, per provisional petroleum ministry data.
Why it cuts deep: around 40% of India’s crude, 60% of its LNG and 90% of its LPG come through the Strait of Hormuz. India imports over 85% of its oil needs.
What this means: oil isn’t one input. It’s the input, sitting quietly inside dozens of P&Ls. Crisil has flagged that an oil escalation helps upstream oil companies while squeezing refiners’ margins, with specialty chemicals, paints, aviation and tyres also exposed.
Next time you see a paint or chemicals company’s gross margin compress, check crude before blaming management.
3. Foreign money came back
The RBI’s July bulletin noted FDI in April–May ran higher than last year, and FPI turned positive in June and stayed positive through July.
What this means: foreign flows change who owns a company. They do not change what it earns. Useful as sentiment. Dangerous as a reason to own something.
4. Reserves rose, but the mix shifted
Forex reserves rose $1.08 billion to $676.24 billion in the week ended July 17 — foreign currency assets up $4.55 billion, gold down $3.48 billion.
What this means: headline up, composition changed. For anyone with dollar costs or export receivables, reserve strength is what stands between them and a disorderly currency.
5. The RBI is watching the monsoon
Its July State of the Economy report called the economy resilient despite growing risks from the war in Iran and a weak monsoon.
What this means: a weak monsoon takes two to three quarters to reach a corporate P&L — first rural volumes, then FMCG, two-wheelers, tractors, agri-inputs, rural lending. A slow risk that arrives long after it stops being news.
Putting it together
Separately these are noise. Together a picture forms.
An economy growing well, with a central bank looking past inflation, funded partly by returning foreign money — while an oil shock works through the cost base and a weak monsoon works through rural demand.
Not bearish. Not bullish. It’s an economy where the tailwinds are visible and the headwinds are delayed.
That gap — between the visible and the delayed — is where most investing mistakes are made.
What we do with this
We don’t predict which way the macro breaks. Nobody does that well for long.
We do something simpler. We let the macro set the questions we ask of every company we study:
Where does its raw material come from, and does that route pass through a warzone?
Is its demand urban or rural, and which one is under pressure?
Is it borrowing to grow, and what breaks if rates move?
Does it earn in dollars, spend in rupees, or both?
The macro doesn’t tell you what to own. It tells you what to check.
That’s the whole difference between following the news and using it.
Not SEBI Registered. Not Advice. Educational only. DYOR.
#IndianEconomy #Investing #StockMarketIndia #FolioMax
Revenue 66% badha. Profit 35% badha. Margin gir gaya.
Teeno ek saath ho toh matlab ek hi hota hai — growth kahin aur se aayi hai.
Vidhi Specialty Food Ingredients Limite
HQ: Mumbai | 1994 se
Chairman & MD: Bipin Manek | Joint MD: Mihir Manek | CFO: Mitesh Manek
Business
Ye company khaane ka rang banati hai. Literally.
Synthetic food colours — jo biscuit, cold drink, candy, capsule, lipstick aur pet food mein jaate hain. Plants Raigad aur Dahej SEZ mein. Capacity 7,500 MT, 4,200 MT expansion mein.
Asia ki 2nd largest, duniya ki 3rd largest. 80+ deshon mein export. Customers: Nestle, Unilever, Coca-Cola, Pepsi, Mars, Mondelez, Pfizer, Britannia, ITC, Cipla.
Moat
Sochiye — Nestle apne product ka rang badalne wala vendor kyun badlega?
Ek customer ka full approval ~10 saal leta hai. Pehle order tak ka cycle 4-5 saal. Har batch pe certification. USFDA, FSSC 22000, Kosher, Halal.
Naya competitor aane mein ek dashak lagayega. Aur purana customer switch nahi karega — colour hi product ki pehchaan hai.
Q1 FY27 (₹ Cr)
Revenue: 146.3 vs 87.9 = +66.4% | QoQ +19.2%
Gross Profit: 49.1 vs 38.0 | GP margin 33.6% vs 43.3%
EBITDA: 26.0 vs 20.5 | margin 17.8% vs 23.4%
PAT: 17.1 vs 12.7 = +34.7% | margin 11.7% vs 14.5%
EPS: 3.4 vs 2.5
Revenue 66% upar, par gross margin 970 bps neeche. Kyun?
Asli kahani: do business, ek P&L
Vidhi do cheezein karti hai. Manufacturing — apna banaya colour. Trading — doosron ka maal khareed kar bechna.
Q1 FY27:
Manufacturing: 99.6 Cr revenue, EBITDA margin 24.7%
Trading: 46.7 Cr revenue, EBITDA margin 3.1%
Pichhle saal se:
Manufacturing: 79.4 → 99.6 Cr = +25%
Trading: 8.5 → 46.7 Cr = +448%
58.4 Cr ke growth mein se ~38 Cr sirf trading se. Yaani do-tihai growth uss business se jahan 100 rupay pe 3 rupay bachte hain.
Trading ab revenue ka 32% hai. Pichhle saal 10% tha.
Manufacturing kharab nahi hui — uska margin Q4 ke 20.9% se badhkar 24.7% hua. Bas uske upar low-margin ka bada layer chadh gaya.
“EBITDA margin has expanded by approximately 400 basis points.”
Sach hai — par ye manufacturing margin ka QoQ improvement hai. Consolidated EBITDA margin 23.4% se 17.8% gira hai. Statement galat nahi, par kis cheez ka percentage hai ye spell out nahi kiya gaya.
Investor ka kaam yahi poochna hai.
Achhi khabar
Volume sirf +4.9% (1,506 MT vs 1,436 MT), par manufacturing revenue +25%. Matlab per-kg realisation ~20% badhi — cosmetic dyes aur value-added products ki taraf shift ka asar. Asli operating improvement yahi hai.
Concerns
1. Growth ki quality. Do-tihai growth 3% margin ke trading se. Ye scale hai, value nahi. Aur company pehle keh chuki thi ki trading se nikal rahi hai — ab wo ulta badh gaya.
2. Concentration. Top 10 customers ab 69.88%, FY26 mein 56.92%. Top 10 countries 80.81% vs 74.24%.
3. Americas par nirbharta. Q1 mein 53% revenue Americas se, FY26 mein 44%. Trade policy risk ab centralised hai.
4. Topline char saal se stuck. FY23: 404 Cr. FY26: 380 Cr. Profit badha (37.7 → 49.0 Cr), revenue nahi.
5. Cash conversion. FY26 PAT 49 Cr, CFO 42.4 Cr. FY25 mein CFO negative 4.6 Cr tha. Receivables 143 Cr — ~137 din. Paisa kaagaz par ban raha hai, bank mein aane mein waqt lag raha hai.
6. Naye projects moat se bahar hain. Project 2 plastics, paints, automotive, textiles ke liye hai — wahan 10-saal ka approval cycle nahi hota. Matlab regulatory moat kaam nahi karega, sirf price aur quality par ladna hoga. Aur dono projects ka capex ya timeline disclose nahi hai.
Bottom line
Vidhi ka core business mazboot hai. 10 saal ka approval cycle mazaak nahi. Manufacturing margin 24.7% par pahunchna asli progress hai.
Par is quarter ka 66% growth uss business ka nahi hai. Wo trading ka hai, jahan margin 3% hai.
Growth aur growth ki quality — do alag cheezein. Headline dono ko ek jaisa dikhata hai. P&L nahi dikhata
#VidhiSpecialty #SpecialtyChemicals #FolioMax
Not SEBI Registered. Not Advice. DYOR.
Ek quarter mein itne orders aa gaye ki poore pichhle saal ka inflow chhota pad gaya. Ab sawaal ye hai — execute kaise hoga?
MTAR Technologies Limited
NSE: MTARTECH | BSE: 543270
HQ: Hyderabad | 1970 se — 55 saal engineering ke
MD: Parvat Srinivas Reddy
Business
Precision engineering — wahan jahan ek millimetre ki galti allowed nahi. Nuclear reactor ke fuel handling assemblies aur coolant channels. ISRO ke Vikas engine aur cryogenic upper stage. LCA Tejas ke actuator assemblies. Solid Oxide fuel cell components. Hydro power ke draft tubes.
Moat
Certification aur trust, scale nahi. NPCIL ke saath 35+ saal — aur India mein nuclear private players ko allowed hi nahi hai. Nadcap-accredited facility with 30+ process approvals, jo India mein select companies ke paas hai. Thales, GKN, IAI, Rafael ke saath qualification cycles years lete hain. Ek baar qualified, toh switching bahut mehnga.
Q1 FY27 consolidated (₹ Cr)
Revenue: 360.7 vs 156.6 → +130.4% YoY | QoQ +17.9%
EBITDA: 85.1 vs 28.4 → +199.7% | margin 23.6% vs 18.1%
PBT: 67.4 vs 14.8 → +355%
PAT: 50.2 vs 10.8 → +364.5% | margin 13.9%
Asli kahani yahan hai
Gross margin actually GIRA hai — 54.2% se 45.5%, poore 870 bps. Phir EBITDA margin 550 bps kaise badha?
Operating leverage. Employee cost revenue ka 21.9% se 12.9% ho gaya. Other expenses 14.2% se 9.0%. Fixed cost base wahi, revenue 2.3x.
Matlab margin expansion pricing power se nahi — volume se aaya hai. Volume ruka toh margin bhi rukega.
Order book
30 Jun 2026: ₹5,143.3 Cr
Q1 inflow: ₹2,895.1 Cr — highest ever quarter, poore FY26 ke ₹2,453.3 Cr se zyada
Mix: Clean Energy 66.7% | Nuclear 13.3% | Products 12.6% | A&D 7.4%
Kaiga 5 & 6 se ₹504 Cr. SLB se ₹45 Cr data centre order.
FY26 revenue ka ~5.9x cover.
Guidance
FY27: 80% revenue growth, 24% ±100 bps EBITDA margin. India ka 2047 tak 100 GWe nuclear target. Greenfield facility Q3 FY27, fuel cell Phase 3 March 2027 tak.
Honest concerns
1. Concentration. Clean Energy revenue ka 61% aur order book ka 66.7%. Deck khud ek hi long-standing fuel cell customer ka zikr karta hai. Uska capex cycle badla toh 2/3rd business hilega.
2. Debt. Finance cost 5.8 → 15.8 Cr, +172%. D/E 0.24 se 0.45. Borrowings 177 → 369 Cr. Expansion self-funded nahi hai.
3. 80% guidance demanding hai. Q1 annualise karein toh ~65%. 80% ke liye baaki teen quarters mein ~₹405 Cr each chahiye — har quarter Q1 se 12% upar, zero slippage ke saath.
4. Nuclear lumpy hai. Order book mein 13.3%, par Q1 revenue sirf ₹3.2 Cr — 1%. Order aur revenue, dono alag timelines.
5. Working capital ka sach. WC days 172 se 59 — dramatic. Par other current liabilities 44.5 se 254.9 Cr jump hui hain. Ye largely customer advances lagti hain. Advances unwind hue toh number wapas chadhega.
6. Margin history consistent nahi. FY23 EBITDA margin 26.8% thi, FY25 mein 17.9%. Ye business apni margin hold karne mein pehle struggle kar chuka hai.
Bottom line
MTAR ke paas ab paanch saal ka kaam hai. Sawaal capability ka nahi. Sawaal ye hai — jo company 876 Cr revenue ke liye bani thi, wo 1,500+ Cr execute karte waqt margin, working capital aur balance sheet teeno sambhal payegi?
Order book promise hai. Execution proof hai.
NSE: MTARTECH | BSE: 543270
#MTARTECH #NuclearIndia #CleanEnergy #FolioMax
Not SEBI Registered. Not Advice. DYOR.
♻️ A tyre-recycling company just posted its best-ever quarter — and reaffirmed a ₹1,000 crore vision. The numbers are strong. But there’s one line item every serious investor should understand before extrapolating. Let’s cover it fairly.
Tinna Rubber & Infrastructure Ltd
NSE: TINNARUBR | BSE: 530475 | New Delhi | Est. 1987 | MD: Bhupinder Kumar Sekhri
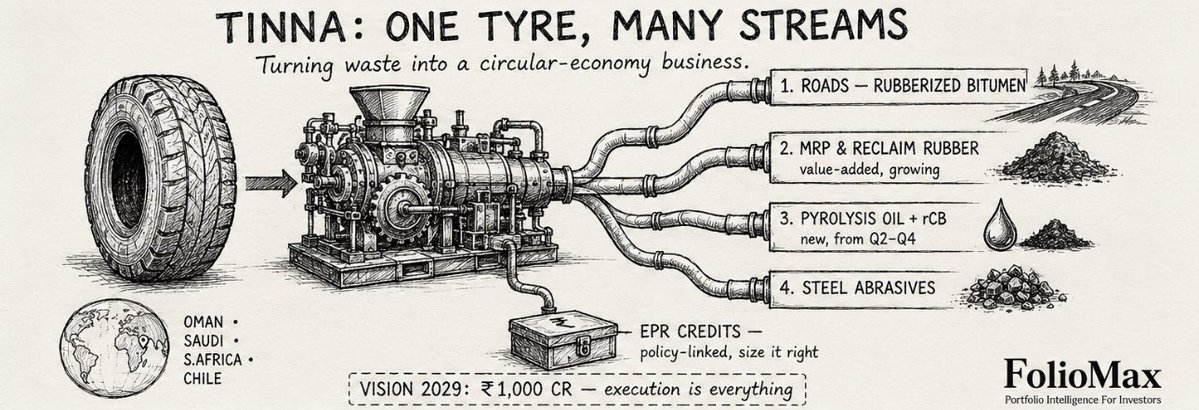
The business: one of India’s largest tyre-recyclers. It turns end-of-life tyres into crumb rubber, micronized rubber powder (MRP), reclaimed rubber, and rubberized bitumen for roads — plus newer lines: PCMB, tyre pyrolysis oil (TPO), recovered carbon black (rCB) and steel abrasives. A genuine circular-economy / ESG play.
Q1 FY27 (Apr–Jun 2026), consolidated:
• Revenue ₹156 cr → +20% YoY
• EBITDA >₹30 cr → margin ~22% (vs ~17% LY, a multi-year high)
• PBT ₹27.5 cr → +76% YoY
• PAT ₹20.6 cr → +75% YoY
• EPS ₹11.42 (vs ₹6.84)
Best quarterly profitability ever. Management says inventory gains were negligible — so the margin jump is operational, driven by (1) cheaper feedstock via raw-material optionality and (2) a richer mix of value-added products (MRP volumes +28%, reclaimed rubber +37% YoY). They call these gains “systemic, not one-off.”
🧠 The nuance to understand (no spin):
A meaningful part of profit comes from EPR credits — a regulatory income stream. Management pegs it at ~₹25–30 cr/year at the PBT level. Separately, ₹21 cr of EPR credits accrued in prior years was monetised into cash this quarter — a one-time cash event, already booked in earlier P&L, not fresh Q1 profit. On the call, an analyst noted that stripping EPR out leaves underlying PBT growth far more muted; management’s honest counter was that EPR is now “an integral part of any recycling business.” Both are fair. Just know this income is policy-linked (credit floor price ~₹2,500/unit) — so don’t blindly annualise headline PAT.
📊 Segment colour: Industrial revenue +58%, Infra +7% (the West Asia bitumen shortage actually boosted rubberised-bitumen demand), Exports volume +46%. The Consumer/turfing segment fell ~20% on a raw-material price spike.
🎯 Management guidance & roadmap:
• FY27 revenue: ₹670–700 cr; EBITDA margin guided 18–20% (delivered 22% in Q1, kept conservative for front-ended expansion costs)
• Vision 2029: ₹1,000 cr revenue, 25%+ revenue CAGR, 33%+ profit CAGR, EBITDA >18%, ROCE >30%, presence across 10 locations
• Capex ~₹100 cr over FY27–28 (₹27 cr spent in Q1)
• Pipeline: MRP capacity → 20,000 TPA (their belief: world’s largest) by Q3; TPO commercial sales from Q2; rCB from Q3–Q4; PCMB tripled YoY, scaling to 18,000 TPA
• Going global for feedstock security: Oman, Saudi Arabia, South Africa, and a new Chile subsidiary
⚠️ Fair risks: EPR/policy dependence, Middle-East geopolitical exposure (Oman/Saudi/South Africa), start-up losses on new plants (~₹53 lakh this quarter), feedstock/commodity volatility, and heavy simultaneous execution across many projects. Management itself admits some targets hinge on geopolitical normalisation.
✅ The balanced takeaway: Tinna is a real, diversified circular-economy business riding genuine tailwinds — ESG mandates, India cutting bitumen imports, and rising demand for recycled rubber — with clear guidance and a credible expansion pipeline. If it executes Vision 2029 and keeps deepening the value-added mix, the structural story is attractive. Just size the EPR contribution correctly and track execution quarter by quarter. Strong hand, eyes open. 🌱
Educational only. Not a buy/sell call. I’m not SEBI-registered. DYOR.
#TinnaRubber #TyreRecycling #CircularEconomy #Q1FY27
Two years ago this was the market’s problem child — fibre glut, thin margins, heavy debt. This quarter it printed its best numbers ever and quietly turned net debt-free.
Sterlite Technologies Ltd (STL)
NSE: STLTECH | BSE: 532374 | Pune | Est. 2000 | Vedanta / Anil Agarwal group
The business: India’s largest optical fibre & cable maker — ~9% global share (ex-China), 785 patents, present in 100+ countries. Now repositioning hard around “AI-ready” digital infrastructure: optical connectivity for data centres & hyperscalers.
Q1 FY27 (Apr–Jun 2026), consolidated:
• Revenue ₹1,910 cr → +87% YoY (record)
• EBITDA ₹397 cr → +184% YoY, margin 20.8% (best in ~20 quarters)
• PAT ₹197 cr → vs just ₹10 cr last year
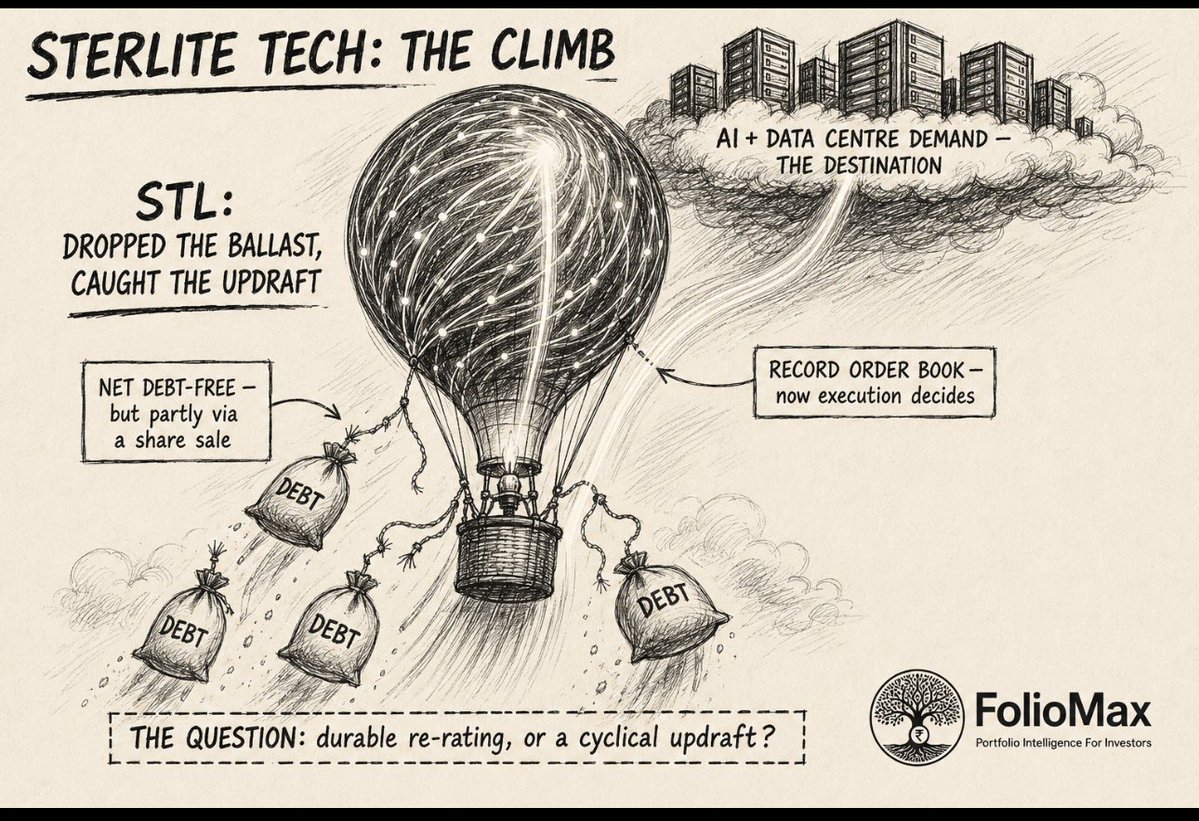
• Order book ₹18,618 cr (record), incl. a ~$1.11bn hyperscaler deal
• Turned net debt-free — net cash ₹483 cr
For context: the company’s entire FY26 profit was ₹56 cr. This one quarter did ₹197 cr.
Why the turnaround? 🔧
Two engines: (1) product mix shifting toward high-value optical connectivity + data-centre demand, and (2) operating leverage — revenue nearly doubled on a cost base that didn’t. Margins snapped back from a deep trough. Management raised FY27 EBITDA-margin guidance to ~23% and expects data centre + enterprise to hit ~50% of revenue.
But read the fine print 🧠
• The ₹10 cr → ₹197 cr “jump” flatters a near-zero base. This is a cyclical recovery, not yet proven compounding.
• “Debt-free” came partly from a ₹1,500 cr QIP — dilution, not just cash flow. Promoter stake slipped 44.4% → 42.3%.
• That record order book leans on a few giant deals. Big-order concentration = lumpiness + customer bargaining power.
• Optical fibre is cyclical and capex-linked. Fibre prices have crashed before, and can again.
The bright side: the concerns are about durability, not health. A debt-free balance sheet, a record order book, an upgraded credit rating, and a front-row seat to the AI + data-centre buildout is a genuinely strong hand. If STL converts even part of that pipeline at these margins, a company left for dead could quietly become one of the cleaner ways to play India’s digital-infrastructure decade. The setup is real — now it’s about execution.
Educational only. Not a buy/sell call. I’m not SEBI-registered. DYOR.
#SterliteTech #STLTECH #OpticalFibre #DataCenter #Q1FY27 #Foliomax
The lesson: don’t chase a windfall quarter. Understand why the profit came, and whether it lasts.
That’s how you think in businesses, not tips.
Educational only. Not a buy/sell call. I’m not SEBI-registered. DYOR.
#GandharOil#Divyol#StockMarketIndia#Q1FY27
An oil company just posted a profit bigger than its entire previous year.
And no — it wasn’t a stock-market gain. It was the boring old core business firing on all cylinders.
Let’s break down Gandhar Oil Refinery’s Q1 FY27. 🧵
One quiet footnote worth tracking: the board just added an object clause letting the company trade in shares, derivatives, commodities & currencies. Treasury discipline for its growing cash — or scope creep? 👀