https://t.co/ikU1AJFVeF -رسمي
https://t.co/948TsZpXyB - قناة تيليغرام
لقد راقبت "ForeDex" عن كثب تطور هيكل السوق وسلوك التداول منذ الموافقة على صندوق الاستثمار المتداول في البيتكوين. بناءً على هذه التغييرات الهيكلية، قمنا بإنشاء معيار جديد لتحليل بيانات السلسلة.
تشمل مجموعات البيانات الرئيسية التي توفرها "ForeDex":
✅مقاييس تدفق صانع السوق (MM)
✅مقاييس تدفق المؤسسات
✅مقاييس تدفق الصناديق المتداولة (ETF)
✅مقاييس CVD المتقدمة
بالإضافة إلى هذه المقاييس الأساسية، نقدم مجموعة واسعة من الميزات ومجموعات البيانات المصممة بعناية لضمان تجربة مستخدم مثالية. "
تلتزم "ForeDex" بتحسين بياناتنا باستمرار لتقديم رؤى أوضح وأكثر قابلية للتنفيذ. نحن نرحب بحرارة بتعليقات المستخدمين وندمجها لتشكيل مستقبل منصتنا.
https://t.co/WZ820Dv4Z2
ForeDex analyzed keywords used in Michael Saylor’s X posts from 2020 to 2026.
The result was much clearer than expected.🤯
Starting around 2024, the core narrative in Saylor’s language began to shift.
➡️ Before 2024, Bitcoin was mostly framed as "Digital Gold."
➡️ After 2024, however, the use of "Digital Gold” began to decline noticeably.
💡 At the same time, new keywords like “Credit” and “Digital Capital” began to emerge.
So what does this shift suggest?🤔
🎭 Just another new, trendy way of marketing Bitcoin?
🎭 Or is it an inevitable change driven by the increasingly complex funding structure behind Strategy?
Daily ForeDex CVD by Order Size (Spot) Snapshot 📸
🔸 Whales and Mega Whales Only
🔸 Based on a 1 month period (1M)
1. Binance : Increased
2. Bybit : Increased
3. Bitfinex (USD) : No Change ➖
4. Bitfinex (USDT) : No Change ➖
✅ Summary: Binance and Bybit led today’s CVD increase, while Bitfinex USD and Bitfinex USDT showed no change.
[06-15-2026]
👨🏫 Part two of the flow series: after market makers, @ForeDex_Global Recognized Analyst @_InvResearch turns to the whale side of #Bitcoin’s bottoming structure:
➡️ Earlier, price lows came with rising whale inflows, supporting the bearish trend. More recently, Figure 1 shows new lows with declining whale inflows, suggesting a bullish divergence as whale-driven selling pressure eases. 🐳
➡️ Figure 2 shows whale $BTC withdrawals from exchanges, often read as accumulation activity. As price continued making new lows, whale withdrawals strengthened. The accumulation scale on 2026/4/27 also approached the late-bear-market level seen on 2022/9/19, adding to the constructive whale-side signal.
💡 From the whale perspective, selling pressure is easing while accumulation is strengthening, making the whale-side structure constructive for the $BTC bottoming process.
💡 However, in the post-ETF era, whale signals alone may not confirm a full reversal, and stronger institutional buying momentum is still needed. 🙏
⚖️ When miners produce at a loss, the market eventually has to rebalance. @ForeDex_Global Recognized Analyst @RugaResearch revisits the Mining Production Cost chart:
⛏️ $BTC is trading around $61K, below the average #Bitcoin mining production cost of $71,130, meaning miners are producing coins at roughly a 14% loss. The operational floor sits near $44,610, so miners are not at immediate shutdown levels, but profitability pressure is clearly building.
⛏️ This is a rare condition in Bitcoin’s history, where miners are underwater on newly produced coins. These periods usually do not last long, because either price recovers toward production cost or hash rate falls until the economics rebalance. Historically, similar conditions have resolved upward within 1–3 months.
"Not calling a bottom. Just pointing at the math. 📊"
🐳 ForeDex Whale Tracker gives traders a clearer read on large Bitcoin flow.
🔸 Our tracker monitors #Bitcoin transactions involving 1,000 $BTC or more and applies AI-assisted classification to reduce noise from known internal wallet transfers.
🔸 Whale Tracker webpage arranges the data into Accumulation, Distribution, and Whale Sentiment, giving users a faster way to understand the broader whale-flow balance.
🟨 Today, while $BTC is trading under pressure, whale flow is not purely distribution-heavy. Accumulation remains larger than distribution, while the overall whale sentiment is still Neutral.
✅ Follow Telegram for alerts, and check the sentiment on our website. 🐳
💬TG: https://t.co/7hKW8IOQ65
🌐URL: https://t.co/Z0Pjb7MN8H
🪝هل يمكن أن يهبط #البيتكوين إلى مستويات الـ 40k أو 50k؟ 📉
الجميع يرتعد من هذا السيناريو ويراه نهاية الدورة الصعودية، لكن في عالم "الأموال الذكية" (Smart Money) قد يكون هذا الهبوط هو هندسة مثالية لأكبر موجة صعود قادمة.
إذا كنت تريد فهم ما يحدث خلف الكواليس ومصير الصناديق والحيتان..
تابع هذا الثريد بالدليل والشارت 👇🧵
اذا اخذنا الخارطة الكاملة لهيكل bitcoin:native
وشرحنا الفريمات وحركة المال ومصيدتها من خلال تحليل SMC
واذا دمجنا معهم خرائط التصفية لثلاث منصات (Binance, MEXC, Hyperliquid) تنكشف الصورة الأكبر بوضوح:
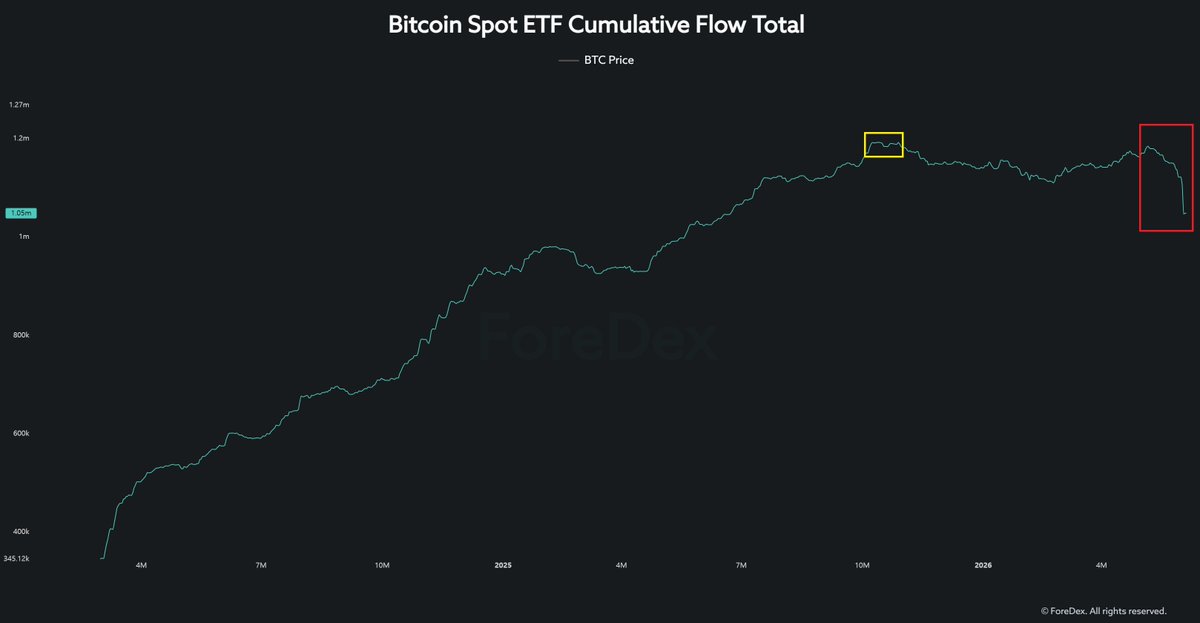
Since the approval of the Bitcoin spot ETF, "ETF Cumulative Flow Total" had been steadily increasing.
However, the pace of accumulation began to slow around October 10, 2025 (yellow box), and by May 8, 2026 (red box), the trend itself started to reverse.
What we are seeing now is the steepest decline in cumulative ETF holdings since the ETF era began.
If institutional participation has indeed become one of the most important drivers of the market following ETF approval, then this is not a signal that should be taken lightly.
So what about the liquidity indicators that were important even before the ETF era?
The answer is simple: they are telling a very similar story.
If institutions truly viewed the current market environment as an aggressive buying opportunity, it is difficult to argue that ETF cumulative holdings would be declining at this pace.
And it is not just ETF flows.
External OTC buy-side liquidity is showing a similar pattern.
In other words, both ETF-related demand and non-ETF institutional liquidity continue to weaken, suggesting that meaningful buying pressure is becoming increasingly scarce.
🐳 إطلاق ForeDex Whale Alert
مراقبة الخطوة التالية لمحفظة Mt. Gox :
🔸116 BTC قد انتقلت إلى البورصات.
🔸10,306 BTC لا تزال غير نشطة.
الـ 116 المرتبطة بالبورصات BTC مرتبطة مباشرة بنشاط السداد، بينما تظل المحفظة الأكبر غير المُحرّكة هي الرصيد الرئيسي الذي يجب مراقبته. 🔍
✅ لقد أطلقت ForeDex ForeDex Whale Alert لمساعدة المستخدمين على تتبع هذا النوع من المعاملات.
تتبع ForeDex Whale Alert معاملات Bitcoin التي تشمل 1,000 BTC أو أكثر وتستخدم نظام تصنيف مدعومًا بالذكاء الاصطناعي لتصفية تحويلات المحفظة الداخلية المعروفة.
شهد السوق انتقال 116 BTC إلى البورصات.
🚨 الآن التركيز على ما تبقى من 10,306 BTC.
تابع خطوتها التالية على ForeDex Whale Alert. 🐳
البيتكوين يكسر خط دفاع الحوت الأكبر "سايلور #MicroStrategy ماذا يحدث ؟
يتداول $BTC الآن أسفل متوسط تكلفة شركة MicroStrategy الممتد بين 75k - 76k.
📌 اذا اختصرنا المشهد:-
هيكلياً على شارت 4H كسر بنية هابط متتالي (BoS) لتطهير السوق وتسييل المراكز الضعيفة التي دخلت عند القمة.
وتاريخيا" كسر خط تكلفة المؤسسات يعني نزيف وتصفية مؤقتة للرافعات المالية وايضا" يمثل دائما" منطقة التجميع الذهبية للسيولة الذكية.
ارى الضغط الحالي طبيعي لتطهير السوق واستهداف مجمعات السيولة الأدنى.
خلو عينكم على مستويات الـ 70-72 كمنطقة دعم وهيكل رئيسي للبيتكوين
Data via @ForeDex_Global
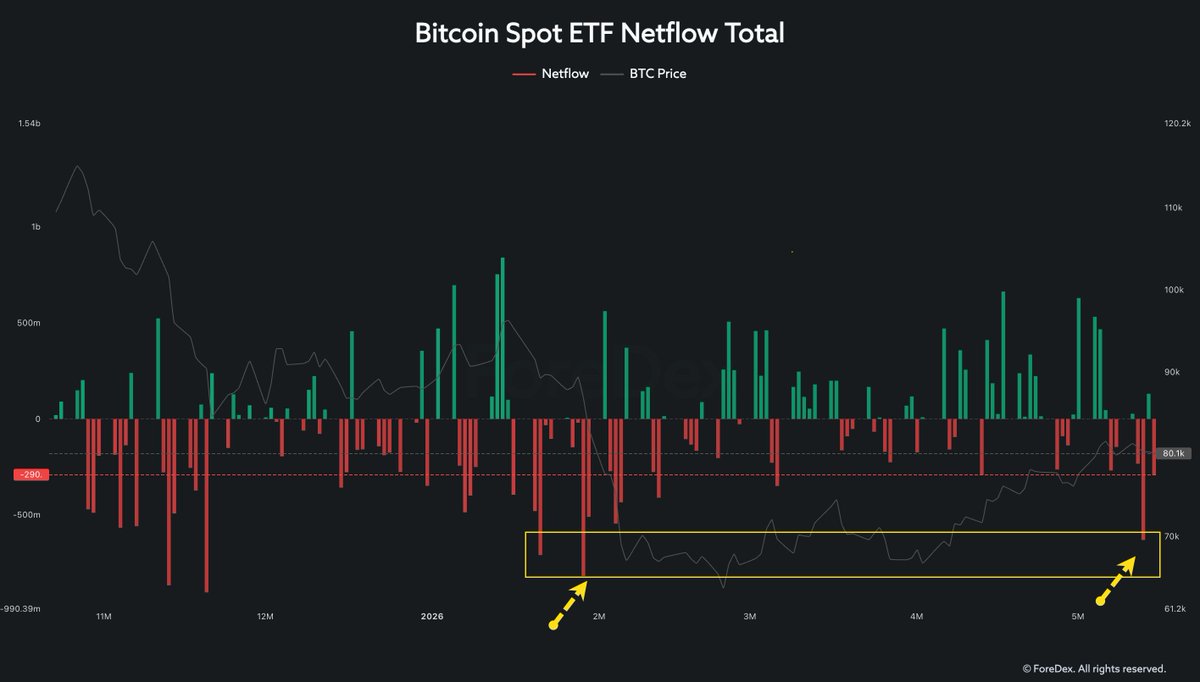
صناديق ETF أمس حولت بتكوين للمنصات بقيمة 733 مليون دولار وده ثالث آكبر تصريف للبتكوين منذ شهر يناير الماضي .
نفس سلوك تصريف البتكوين من طرف الصناديق عندما صعد البتكوين من 80 حتي 96 ألف .
الصناديق بدأت البيع فوق 80 ألف منذ منتصف الشهر الحالي وتم التنبيه 🤝
@ForeDex_Global
Daily ForeDex CVD by Order Size (Spot) Snapshot 📸
🔸 Whales and Mega Whales Only
🔸 Based on a 1 month period (1M)
1. Binance : Decreased 📉
2. Bybit : No Change ➖
3. Bitfinex (USD) : No Change ➖
4. Bitfinex (USDT) : No Change ➖
✅ Summary: The only notable shift came from Binance, where whale CVD moved lower. No new directional move across Bybit or Bitfinex.
[05-27-2026]
استمرار تفوق تدفقات الفائدة المفتوحة الخاصة بالإيثيريوم مقارنة بالبيتكوين داخل سوق المشتقات، حيث استقر المؤشر مؤخرًا قرب مستوى 55.7%. ويُستخدم هذا المؤشر لقياس نسبة تدفقات العقود المفتوحة المتجهة نحو ETH مقارنة بـ BTC، ما يساعد في فهم تفضيلات المتداولين داخل سوق المشتقات.وتُظهر البيانات أن المؤشر يتحرك منذ فترة ضمن المنطقة المحايدة ب��ن 45% و65%، ما يعكس توازنًا نسبيًا بين اهتمام السوق بالإيثيريوم والبيتكوين. كما أن بقاء المؤشر قرب المستويات الحالية قد يشير إلى استمرار النشاط المضاربي على الإيثيريوم دون وصول السوق إلى حالة تشبع مفرطة.ورغم أن المؤشر لا يُعتبر إشارة صعود أو هبوط مباشرة، إلا أن ارتفاعه عادةً يعكس زيادة اهتمام المتداولين بعقود ETH مقارنة بالبيتكوين، خاصة خلال فترات تحسن شهية المخاطرة داخل سوق العملات الرقمية.
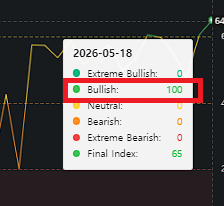
The Fear & Greed Index is not the only way to read the market sentiment.
📺 The Crypto YouTube Narrative Index tracks how selected Bitcoin-focused creators are leaning each week - bullish or bearish - using a clearly defined and quantitative methodology.
Historically, when the tracked narrative becomes broadly one-sided, $BTC has often moved in the opposite direction.
✅ This time, the same pattern appeared again, with an unusually high share of creators leaning bullish.
The index focuses on Bitcoin-focused creators with at least 2+ years of consistent market-analysis history, regular weekly uploads, and clear directional views on the market.
Purely informational channels, long-term value-style investors, and unconditional “up only” narratives are excluded, so the index focuses on directional weekly Bitcoin narratives and highlights when sentiment becomes crowded.🚨
💡Turning scattered #Bitcoin commentary into a structured, weekly sentiment dataset.
The Market Liquidity Regime Index is one of the cleanest indicators available to identify where we are in the cycle.
In late 2017 we had the distribution signal at the top, between 14k and 18k, and Bitcoin dropped all the way to 3,200 dollars where the accumulation signal was activated. In 2020 the accumulation signal appeared again at the bottom that tested 5k, and from there we went to 64k. In 2021 we saw the distribution signal that led to the drop down to 16,500 dollars in late 2022. In 2023 the accumulation signal returned and took Bitcoin all the way to 126k.
Since then we have only seen distribution signals. Meaning we have not had a real accumulation moment during this drop from 126k to the 60k region.
We will be watching for when the accumulation signal appears and seeing how the market develops from there. We may see a liquidity hunt lower before a real spot accumulation phase begins. We know that the rally from 60k to 82k was driven mainly by derivatives, and that does not inspire the confidence needed for a truly sustained move higher.
The signal has not come yet. When it does, it will deserve full attention.
@ForeDex_Global
مؤشر تدفق الحيتان في البورصة يصنف نشاط الحيتان في البورصة إلى إشارات تراكم وتوزيع من خلال تتبع حركات كيانات الحيتان عبر البورصات الرئيسية.🐳
https://t.co/UAUjS9Sq8K
The Exchange Whale Flow Indicator classifies whale exchange activity into accumulation and distribution signals by tracking whale-entity movements across major exchanges.🐳
Rather than simply tracking total exchange deposits and withdrawals, the indicator was developed to capture more refined liquidity movements by focusing specifically on whale-entity flows that are more likely to carry meaningful market impact.
🟢 Green = Accumulation, when whale outflows increase.
🔴 Red = Distribution, when whale inflows increase.
✅ As of now, no new accumulation signal from whales has appeared since 2023.
مؤشر رواية يوتيوب للعملات المشفرة” قد دخل الآن بوضوح منطقة “الصعودية”. ما هو ملفت للنظر بشكل خاص هو أن كل يوتيوبر رئيسي تقريباً يميل حالياً نحو الصعودية.
كيف سيتحرك البيتكوين هذه المرة؟ المنهجية وراء هذا المؤشر مبنية على المعايير التالية:
1. المحللون الذين يعبرون بوضوح عن آراء سوقية صعودية وهبوطية.
2. يُستثنى الثيران الدائمون ومستثمرو القيمة طويلة الأجل النقيون.
3. المحللون الذين يرفعون محتوى واحداً على الأقل أسبوعياً.
4. المحللون الذين ينشرون تحليلات سوقية باستمرار منذ 2024 على الأقل.
شوفت تحليلات كتير الايام الماضية ان صناديق ETF تشتري بتكوين يومياً بمليارات بدون توقف وده حقيقي كانوا يشتروا طوال فترة الصعود .
لكن شوفت تحليل واحد يقولك ان الصناديق باعت اكبر كمية بتكوين من سعر 82 ألف في يوم واحد ؟ الاجابة لا الخبر مش منتشر لان الجميع يتداول بالعاطفة ينشرون الايجابية فقط . دي اكبر كمية تم بيعها منذ شهر يناير الماضي عندما كان البتكوين في مستويات 86 ألف.
احنا تحت متوسط سعر شراء الصناديق وفوق متوسط سعر شراء سايلور .
@ForeDex_Global
🔎What is OTC Buy-Side Liquidity Flow?
Not all Bitcoin buying pressure appears on exchanges.
⭐️ OTC Buy-Side Liquidity Flow tracks how buy-side liquidity builds in the OTC market, helping traders monitor changes in off-exchange demand that may not be visible through regular exchange flow data.
🧙♂️ Because sometimes, the most important liquidity is not on the exchange.🤫
$BTC
السوق الآن عند نقطة حساسة جدًا، والهيكل بدأ يُظهر أول علامات فقدان الزخم بعد موجة الصعود الأخيرة.
على فريم 4 ساعات:
السعر فشل عدة مرات بالثبات فوق 81K–82K
الزخم بدأ يضعف
Stoch RSI أعطى تقاطعًا هابطًا من مناطق التشبع الشرائي
والضغط البيعي عاد للظهور قرب المقاومات
لكن حتى الآن لا يوجد كسر كامل للاتجاه الصاعد على الفريمات الأكبر.
المنطقة الأهم حاليًا:
79K–78.8K
هذه المنطقة تعتبر دعمًا حاسمًا للسوق.
الثبات فوقها قد يحوّل الهبوط الحالي إلى:
Liquidity Sweep
ثم إعادة استهداف مناطق السيولة العليا قرب 81K–83K.
أما كسرها بإغلاق 4H واضح فقد يفتح الطريق نحو:
78K
ثم 77.5K وربما أعمق.
من جهة التدفقات والبيانات:
Funding Rate ما��ال بعيدًا عن مستويات الخطر
ETF Flow لم يُظهر خروجًا مؤسساتيًا عنيفًا
الحيتان لم تدخل مرحلة توزيع قوية حتى الآن
Fear & Greed خرج من مناطق الجشع المبالغ فيه
وهذا يجعل الهبوط الحالي يبدو أقرب إلى:
تصحيح وسيولة
وليس بداية انهيار شامل حتى اللحظة.
لكن السوق الآن يحتاج الى….
استعادة 80.5K ثم 81K سريعًا
حتى يعود الزخم الإيجابي بشكل واضح.
غير ذلك ممكن
قد تستمر حركة سحب السيولة للأسفل قبل أي محاولة صعود جديدة.
@ForeDex_Global


![ForeDex_Global's tweet photo. Daily ForeDex CVD by Order Size (Spot) Snapshot 📸
🔸 Whales and Mega Whales Only
🔸 Based on a 1 month period (1M)
1. Binance : Increased
2. Bybit : Increased
3. Bitfinex (USD) : No Change ➖
4. Bitfinex (USDT) : No Change ➖
✅ Summary: Binance and Bybit led today’s CVD increase, while Bitfinex USD and Bitfinex USDT showed no change.
[06-15-2026]](https://pbs.twimg.com/media/HK3E5POXIAAjeik.jpg)
![ForeDex_Global's tweet photo. Daily ForeDex CVD by Order Size (Spot) Snapshot 📸
🔸 Whales and Mega Whales Only
🔸 Based on a 1 month period (1M)
1. Binance : Increased
2. Bybit : Increased
3. Bitfinex (USD) : No Change ➖
4. Bitfinex (USDT) : No Change ➖
✅ Summary: Binance and Bybit led today’s CVD increase, while Bitfinex USD and Bitfinex USDT showed no change.
[06-15-2026]](https://pbs.twimg.com/media/HK3E5POWgAAeHsQ.jpg)
![ForeDex_Global's tweet photo. Daily ForeDex CVD by Order Size (Spot) Snapshot 📸
🔸 Whales and Mega Whales Only
🔸 Based on a 1 month period (1M)
1. Binance : Increased
2. Bybit : Increased
3. Bitfinex (USD) : No Change ➖
4. Bitfinex (USDT) : No Change ➖
✅ Summary: Binance and Bybit led today’s CVD increase, while Bitfinex USD and Bitfinex USDT showed no change.
[06-15-2026]](https://pbs.twimg.com/media/HK3E5PNWMAA73FT.jpg)


![ForeDex_Global's tweet photo. Daily ForeDex CVD by Order Size (Spot) Snapshot 📸
🔸 Whales and Mega Whales Only
🔸 Based on a 1 month period (1M)
1. Binance : Decreased 📉
2. Bybit : No Change ➖
3. Bitfinex (USD) : No Change ➖
4. Bitfinex (USDT) : No Change ➖
✅ Summary: The only notable shift came from Binance, where whale CVD moved lower. No new directional move across Bybit or Bitfinex.
[05-27-2026]](https://pbs.twimg.com/media/HJU7GV7WIAcF-YO.jpg)
![ForeDex_Global's tweet photo. Daily ForeDex CVD by Order Size (Spot) Snapshot 📸
🔸 Whales and Mega Whales Only
🔸 Based on a 1 month period (1M)
1. Binance : Decreased 📉
2. Bybit : No Change ➖
3. Bitfinex (USD) : No Change ➖
4. Bitfinex (USDT) : No Change ➖
✅ Summary: The only notable shift came from Binance, where whale CVD moved lower. No new directional move across Bybit or Bitfinex.
[05-27-2026]](https://pbs.twimg.com/media/HJU7GV1WQAQlCAj.jpg)
![ForeDex_Global's tweet photo. Daily ForeDex CVD by Order Size (Spot) Snapshot 📸
🔸 Whales and Mega Whales Only
🔸 Based on a 1 month period (1M)
1. Binance : Decreased 📉
2. Bybit : No Change ➖
3. Bitfinex (USD) : No Change ➖
4. Bitfinex (USDT) : No Change ➖
✅ Summary: The only notable shift came from Binance, where whale CVD moved lower. No new directional move across Bybit or Bitfinex.
[05-27-2026]](https://pbs.twimg.com/media/HJU7GVzXQAA5-LO.jpg)


![ForeDex_Global's tweet photo. Daily ForeDex CVD by Order Size (Spot) Snapshot 📸
🔸 Whales and Mega Whales Only
🔸 Based on a 1 month period (1M)
1. Binance : Increased
2. Bybit : Increased
3. Bitfinex (USD) : No Change ➖
4. Bitfinex (USDT) : No Change ➖
✅ Summary: Binance and Bybit led today’s CVD increase, while Bitfinex USD and Bitfinex USDT showed no change.
[06-15-2026]](https://pbs.twimg.com/media/HK3E5PSXgAA_DQD.jpg)


![ForeDex_Global's tweet photo. Daily ForeDex CVD by Order Size (Spot) Snapshot 📸
🔸 Whales and Mega Whales Only
🔸 Based on a 1 month period (1M)
1. Binance : Decreased 📉
2. Bybit : No Change ➖
3. Bitfinex (USD) : No Change ➖
4. Bitfinex (USDT) : No Change ➖
✅ Summary: The only notable shift came from Binance, where whale CVD moved lower. No new directional move across Bybit or Bitfinex.
[05-27-2026]](https://pbs.twimg.com/media/HJU7GWhXoAENZtM.jpg)