A fascinating chart on Keurig Dr Pepper taken from our system, tracking earnings every quarter over the past 5 years.
The top line shows the company's adjusted net income (top line) on a rolling 12m basis. Almost a perfect straight line, indicating steady earnings growth every year and a clear upward trend.
The bottom line shows the same for our own, metric, which includes M&A related charges, restructuring, litigation expenses and productivity expenses. This indicates far greater volatility and little evidence of a strong upward trend over time. Even before the recent corporate actions, the divergence between the two lines was striking.
$KDP
One of the key areas of weakness in the Fabrinet results today was around cash conversion, as capex ramped up and working capital absorbed much of the cash flow. Fabrinet was rated at a 9/10 (Very high risk) on our system coming into these earnings, with a number of red flags at the max level.
Our report continues to show high risk, with inventory in particular highlighted as an area of concern. The 10-K filing shows inventory was up 76% YoY, and it now stands at over $1bn on the balance sheet.
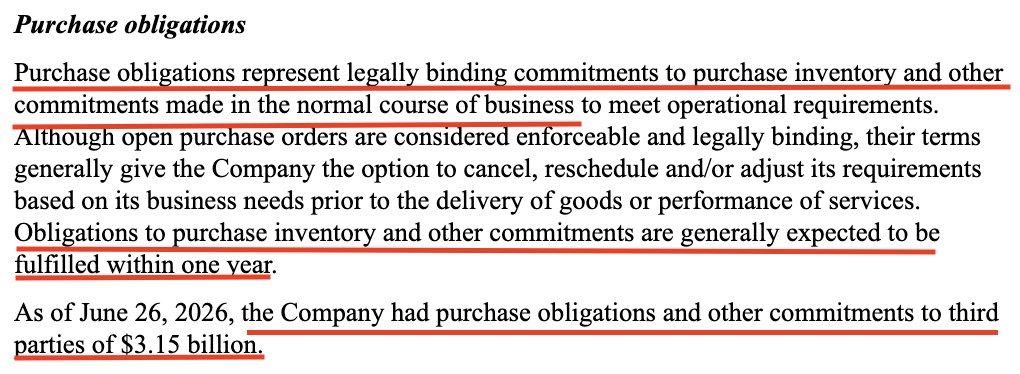
Furthermore, disclosure provided on purchase obligations (inventory and other commitments) shows purchase obligations of $3.15bn, generally expected to be fulfilled within one year (see the extract from the 10-K shown here). The equivalent number last year was only $1.4bn. That's a huge amount of new obligations taken on in the past year.
Management clarified on the call that the inventory build is not down to material constraints, but to position them for future growth opportunities. It’s clear from listening to management that Fabrinet is a machine that’s built around the expectations of huge demand-pull in the future.
If that comes through as expected, then the inventory gets absorbed and it’s fine.
However if the trajectory disappoints it can lead to bigger problems with working capital. Generally, materials acquired for one customer cannot be used for a different customer, which adds another dimension of risk where customer concentration is rising. We’ve seen this pattern before where inventory flows in faster than it can be sold - it accumulates on the balance sheet, leading to weak cash flow, inventory obsolescence (particularly in tech) and can result in significant write-offs.
$FN
Zalando is down 17% this morning after guiding full-year growth to the lower half of its 12-17% range.
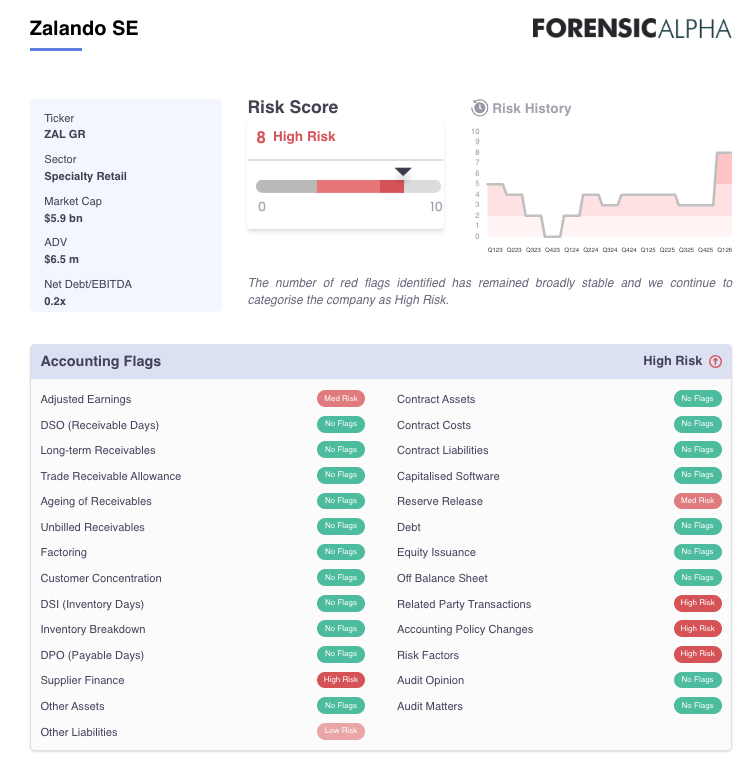
Our forensic report had shown a sharp increase in risk rating (from '5' to '8') following the publication of the FY annual report and Q1 release. In addition to a decline in earnings quality, the report highlighted a number of issues related to revenue recognition. In particular changes to the accounting policies section that may have led to inflated revenue and EBIT growth reported in previous quarters. Changes to the risk factors section in the FY annual report also hinted at a more competitive environment than management's narrative suggested. $ZAL
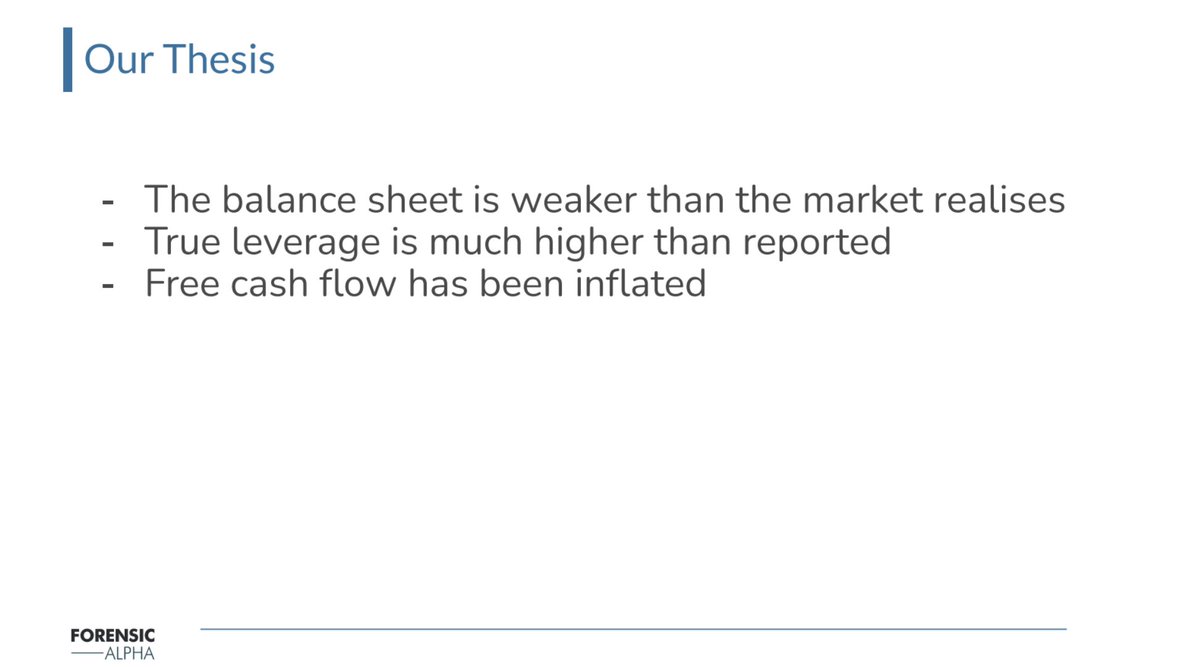
The surprise rights issue today at Orsted (down 27% today) goes to the heart of our thesis, which we set out at the IRF Best Equity Shorting Conference last month. Our system identified a balance sheet that was much weaker than the market realised $ORSTED
A side-by-side comparison of accounting policies for $INTC was possible just 2 hours after the publication of the 10-K thanks to our technology. It shows a subtle change in the point at which costs can be included within the valuation of inventory...
$DLB 10-Q shows “Unbilled Receivables” as most prominent flag on the balance sheet at $175m (~45 days of sales equivalent). DSO also somewhat elevated.
$TEL 10-Q sees a new flag for DPO, rising from 62 days to 69 days. Accounts payable on the balance sheet now amount to $1.9bn versus total debt of $4.2bn. Supplier finance has grown, with outstanding payments under supply chain finance increasing from $105m to $126m.
$OSIS 10-Q shows contract assets have reduced but remain elevated versus history. DSO continues to rise higher, while the allowance against receivables (as a percentage of receivables) continues to decline.
$CACI One key flag in the 10-Q is use of factoring arrangements, with the sale of uncollected receivables rising from $110m to $156m. This is particularly sensitive given the rising levels of debt following the acquisition of Azure Summit Technology.
Ørsted down 14% following DKK 12bn in impairments. The stock was at the top of our European "High Risk" list. Following impairments in 23/24, the temptation is for investors to believe the worst is over. In this case our system was clearly signalling investors to keep away.
@zer0estv @JehoshaphatRsch Great video. Our system flagging similar issues on the stock (showing as high risk), key ones being a sharp trend of rising contract assets and changes to the accounting policy language.
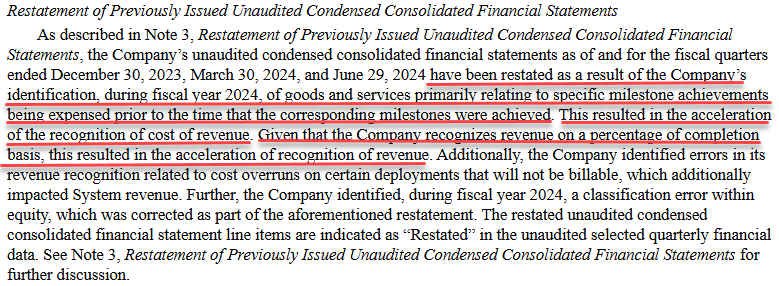
Cost of revenue was revised down by $28.6m, which means that the GM recognized on that additional revenue was 53%, way in excess of GM for the Systems business as a whole (14%). This pattern is typical in cases of aggressive revenue recognition.
Symbotic illustrates the power of monitoring key balance sheet items. Anyone tracking 'unbilled receivables' over time would have seen an extraordinary increase in value over a number of quarters - a classic flag associated with aggressive revenue recognition. $SYM
The restatement of the 10-Q filings shows that revenue for the 9m to June 29 was overstated by $61m, while unbilled receivables were overstated by nearly the same amount ($58m).
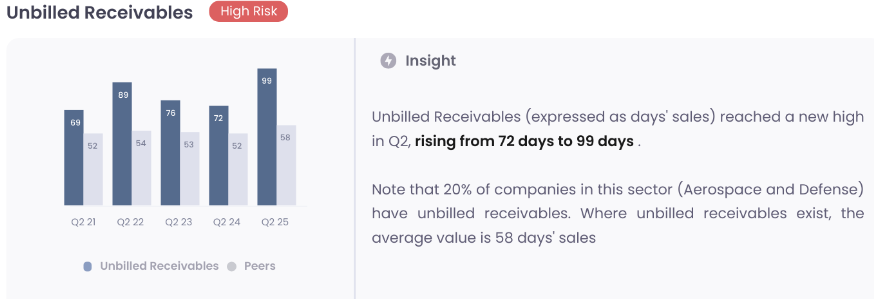
$AVAV had been flagged with our highest risk rating of "10" prior to the dramatic decline today. Our automated analysis of SEC filings shows a pattern associated with pulling earnings forward - one classic signal showing on the system here is "unbilled receivables"
@muddywatersre Very interesting work...our own system has been showing a sharp rise in accounting flags over the past few quarters, with two key flags related to inventory now at "High Risk"
We've just released our module on "Off-Balance Sheet", designed to capture high risk VIEs, JVs and associates. These names are currently showing "High Risk" on our platform:
$EQIX
$AGR
$WYNN
$CMI
$FTI
Institutional investors...DM here to book a demo and see more...
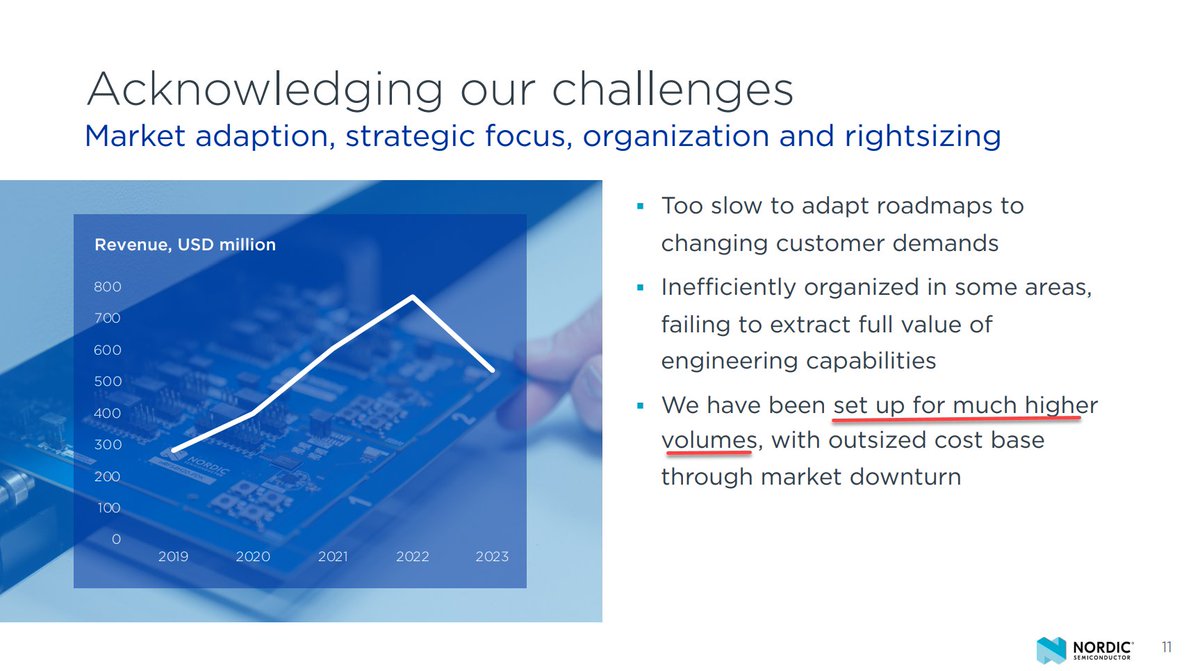
We previously wrote about a dangerous build-up of inventory at Nordic Semiconductor, symptomatic of "over-production". Lower production typically leads to lower margins, so sometimes it's easier to "extend and pretend".
As we see today (-21%), the CEO has decided to hit reset.
@JehoshaphatRsch Great work here on the Red Iron JV - the quantum of the scheme is there for all to see in the 10-K. It's always easier to generate sales when your customers aren't paying for it..😏 These off-balance sheet arrangements are too often ignored by the market.
Because of its business model, sitting between travellers and suppliers, Expedia runs with a large balance sheet. The biggest moves are seasonal changes, but this obscured a meaningful shift in DSO picked up by our system $EXPE
https://t.co/DWdv8xDoGF