If you cannot measure on ANY time chart the distance between the price position and GMT (real time) - You will *NEVER* be able to create CONSISTANT profit,..
And *NEVER* be able to SUSTAIN that profit - -
@MyFundedFX If myfundedfx know how many days does the Forex market regard as a WEEK....if they DO NOT know the correct answer....they are clueless - and its NOT 5 days a week !! Good luck !!
If your entry to buy or sell is correct and accurate - you make profit
IF your entry is wrong, you lose money AND you lose wasted time,...you lose BOTH - lose money and time -
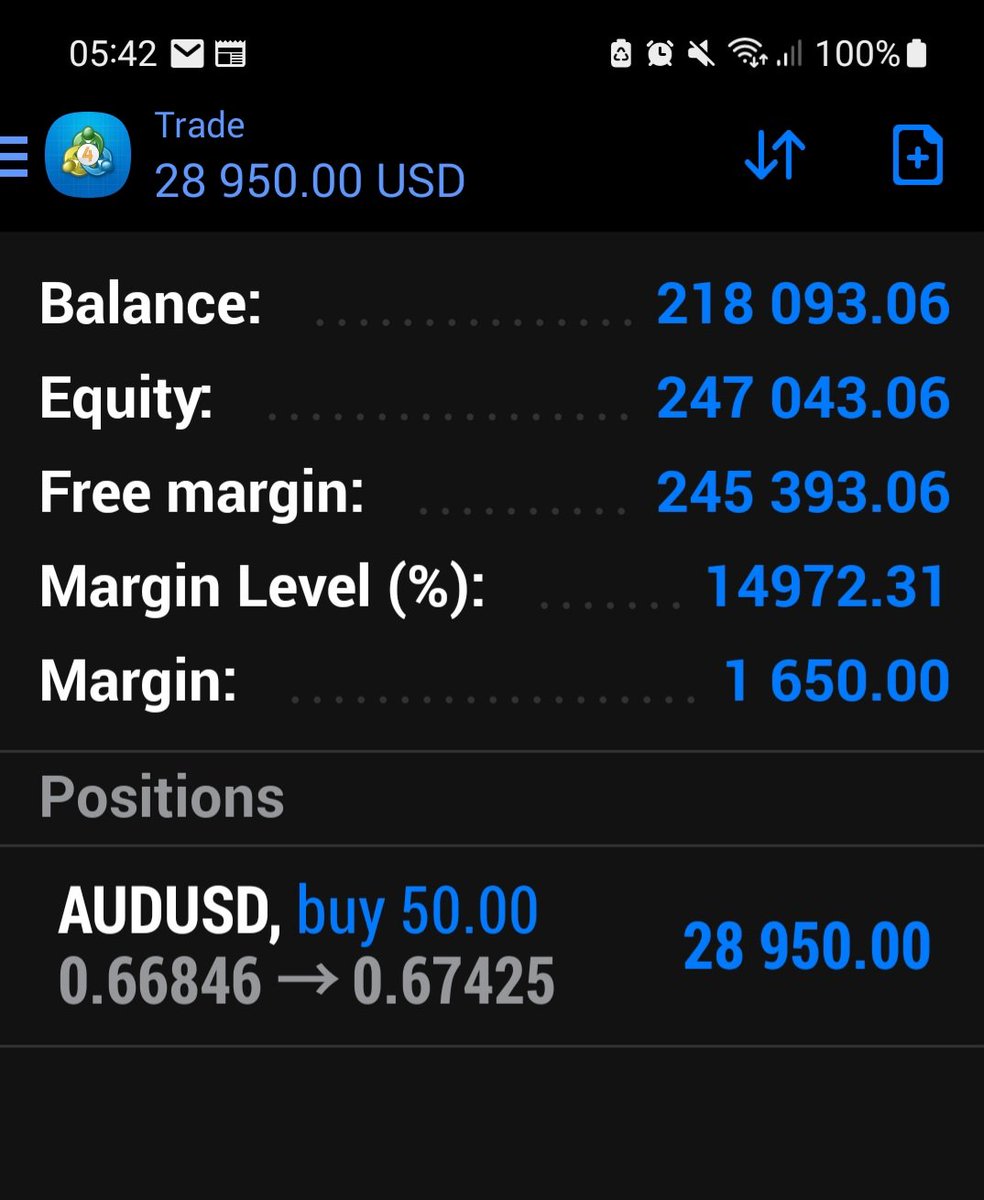
Another decent profit in less than 24 hours....
Opened on AUDUSD 22 March 2023...after 18 hours the profit speaks for itself -
This is how you create sustainable profit
When you can measure the price position on ANY time chart TO the real time GMT position - then there is no limit to the profit you can make and sustain - its endless profit -
Opened BUY on AUDUSD last Friday 10th March at 6pm GMT....at 15,45 pm GMT today - profit sits around $52,350.00...
Thats how you make profit in less than 24 hours trading...
REMEMBER each Time chart is NON LINEAR in movement to the next time chart - *Example* : the 5 minute chart is NON LINEAR in movement to the 15 minute chart, making the 15 minute chart LINEAR in movement...
When you can measure time on a chart then the amount of profit you can make is endless - IF you only measure movement on a chart then the amount of money you can lose is endless -
In simpler terms when trading a chart you are trading TIME to profit - unless you understand and follow the TWI (time weighted index) - its 95% guessing and 5% luck to making CONTINOUS profit - for most people its almost impossible to create sustainable profit -
If you line up any 1,000 traders and ask them what causes and makes the price to move on ANY chart - not one of the 1,000 traders will know the correct answer - not one....mind boggling....
@Cryptoabund4nc3 The origin of all price movement is time - from GMT 00:00 every year,...GMT 00:00 every day....with forward correlation of algebraic algorithms -
@Cryptoabund4nc3 No....it was not meant WHO moves price movement....BUT WHAT moves price movement...2 different questions....your answer is a conclusion.....passive to the question of "what"
REMEMBER: The NON LINEAR 1 minute chart correlates as LINEAR in the 5 minute chart - the NON LINEAR 5 minute chart correlates as LINEAR in the 15 minute chart - the NON LINEAR 15 minute chart correlates as LINEAR in the 30 minute chart..etc..etc..
This is how price moves -
REMEMBER, All the Time Charts get their price instruction and movement from the 1 MINUTE chart - it is the boss - when you can CORRELATE that price movement FORWARD, then you have control to make profit -