EUR/USD – Apr 10, 2026: Break above EMA 200 confirms formation of an uptrend
• Timeframe: 4H
• Current trend: Uptrend
TECHNICAL ANALYSIS
• Price has broken above the key resistance at 1.1650 and moved above the EMA 200, confirming a shift into an uptrend. If bullish momentum continues, the next target could be the Mar high at 1.1835. On the other hand, if a corrective move occurs, price may retest potential support zones around 1.1650 or the EMA 200 area near 1.1600.
👉 Read more (https://t.co/yEWv8YZfuS)
Disclaimer: Trading CFDs carries significant risk to your capital!
———————————
#FotiMarkets #TradingforSaving
XTI/USD – Apr 10, 2026: Sharp decline returns price to the gap zone
• Timeframe: 4H
• Current trend: Uptrend
TECHNICAL ANALYSIS
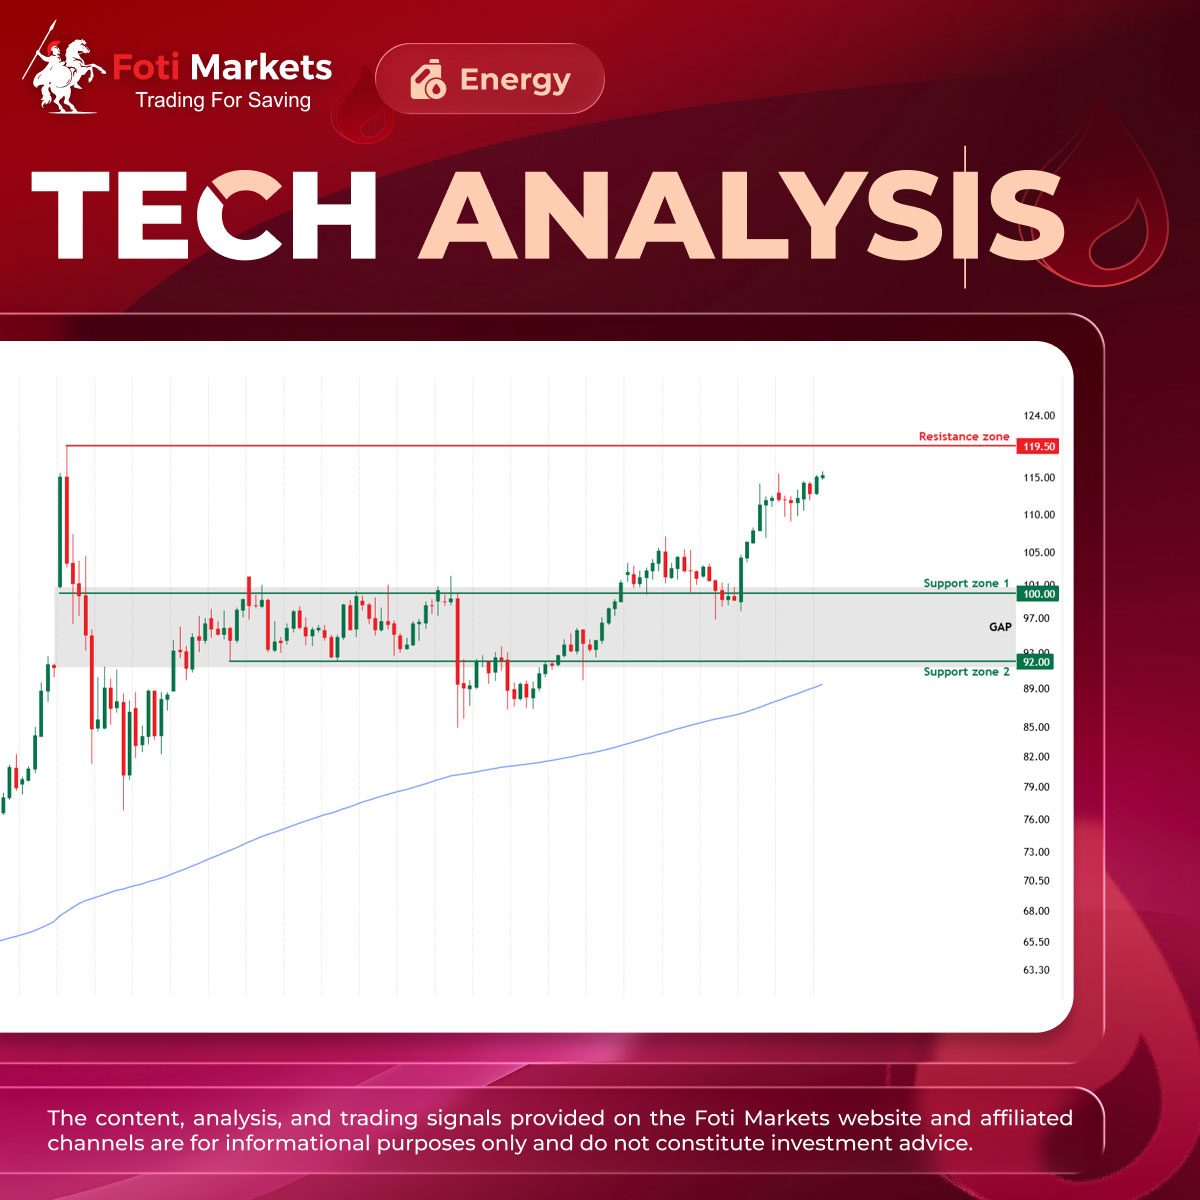
• After approaching the key resistance at 119.50 on Mar 30, the market faced strong selling pressure, driving price sharply lower toward the lower boundary of the previous gap around 92.00. This area also aligns with the EMA 200, acting as an important dynamic support where price may find buying interest and rebound. At this stage, traders should closely monitor price action to determine the appropriate trading strategy.
👉 Read more (https://t.co/DcL8uqirI6)
Disclaimer: Trading CFDs carries significant risk to your capital!
————————————
#FotiMarkets #TradingforSaving
NZD/USD – Apr 09, 2026: Breakout from range confirms continuation of downtrend
• Timeframe: 4H
• Current trend: Downtrend
TECHNICAL ANALYSIS
• After declining to the 0.5680 area, price rebounded and is now approaching the EMA 200 around 0.5850. This dynamic resistance may cap the upside, so traders should closely monitor price action here to determine the next move. If price breaks above the EMA 200, the market may extend the rebound toward the key resistance at 0.5890, a critical level for a potential shift in market structure.
👉 Read more (https://t.co/x4SzQ1Ufvi)
Disclaimer: Trading CFDs carries significant risk to your capital!
————————————
#FotiMarkets #TradingforSaving
ETH/USD – Apr 09, 2026: Uptrend confirmed, pullback offers buying opportunities
• Timeframe: 4H
• Current trend: Uptrend
TECHNICAL ANALYSIS
The market has broken above last week’s resistance around 2,165, confirming the formation of an uptrend. Currently, price is pulling back to retest the recently broken level. At this area, buying pressure is likely to re-emerge. In the case of a deeper correction, the next potential support lies around 2,060.
👉 Read more (https://t.co/9lvrKxVFd1)
Disclaimer: Trading CFDs carries significant risk to your capital!
————————————
#FotiMarkets #TradingforSaving
GBP/USD – Apr 07, 2026: Downtrend persists, testing the 1.3170 support
• Timeframe: 4H
• Current trend: Downtrend
TECHNICAL ANALYSIS
• Price remains below the EMA 200, reinforcing bearish pressure in the medium term. Over the past week, price has repeatedly tested the 1.3170 support area. A decisive break below this level could lead to a further extension of the downtrend. In this context, an uptrend would only be confirmed if price breaks clearly above the key resistance at 1.3350.
👉 Read more (https://t.co/Lm4AHC3jiT)
Disclaimer: Trading CFDs carries significant risk to your capital!
————————————
#FotiMarkets #TradingforSaving
XTI/USD – Apr 01, 2026: Approaching key resistance, profit-taking pressure increases
• Timeframe: 4H
• Current trend: Uptrend
TECHNICAL ANALYSIS
• After moving sideways within the gap range formed on Mar 09, XTI/USD recorded a breakout on Mar 30. Currently, price is approaching the key resistance at 119.50, the highest level of Mar 2026. As price tests this area, the likelihood of profit-taking pressure increases. Therefore, traders should closely monitor price action here to assess market reaction before making trading decisions.
👉 Read more (https://t.co/5jus02PDZQ)
Disclaimer: Trading CFDs carries significant risk to your capital!
————————————
#FotiMarkets #TradingforSaving
BTC/USD – Apr 06, 2026: EMA 200 continues to act as key dynamic resistance
• Timeframe: 4H
• Current trend: Downtrend
TECHNICAL ANALYSIS
Last week, BTC/USD recorded a strong rally toward the end of the week, bringing price closer to the EMA 200 dynamic resistance. This is a critical area that may determine a shift in market structure. If price breaks decisively above the EMA 200, an uptrend is likely to form. Conversely, if selling pressure re-emerges at this level, the downtrend is likely to continue.
👉 Read more (https://t.co/rvdavOLnmw)
Disclaimer: Trading CFDs carries significant risk to your capital!
————————————
#FotiMarkets #TradingforSaving
AUD/USD – Apr 06, 2026: Market correcting after a strong decline
• Timeframe: 4H
• Current trend: Downtrend
TECHNICAL ANALYSIS
• Over the past two weeks, AUD/USD has been moving steadily within a descending channel, forming a structure of lower highs and lower lows. Price remains below the EMA 200, indicating that the primary trend is still dominated by selling pressure. In this context, traders should prioritize trend-following positions to minimize risk.
👉 Read more (https://t.co/djeVnn5XdQ)
Disclaimer: Trading CFDs carries significant risk to your capital!
————————————
#FotiMarkets #TradingforSaving
🇦🇺🇨🇦
AUD/CAD – Apr 01, 2026: Testing resistance, consolidation range may expand
• Timeframe: 4H
• Current trend: Downtrend
TECHNICAL ANALYSIS
Over the past week, price has been consolidating within the 0.9510 – 0.9630 range. Currently, price is retesting the 0.9630 resistance area, which also aligns with the EMA 200. A decisive breakout above this zone could invalidate the current consolidation structure, opening the way for further upside toward the Mar 2026 high around 0.9750.
👉 Read more (https://t.co/Y7gRejelbH)
Disclaimer: Trading CFDs carries significant risk to your capital!
————————————
#FotiMarkets #TradingforSaving
EUR/USD – Apr 01, 2026: Price trading below EMA 200
• Timeframe: 4H
• Current trend: Sideways
TECHNICAL ANALYSIS
The market has shifted into a sideways phase since early Mar 2026. Given that the prior trend was bearish and price remains below the EMA 200, the current phase is likely a consolidation before a potential breakout in line with the main trend. However, the 1.1440 area is also a key historical support, where a strong bullish move originated in late Aug 2025. Therefore, a price reaction at this level cannot be ruled out, with the potential for a technical rebound if buying pressure returns.
👉 Read more (https://t.co/1hBqi4ii1e)
Disclaimer: Trading CFDs carries significant risk to your capital!
————————————
#FotiMarkets #TradingforSaving
ETH/USD – Mar 31, 2026: Price hovering around EMA 200, awaiting a breakout
• Timeframe: 4H
• Current trend: Downtrend
TECHNICAL ANALYSIS
After approaching the key support at 1,920, ETH/USD recorded a strong rebound, pushing price back toward the EMA 200 area around 2,100. However, the primary trend remains bearish, suggesting that the current upward move is likely a technical correction following the support reaction, before potentially resuming the main downtrend.
👉 Read more (https://t.co/6Tonlw2xVX)
Disclaimer: Trading CFDs carries significant risk to your capital!
————————————
#FotiMarkets #TradingforSaving
🇦🇺🇯🇵
AUD/JPY – Mar 26, 2026: Market correcting within a descending channel
• Timeframe: 4H
• Current trend: Uptrend
TECHNICAL ANALYSIS
• After forming a peak around the 114.00 area, the market entered a corrective phase within a descending channel. Price is currently approaching the lower boundary, which coincides with the key support level at 110.13. A decisive break below this level would confirm a shift into a downtrend. If selling pressure continues and the correction deepens, the next potential support lies at 108.80. Conversely, if buying interest returns, the market may continue to move within the channel.
👉 Read more (https://t.co/qj4WWtxdpm)
Disclaimer: Trading CFDs carries significant risk to your capital!
————————————
#FotiMarkets #TradingforSaving
ETH/USD – Mar 26, 2026: Price consolidates around EMA 200, awaiting a breakout
• Timeframe: 4H
• Current trend: Uptrend
TECHNICAL ANALYSIS
• After reaching the 2,400 level, ETH/USD faced strong selling pressure and declined steadily over the past week. By Mar 23, the downside momentum slowed, followed by a technical rebound. Currently, price is fluctuating around the EMA 200, reflecting a temporary balance between buyers and sellers. In this context, if price holds above the 2,020 support level, the market may retest the 2,230 resistance. Conversely, a break below 2,020 could lead to an extension of the downtrend.
👉 Read more (https://t.co/74MwHagPwL)
Disclaimer: Trading CFDs carries significant risk to your capital!
————————————
#FotiMarkets #TradingforSaving
EUR/GBP – Mar 25, 2026: Sideways consolidation below EMA 200, downside pressure remains dominant
• Timeframe: 4H
• Current trend: Sideways
TECHNICAL ANALYSIS
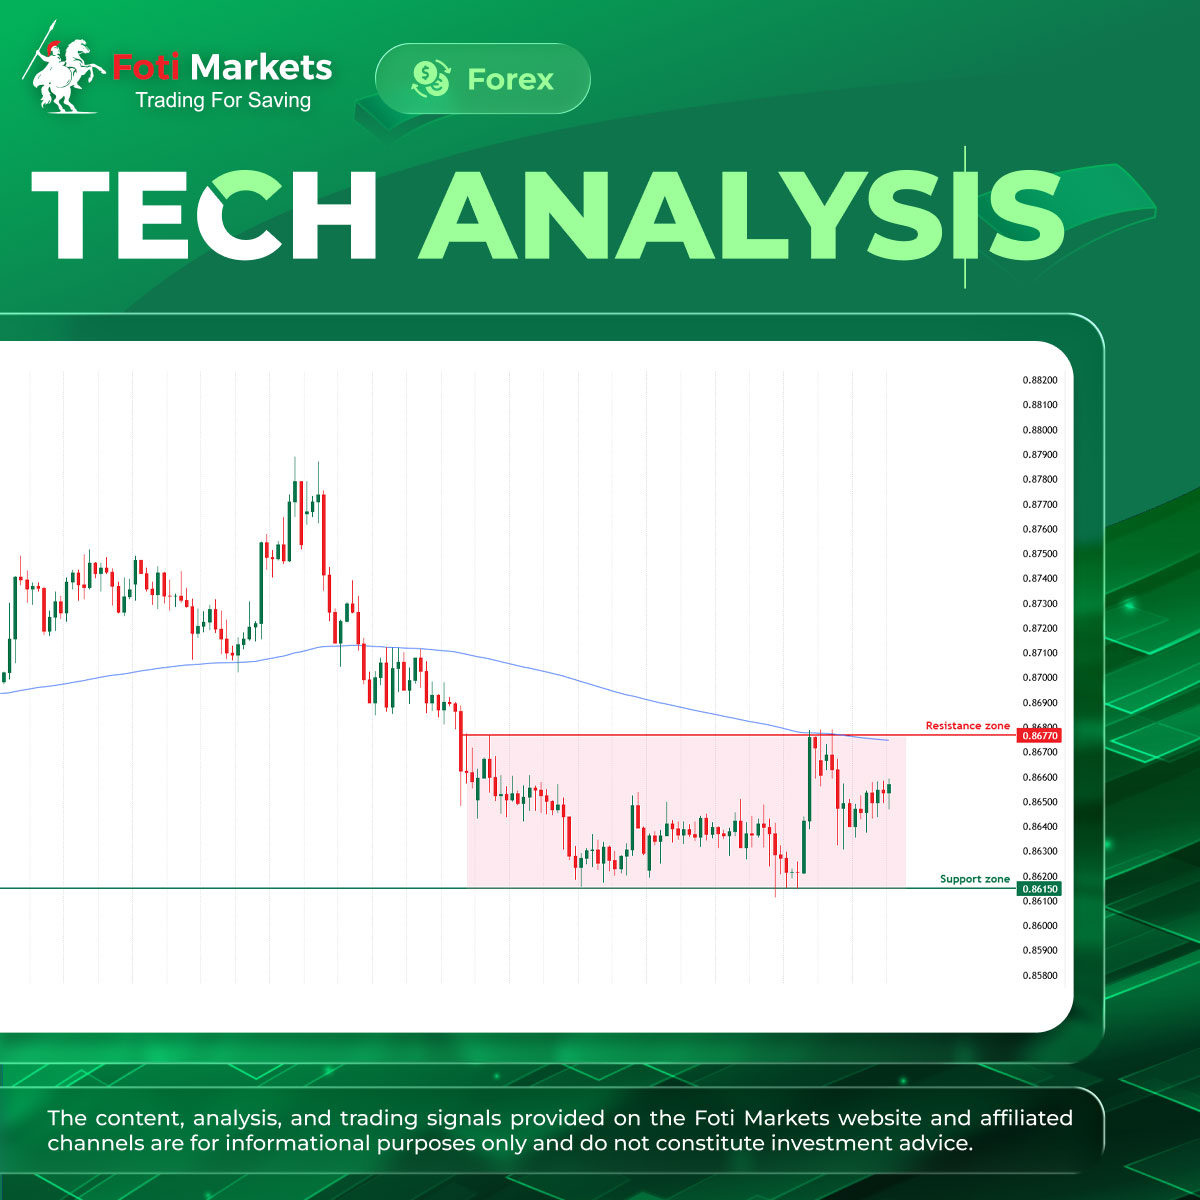
• The market has shifted into a sideways phase since early Mar 2026, fluctuating within the range of 0.8615 – 0.8677. This price action suggests a consolidation phase, likely preceding a continuation of the prevailing downtrend. Price remains below the EMA 200, reinforcing bearish pressure in the medium term. In this context, an uptrend would only be confirmed if price breaks decisively above the key resistance level at 0.8677.
👉 Read more (https://t.co/g5oX9QVtbb)
Disclaimer: Trading CFDs carries significant risk to your capital!
—���——————————
#FotiMarkets #TradingforSaving
GBP/AUD – Mar 25, 2026: Breakout above key resistance confirms uptrend
• Timeframe: 4H
• Current trend: Uptrend
TECHNICAL ANALYSIS
• After moving within a descending channel, on Mar 21, 2026, GBP/AUD broke out strongly above the channel. Notably, price has fully moved above the key resistance zone at 1.9100 and the EMA 200, thereby confirming the formation of an uptrend.
👉 Read more (https://t.co/vVD3VVNlLI)
Disclaimer: Trading CFDs carries significant risk to your capital!
————————————
#FotiMarkets #TradingforSaving
EUR/NZD – Mar 24, 2026: Market breaks out of the sideways consolidation, uptrend confirmed
• Timeframe: 4H
• Current trend: Uptrend
TECHNICAL ANALYSIS
• After a consolidation phase lasting more than a month, on Mar 21 the market began to record increased volatility as price broke above the previous consolidation range. This development indicates that buying pressure is gradually gaining dominance. At the same time, the move above the EMA 200 along with the breakout of the key resistance at 1.9800 has confirmed the uptrend.
👉 Read more (https://t.co/W7MIfhnXok)
Disclaimer: Trading CFDs carries significant risk to your capital!
————————————
#FotiMarkets #TradingforSaving
USD/JPY – Mar 24, 2026: Market consolidates sideways, offering range trading opportunities
• Timeframe: 4H
• Current trend: Sideways
TECHNICAL ANALYSIS
• USD/JPY has been in a sideways consolidation phase over the past two weeks, fluctuating within a narrow range between 157.40 and 160.00. Currently, price is approaching the lower boundary of the range. In this context, traders may consider looking for opportunities using range-trading strategies. However, caution is needed as false breakouts may occur before the market establishes a clear trend.
👉 Read more (https://t.co/SJi3IbHYZd)
Disclaimer: Trading CFDs carries significant risk to your capital!
————————————
#FotiMarkets #TradingforSaving
Trading is not easy!
Turning trading into a stable, long-term career is even harder!
Many traders have the skills but lack the capital and the right environment to grow.
With Foti Funds, skilled traders have the opportunity to:
💰 Earn a fixed monthly salary
💰 Trade with capital of up to $400,000
💰 Focus entirely on strategy, discipline, and performance
No pressure from risking your own capital.
No unnecessary barriers holding you back.
All you need is discipline, strong risk management, and consistent performance.
If you're ready to take the next step and trade like a professional, this opportunity is for you.
👉 Discover how to become a Strategic Trader with Foti Funds today: https://t.co/qtCWCbzLN1