Why has Solana’s ETF seen steady inflows—now $500M—despite the crypto downturn since late October?
BTC and ETH ETFs saw daily outflows, CME SOL OI fell nearly 4M, and it doesn’t look like arbitrage. Who’s buying? What’s driving this demand?
Daily Market Analysis — BTC Regarding the BTC chart, the core idea that Sugar Bro has been emphasizing over the past 5 days is: After a sharp drop and oversold condition, the chart will see a rebound, but this rebound will be limited to a small range and is not a direct starting point for an upward move; on the contrary, one should also beware of a secondary pullback after a slight retracement.
To quote from yesterday's ETH article, this volatility pattern features limited gains, no fast drops, poor stability, and suggests reducing operations or holding periods.
From the actual price action, after the price broke below the lower rail of the downward channel (88,000), there have already been 2 upward retracements, with both retracement highs being rejected at 88,000. Above this level is also the divergence zone on the short side after repairing the oversold condition; even if it rises, the sustainability and expected height are both limited, making it more suitable to wait for an initial push higher, confirm the space and stability, and then engage in high sells and low buys within it (details see Figure 1).
From the 12H to daily chart perspective, the price is in an obvious corrective rebound on the short side after being oversold; up to 88,000, the chart can be considered to have completed the repair of the oversold portion, meaning the current price has returned to the suppression brought by the downward trend.
The primary consideration is potential callback moves, followed by connecting to the first-up-then-down pattern shown in Figure 1. (Details see Figure 2) At this position, whether it's a secondary pullback or a retest after recovery, due to the large drop in the early stage and no retracement confirmation against the 100,000 mark, whether it's a direct retest or a breakout style, the subsequent chips will inevitably be after the easing of the downward structure; everyone can use a mid-term approach to game around the 98,000~102,000 area depending on the situation.
From the 4H chart perspective, this cycle that connects higher and lower timeframes does not play a role in linking the chart, but from this cycle's view, the price is in a retracement on the short side, and the K-lines entering the short side are orderly in advance and retreat, indicating that the bulls are densely resisting. Since it's on the short side, it can only be gamed in an aggressive single mode.
From the 1H and lower timeframe perspectives (24H chart), the bottom is easing and lifting, but the bull-bear intertwined structure is obvious; this level has no independent directional guidance for the trend, and the operable space it provides is relatively narrow, limited to fast in and fast out while staring at the disk, mainly hanging away segments. (Details see Figure 3) Aggressive single: Enter at current price 87,221~86,369, stop loss 85,300 (1H body, or exit cost after retracement upon arrival), take profit reference short-term suppression (principle of taking profit once established), small timeframes have no upward structure, friends seeking stability don't need to do aggressive singles, I'm also gambling.
Short-term support 84,300~82,869 (if local sharp drop, hang 82,869~80,888, the former space is very small, fast in fast out), second support area 78,850~75,360 is not the current area, long-term 1:2 can hang. 69,500 and below long-term can hang (luck single) Short-term suppression 92,680~94,360 (after arrival, retest 90,300~88,888 can be done), long-cycle pattern suppression 97,777~101,400. #BTC
Short-term BTC setups rely more on execution than direction here. When volatility compresses on weekends, liquidity thins and fake breakouts increase. Prioritize reactive trades at key levels rather than predicting moves.
Market Update—BTC
On the weekend market, institutions and professional traders are almost all on holiday, so volatility is usually relatively flat. In the current market, there are sufficient pullbacks across all levels, but from yesterday's low point to the current position, the oversold parts at the smaller levels have already been repaired.
Therefore, it is feasible to reserve room for high selling on the upside, but there is no need to directly gamble on an upward move. It is recommended to do it again at a position slightly below yesterday's short-term support.
Short-term support 81500~80600 (watch the market for quick entry and exit), short-term resistance 86830~88050 (do not trade on breakout style), Second support and other idea details, please review the previous text. #BTC
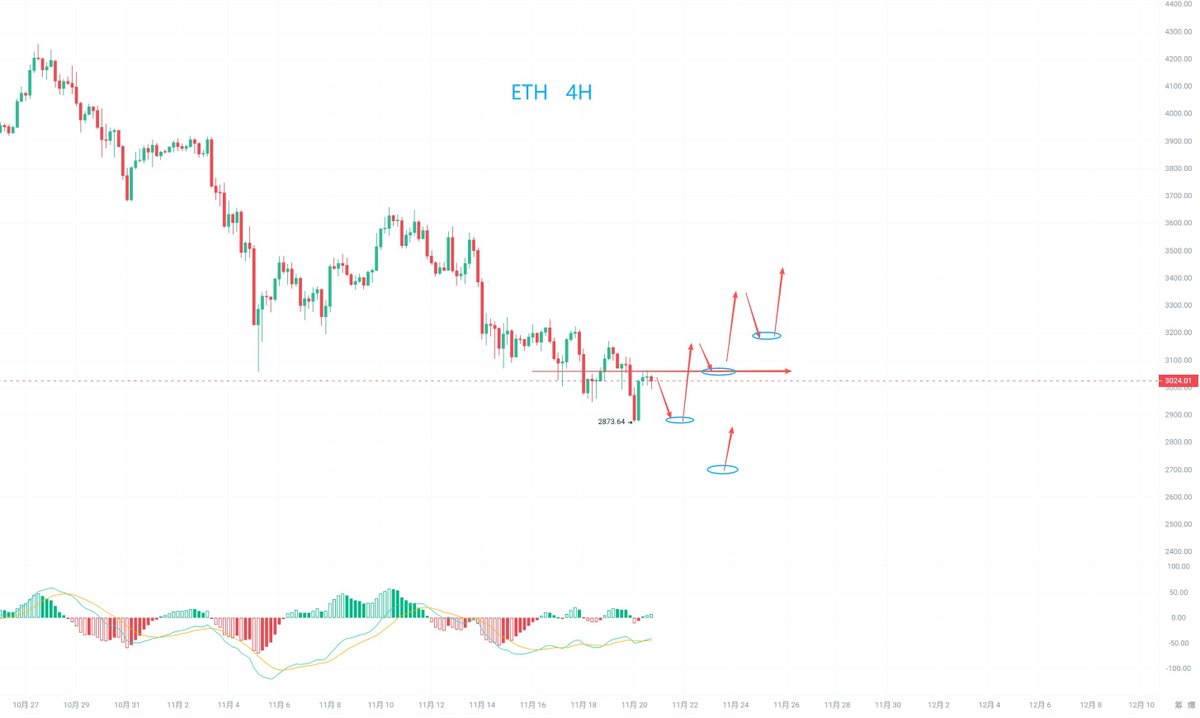
Since the 17th, ETH’s broader price range has barely changed, so the overall view remains largely in line with the previous update. While the market has built up meaningful downside pressure since mid-month, we still haven’t seen clear stop-loss absorption or bottoming signals, and the latest minor breakdowns keep the short-term trend weak. For now, buying near lower ranges remains the main idea.
Key levels stay the same: aggressive support lies at 2910–2861 (slow declines are acceptable, but fast moves require quick entries and exits). Short-term support remains at 2767–2690, and 2577–2490 can be used for speculative orders. On the upside, major resistance is at 3333–3430, with short-term resistance at 3190–3260. Avoid directly betting on a breakout; consider longs only if price breaks short-term resistance with volume or forms a clear bottom neckline.
Overall, this is not an ideal environment for large positions. Lower trading frequency, reduce expectations, and wait for volatility expansion before considering larger setups. Refer to the chart for structural details.
<Bull-Bear Cycle Line> Update!
On the 5th of this month, Sugar Bro updated the Bull-Bear Cycle Line, indicating that the market is still on the long side. Unlike previous periods, the update on the 5th specifically pointed out that the market only supports long positions for short-term trades after a space-type pullback, specifically low longs. At the same time, the high-sell low-buy points mentioned in articles from the previous few days also arrived as scheduled and proceeded sequentially.
This update is happening so quickly because there has been a principled change in the trend. Details are as follows:
First, since the price broke through the double lines on March 18, 2023, this is the first time in nearly 1000 days that the price has fallen below the double lines. Second, through this indicator, combined with the views in the article at 5:30 PM, this serves as a secondary content supplement.
1. The first break below the double lines is not scary. In such situations, after the downward probe ends, it usually can still pull back upward. What is scary is if during the secondary pullback, the price still fails to recover, and as the oscillation time prolongs (trends generally last 2-3 months), the double lines form a dead cross downward. At that time, the balance between longs and shorts will completely shift. This is the strategic vigilance that everyone must have next.
2. During the secondary pullback process, the 95200~99750 area is the main source of subsequent selling pressure and the primary battleground for both longs and shorts. In the short term, after a large-scale drop with consecutive falls, there is indeed a demand for an upward pullback, but this pullback is on the short side. Whether in terms of space or sustainability, one should not expect too much.
3. In terms of trading psychology, for this potential short-term pullback, it's best to wait for opportunities that go down first and then up in smaller timeframes. For the overall pattern after the breakout, don't guess in advance; just understand the systemic risks if it doesn't recover, and check other points in daily updates.
See the chart for details. #BTC
“When the moon is full, it begins to wane; when water reaches the brim, it spills over. Everything reverses once it reaches an extreme — emotions behave the same way. When pressure builds to the limit, it often erupts into a powerful counterforce.
It feels like now, every time we open our accounts, the numbers are lower again. Fear gauges are flashing deep red. Actually… many of us probably don’t even have the courage to open our accounts anymore.
(Figure 1)
Are we getting close to the limit? Maybe not far.
Based on on-chain data, Bitcoin’s Percent Supply in Profit (PSIP) 7-day average has dropped below 70%. This means nearly 30% of the entire supply is now in loss after the recent drawdown. If we exclude dormant coins, lost coins, and Satoshi-era BTC, the real percentage likely exceeds 40%.
Over the past decade, during the first major drop of every bull-to-bear transition, PSIP typically hits this zone before a strong rebound driven by extreme emotional stress — as seen in 2018 and again in 2020, when the market also faced the May-19 black swan.
But let’s be clear — that rebound is often just a rebound.
There are too many holders waiting to sell into any strength. That’s why I still maintain: to truly rebuild confidence, it will take months, not days.
A quick note on other assets:
ETH-PSIP sits at 59% (41% of supply in loss).
In September 2024, ETH-PSIP was 67%, yet the price then was $2,300 — higher than today.
SOL-PSIP is 21% (79% in loss).
In June 2023, SOL-PSIP was exactly 21%, but the price was $15.
Yes — you read that correctly.
What does that imply? I’ll leave that for you to think about.
Sponsored by @Bitget | Bitget VIP: lower fees, stronger benefits.”
Nuclear-backed mining highlights a growing search for stable, low-cost energy sources. As countries reevaluate currency exposure, Bitcoin’s role as a neutral, globally transferable asset becomes more strategically relevant.
Belarus is increasing its crypto-mining capacity using nuclear-powered energy, positioning the country to support large-scale mining operations.
The expansion comes as several regions explore Bitcoin amid broader de-dollarization trends.
Stablecoin-powered credit markets are evolving quickly. When liquidity can move globally within minutes, traditional lenders face pressure to match speed and flexibility — signaling a structural shift in cross-border financing.
Tether has allocated $1.5 billion toward commodity trade lending, using USDT to provide faster settlement and credit access across international markets.
The initiative positions stablecoin-backed financing as a direct alternative to traditional bank channels.
#USDT#Lending
Fusaka is ready for mainnet 🌃🎉!
It will activate at slot 13,164,544, on December 3, 2025, 21:49:11 UTC. The fork introduces PeerDAS, a significant scaling milestone, as well as a slew of other EIPs. More info below 👇
The convergence of Bitcoin mining and AI infrastructure is accelerating. Firms like TeraWulf are evolving from pure miners into hybrid compute providers — a model that may define the next phase of digital infrastructure growth.
TeraWulf reported an 87% year-over-year surge in Q3 revenue, reaching $50.6 million, driven by stronger
Bitcoin prices and expanding revenue streams from its AI-focused infrastructure business. #Bitcoin#Mining#AI
(2)A decline in BTC dominance doesn’t always guarantee an altcoin rally — timing depends on liquidity conditions and investor sentiment.
Watching ETH/BTC and total market cap excluding BTC remains the clearest signal.
(1) Bitcoin’s dominance in the crypto market has begun to soften, suggesting capital rotation toward major altcoins may be underway. Traders are closely watching ETH and mid-cap assets for early signs of an altseason shift. #Bitcoin#Altcoins
Mining downturns often act as natural reset points for the network. When inefficient operators exit, hash rate stabilizes and stronger miners consolidate — restoring balance ahead of the next market phase.
Bitcoin’s mining sector faces mounting pressure as profit margins fall to multi-month lows.
Rising energy costs and declining block rewards are prompting some miners to scale back operations or temporarily suspend rigs.
#Bitcoin#Mining