Exciting 🥳
I recently wrapped up an insightful analysis on the RuthKadiri247 YouTube channel, [a movie channel I love and follow consistently] diving deep into the metrics and audience engagement for their captivating movie content. 🎬
Check it out on:
https://t.co/GbcxsVMLh1
Check out my latest project👇
BUILDING A DATA-DRIVEN FUTURE FOR BREW AND CRUST CAFE: A JOURNEY FROM MANUAL PROCESSES TO SMART INSIGHTS
USING SQL
https://t.co/dbrucUZTNs
Compiled a comprehensive report using Microsoft Power BI that analyzes sales data from six retailers offering five Adidas products over the last two years. This analysis reveals valuable key insights on products sales.
https://t.co/P7qq89KWqD
This week at TDI, I created a Dashboard for Urban Scape to track it's employees per count, gender, location and job title using Visualizations and dash-boarding techniques.
https://t.co/quZ4N5YZZL
I developed an HR Analytics Dashboard packed with powerful insights that bring clarity to key workforce metrics. From tracking all-time employee count and current headcount to analyzing terminations and termination rates, this dashboard is designed to help HR teams.
•Pivot tables for proper organization and summarization of insights.
•Insight generation or analysis to bring out the necessary insights needed for further enhancement of the human resource team.
•Filters, slicers and timelines to track specific metrics.
This week at TDI, Urban Scape needed to track it's employees per count, gender, location and job title using Visualizations and dash-boarding techniques.
So I created:
•Data Visualizations using Excel's diverse charting methods.
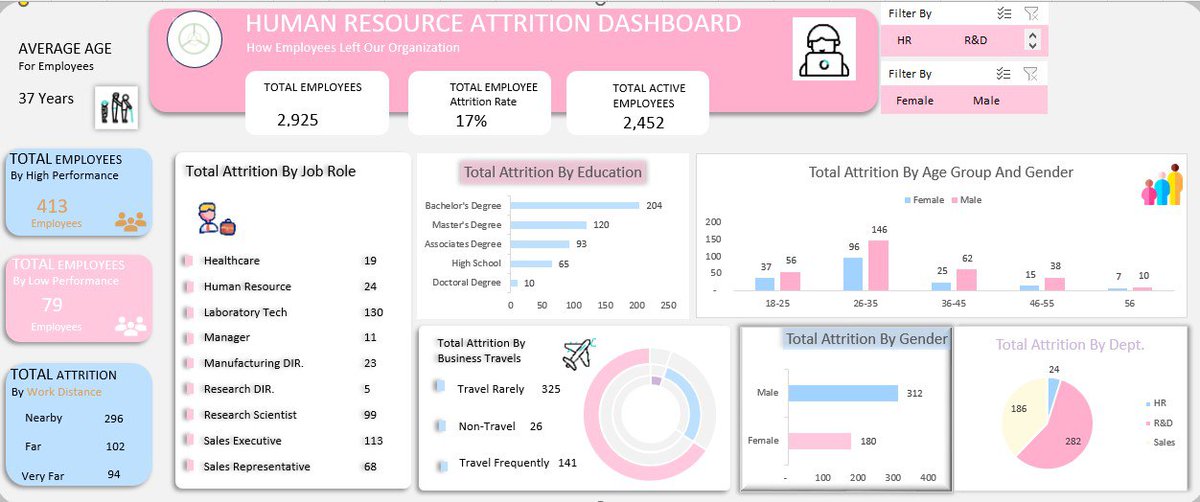
I created a "Human Resource Attrition Dashboard" beautifully coloured and well partitioned.
The purpose of this Dashboard is to derive the following insights:
Thread👇
•The total number of employees,both currently active and ex_employees.
•The total attrition rate by:
Job role
Department
High and Low Performance
Distance from home
Education
Gender
With an interactive filter based on department 🏬 and gender fields.
I created A Human Resource Attrition Dashboard beautifully coloured and well partitioned.
The purpose of this Dashboard is to derive the following insights:
Designing A Dimensional Model For Sales Analysis and SQL Queries.
Part B.
As Part Of My HNG Stage 5b Project,
We answered various business questions using an extended Sales Receipt Data using SQL.
View in full below:
https://t.co/zqryJIbh8T
As Part Of My HNG Stage 5b Project Part A....
We performed a comprehensive analysis of a car repair shop’s operations based on a sample invoice.
View in full below:
https://t.co/ZF9Y0QdBu9



![tec_aryan's tweet photo. 𝐀𝐥𝐥 𝐏𝐚𝐢𝐝 𝐂𝐨𝐮𝐫𝐬𝐞𝐬 (𝐅𝐫𝐞𝐞 𝐟𝐨𝐫 𝐅𝐢𝐫𝐬𝐭 𝟓𝟎𝟎𝟎 𝐏𝐞𝐨𝐩𝐥𝐞)😍👇
1. Artificial Intelligence
2. Machine Learning
3. Cloud Computing
4. Ethical Hacking
5. Data Analytics
6. AWS Certified
7. Data Science
8. BIG DATA
9. Python
10. MBA
(48 Hours only ⏰)
To get-
1. Follow @tec_aryan
2. Like & retweet [MUST]
3. Reply "Send" 🧲](https://pbs.twimg.com/media/GU4l-TSa4AMicJr.jpg)





