NVDA earnings on May 20:
4 ways to play it (bullish)
1. NVDA earnings run-up and swing through
June 5 $210 calls
2. NVDA swing into ER (risky)
May 22 $220 calls
3. NVDA scalp next day (no swing)
May 22 $220 calls on the dip (they will do well in earnings)
♻️ If you're interested in a play for SMALL ACCOUNTS, reshare this post and comment "HELP" and I'll DM it to you.
go pull up the 6AM candle on your chart right now
this one candle predicts the entire New York session direction
and almost nobody uses it
a guy in my discord called 14 out of 15 trading days correctly last month using only this
here's the exact system:
THE 6AM REVERSAL SIGNATURE:
at 6AM EST, institutions show their hand
they either:
- push price into a key level (reversal incoming)
- expand away from a level (continuation day)
the 6AM candle tells you WHICH
STEP 1: mark yesterday's high and low
STEP 2: at 6AM, watch where price trades relative to those levels
STEP 3: if 6AM sweeps a level but CLOSES back inside the range = reversal day
STEP 4: if 6AM expands and closes BEYOND the level = trend day
STEP 5: check the correlated asset. this is where it goes from good to undeniable
pull up NQ and ES side by side (or gold and silver, EUR and GBP - whatever you trade)
did BOTH assets sweep the same level at 6AM? or did one sweep while the other didn't?
both swept and closed back inside -> strong reversal signal. both assets agree. trade it with confidence
one swept, the other didn't -> even stronger. that's SMT. a crack in correlation. the asset that swept grabbed liquidity. the one that refused was already telling you the reversal is real before the candle even closed
one swept and the other closed in the OPPOSITE direction -> that's a two-stage SMT. strength switch. the highest probability confirmation you can have at 6AM. the direction isn't just "likely." it's confirmed across two independent assets
no crack at all, both assets just expanding through -> continuation day. don't fight it. only trade in that direction
that's it.
EXAMPLES:
6AM sweeps yesterday's high on NQ, closes back below it. you check ES - ES didn't even reach the high. crack in correlation. bearish day confirmed -> sell the rip at 9:30
6AM sweeps yesterday's low on gold, closes back above it. you check silver - silver swept the same low but closed bearish while gold closed bullish. strength switch. two-stage SMT -> buy the dip at 9:30 with maximum conviction
6AM breaks high and closes above with momentum on both assets -> no crack. continuation. only look for longs
most traders show up at 9:30 with no bias
they're "reacting to price action"
aka gambling
smart traders showed up at 6AM
they checked the candle AND the correlated asset
they already know the direction AND how confident to be in it
the 9:30 open is just their entry window
THIS IS THE EDGE:
institutions set up the move between 6-9:30
retail shows up at 9:30 and provides the exit liquidity
you can either BE the liquidity
or you can TAKE the liquidity
the 6AM candle tells you the direction
the correlated asset tells you if it's real
together they tell you which side you're on before the market even opens
go backtest it. 30 days. both assets side by side. track the results
you'll never trade blind again
(free discord in bio. if you think you're a good fit - DM me "SYSTEM" for 1-on-1 coaching. i only take on 1-2 traders at a time to work with fully private)
The futures market will literally tell you every reversal before it happens if you open one extra chart…
Not some $2,000 indicator. Not some guru's private Discord. A free chart that every broker shows you.
95% of traders have never done this. The 5% who know it are praying you never figure it out.
Here's what gurus don't teach retail traders:
Every single reversal in the market every one - has a specific signature that forms across two correlated assets before the move happens. It's called a two-stage SMT. And it's sitting right there on the chart next to the one you're already watching.
NQ and ES. Gold and silver. EUR and GBP. These are correlated assets. They make the same highs and lows at the same time. When they stop doing that - when one makes a new high and the other refuses to follow - institutions just told you the reversal is coming.
This is how institutions actually reverse the market. Not with one move. With two stages. And they leave the evidence on every chart, every day, for free.
The reversal signature that runs the entire market:
STAGE 1: SMT at the key level
Price approaches a significant level - previous day high, swing point, external range liquidity. One asset sweeps the level. The other asset DOESN'T. It fails to make the same high or low
That's the first crack. Institutions aren't committed to this breakout. They just needed the liquidity from the sweep to fill their orders on the other side
This alone tells you the move is probably fake. But "probably" isn't enough to risk money on
STAGE 2: Strength switch confirmation
This is where it gets undeniable. The asset that was stronger - the one making new highs, leading the move - suddenly closes a candle in the opposite direction. While the weaker asset closes bullish
That's the strength switch. The strong asset just turned weak. The weak asset just turned strong. Correlation is about to resume - in the NEW direction
When you have Stage 1 (crack at the key level) plus Stage 2 (strength switch confirming the crack), the reversal is confirmed before a single candle prints in the new direction on your main chart
That's the two-stage SMT. Two independent confirmations from two different assets telling you the same thing: this move is over. reverse is coming
Why this works:
Institutions can fake a breakout on one asset. They can sweep NQ above the previous day high to grab every stop loss sitting there
But they can't make ES commit to the same fake move at the same time. And they definitely can't make YM commit
When NQ breaks out and ES doesn't follow - that's one crack
When the candle that broke out closes bearish while the other asset closes bullish - that's the strength switch. Two cracks. Two assets telling you the same thing from two different angles
No indicator shows you this. RSI can't compare two assets. MACD can't detect a crack in correlation. Moving averages can't see a strength switch happening in real time across two charts
The two-stage SMT does. For free. On every broker platform. Every single day.
How to see it right now:
Open NQ and ES side by side. Or gold and silver. Or EUR and GBP
Wait for price to approach a key level on the higher timeframe. Previous day high. Swing point. Fair value gap
Watch what both assets do:
Both sweep the level together → no crack → no reversal signal → wait
One sweeps, the other doesn't → STAGE 1 confirmed → crack in correlation → now you're watching
The asset that swept closes in the opposite direction → STAGE 2 confirmed → strength switch → reversal is coming
Now drop to the lower timeframe. What do you see? The V-shape forming. Expansion into the level. Displacement away. Gap forms. That lower timeframe signature is just the two-stage SMT playing out on a smaller scale
The higher timeframe crack tells you WHAT is happening
The lower timeframe V-shape tells you WHEN to enter
Every reversal in the market has this. Go back on any chart. Find a real reversal. Check the correlated asset at the same moment
You'll find the crack every single time
And you'll wonder why you spent 3 years staring at one chart trying to decode reversals that the chart right next to it was screaming at you the entire time
The market isn't random. It's not manipulation. It's not chaos.
It's two assets constantly telling you what the other one is about to do. And 95% of traders never open the second chart.
Now you know. What you do with it is on you
(free discord in bio. i teach my whole system in there)
I lost everything 3 times before I wrote down these 7 rules. Haven't had a losing month since I started following them…
Every trader thinks they need a better strategy. Usually they need better CRITERIA for when to use the strategy they already have
Here's the exact checklist I run before every single trade:
☐ 1. CANDLE PROFILE CHECKED
Is the 4-hour candle I'm trading within supporting expansion?
Two things have to align. First - wick size. If the wick is large, it's a reversal candle. The body will be small. Any setup inside it is going to chop you up for 3 hours and stop you out. If the wick is small, the body has room to form. That supports expansion
Second - how is the candle forming? A bullish expansion candle opens low first. That's the fluid motion. Open, low, high, close. If it opens high first and then drops low, too much time is wasted in the manipulation phase. The profile doesn't support expansion even if the wick is small
You need both. Small wick AND opens in the right direction
Wrong profile = No trade
☐ 2. SESSION PROFILED
Did the previous session reverse or consolidate?
If London reversed - New York continues from a gap. Direction is already decided. I'm looking for continuation entries only
If nobody reversed - New York is the reversal session. I'm waiting for the 9:30 sweep
The 6AM candle confirms it. Sweep a key level and close back inside the range = reversal day. Expand through a level = trend day. Chop with no clear move = no trade day
No session clarity = No trade
☐ 3. CORRELATED ASSETS CHECKED
Do NQ, ES, and YM agree?
When price approaches a key level, I check all three assets. If NQ sweeps the high but ES and YM don't follow - that's an SMT. The breakout is fake. I'm looking for reversal entries
If all three sweep the same level - no divergence. I wait. No edge yet
If YM closes in the opposite direction at a key level while NQ pushes through - that's a strength switch PSP. Highest probability signal in the market
No SMT divergence at the key level = No trade
☐ 4. GAP SELECTED CORRECTLY
Is the fair value gap in the right zone?
Not just any gap. The gap has to be within the upper half of the previous candle's range for bullish entries. Lower half for bearish. Close proximity to the opening price of the higher timeframe candle
Why? If the gap is deep in the range and price retraces all the way down to fill it, that creates a large wick on the 4-hour candle. Large wick = no expansion. Your thesis is dead before the trade even starts
Mark the equilibrium of the previous candle. Your gap should be above it for longs, below it for shorts
Gap in the wrong zone = No trade
☐ 5. V-SHAPE CONFIRMED ON LOWER TIMEFRAME
When price hits the gap, do I see the V-shape signature?
Aggressive expansion into the key level. Sharp displacement candle in the opposite direction. New fair value gap forms. Price expands away
That's the V. Expansion in. Displacement out. Gap. Continuation
If price drifts into the gap sideways with overlapping candles and no displacement - the reversal is fake. You're about to get wicked out
No V-shape = No trade
☐ 6. LEVEL IS RELEVANT
Is the level I'm targeting a relevant swing or a failure swing?
If my target has three failure swings stacked before it, price is going to take all of them. That's not a target. That's a speed bump
The relevant swing is the extreme. The one with nothing beyond it. Valid separation from the previous swing. No stacked liquidity blocking the path
And on the stop loss side - my stop goes behind the sweep. Behind the gap. Behind the V-shape. If that level gets taken, my thesis is dead. Clean loss. Move on
No relevant target = No trade
☐ 7. MATH WORKS
Is the target at least 2.5R from my entry?
If the next relevant swing is only 1.5R away, the math doesn't work even with a 60% win rate. I need 2.5-3R minimum to make the edge compound over 100+ trades
60% win rate × 2.5R = 1.5R expected gain per trade
40% loss rate × 1R = 0.4R expected loss per trade
Net: +1.1R per trade
Over 100 trades that compounds. Under 2R it barely breaks even after fees
No 2.5R minimum = No trade
Most traders skip rules 1, 3, and 5. That's why most traders lose
They see a gap on the 5-minute, enter immediately inside a 4-hour candle that doesn't support expansion, never check the correlated assets, and wonder why they got wicked out
If they checked the candle profile FIRST, they'd skip 40% of losing days
If they checked SMT SECOND, they'd avoid every fake breakout
If they confirmed the V-shape THIRD, they'd only enter reversals that are actually real
7 rules. 30 seconds each. Run the checklist before every trade
Print this. Use it. Your account will thank you
(free discord in bio. Live every morning.)
"what timeframe do you trade?"
"5 minute"
wrong answer
you don't TRADE the 5 minute
you ENTER on the 5 minute
you TRADE the 4-hour
here's what most traders don't understand:
the 4-hour candle is the institutional playbook
it tells you:
direction (is the wick small enough to support expansion?)
profile (did it open low first for bullish or high first for bearish?)
phase (are we in the protraction phase forming the wick or the expansion phase forming the body?)
the 5-minute chart is just your entry tool WITHIN the 4-hour bias
i watched a trader take 14 trades in a week
11 of them were inside 4-hour candles that had large wicks
"but the 5-minute setup was clean"
bro
a clean 5-minute setup inside a 4-hour candle that doesn't support expansion is a high-quality way to lose money
the wick already told you. large wick = reversal candle. it's not going to expand. the body will be small. your target won't get hit. you'll chop around for 3 hours and get stopped out on a wick
here's the framework:
4H small wick + opens low first → expansion candle → look for longs on the lower timeframe
4H small wick + opens high first → expansion candle → look for shorts on the lower timeframe
4H large wick → reversal candle → don't trade this candle. wait for the next one. the NEXT 4-hour candle will expand
4H choppy with no clear profile → no trade
that's it
but there's a second layer most people miss:
what happened INSIDE the previous 4-hour candle matters
if the previous candle reversed - confirmed by a lower timeframe swing point - then this new candle opens within that reversal. it should continue. the direction is already set. you just enter the gap
if the previous candle expanded and you're in a new candle - you're looking for a retracement into a gap. that gap should be within the upper half of the previous candle's range. that's where the low of this candle forms
if the previous candle hit a key level but didn't reverse - then THIS candle needs to reverse off that previous candle's low. wait for the small wick. wait for the swing formation.
the 4-hour candle isn't just telling you direction. it's telling you the TYPE of day:
continuation from a gap
reversal from a key level
aligned re-entry within expansion
each one has a specific entry on the lower timeframe. each one has a specific stop. each one has a specific target
but none of them work if the 4-hour candle profile doesn't support it
my win rate went from 44% to 63% when i added this one filter
i wasn't getting better at entries
i was getting better at SKIPPING 4-hour candles that didn't support expansion
the 4-hour candle isn't a "confirmation"
it's permission to even look for a trade
no permission = no trade
Give me 4 minutes and I'll improve your trading skills by 200%.
I've been trading for 16 years.
Over 20,000 trades logged.
8 figures built from a $6,000 account.
Here's everything I know compressed into 4 minutes.
The biggest lie in trading:
“More is better.”
More trades.
More indicators.
More strategies.
More tickers.
I spent my first 3 years doing all of it.
The result?
- Wrong setups
- Analysis paralysis
- Chasing everything that moved
Then I stripped it all back.
3-5 tickers. One strategy. Major levels on the daily and weekly chart. Nothing else.
That's when things changed for the better
What support and resistance actually is:
Most traders think it's just lines on a chart.
It's not.
It's the market's memory.
Price remembers every level where a major transaction happened:
- Where the market reversed hard
- Where institutions stepped in
- Where big money exited
When price returns to those levels, the same participants react again.
That's human behavior and institutional positioning playing out the same way over and over.
Once you understand that, the chart stops being so random. It starts telling you a story.
How I draw my levels:
I start with the weekly chart. I look for areas where price made a large, violent reaction. Big sell-offs. Major reversals. Historic breakouts.
Those become my levels.
Then I drop to the daily chart to refine them.
I don't use exact prices. I use areas. Because the market isn't precise and if your level is too tight, you'll miss entries waiting for a number that never gets hit exactly.
Three to five levels maximum.
Clean chart. Clear mind.
The trade most people miss:
5 consecutive red days on NQ.
Everyone panics. Retail traders sell. I get ready.
Mean reversion in a bull market is one of the highest probability setups I know.
January 2025. 5 red days in a row.
I bought 100 lots at my level.
584 points later? $400K on one position.
I didn't predict that. But I did prepare for it.
Why patience is the actual strategy:
Most traders lose money because they trade in the middle of nowhere.
No reason to be in the trade.
Professional traders wait.
They let price come to them.
They sit on their hands for days, sometimes weeks, until the setup is undeniable.
I mark my levels on Sunday. I’m willing to wait all week for one trade, one level and full conviction.
That's discipline compounding over 16 years.
The psychological edge nobody talks about:
I withdraw every week.
Because seeing too much in the account changes how you trade.
You start feeling invincible and start sizing up.
You hold longer than you should. Then the market reminds you that you're not invincible at all.
Keeping the account at a number that feels normal keeps the head clear.
A clear head makes better decisions.
Better decisions made consistently over years is how $6,000 becomes multiple 8 figures.
The only thing standing between you and profitability:
It's not your strategy.
It's not the market.
It's not your broker.
It's time.
Year 1 you're learning.
Year 2 you're getting consistent.
Year 3 it all starts to make sense.
Most people quit in year 1.
I can undoubtedly say I’ve made it.
I'm not smarter than you. I just stayed longer than everyone who quit.
If you never quit then success is guaranteed over time.
Now go mark your levels and win.
SPY is at 708 and the market is sitting in a mixed, transitional gamma regime.
(Let me know if this HELPS by resharing post)
Net GEX is +1.48B.
Back to positive, but still relatively light.
This means dealers are providing some stabilization, but not enough to fully suppress movement. Expect controlled chop with directional potential, not full pin.
708–710 is your primary control zone.
You can see strong clustering around 705–708 earlier, now shifting higher. This is where price will rotate and decide direction.
Below, 702–705 is your key support band.
There is still notable negative GEX under price. If this breaks, moves can accelerate quickly lower due to weaker dealer support.
Above, 710–713 is your upside zone.
You have clear gamma building there, making it the next magnet if buyers stay in control.
Three scenarios:
Most likely: chop with slight bullish bias between 705–710.
Bull case: hold 708–710 → push into 712–713.
Bear case: lose 705 → accelerate to 702 → then 700.
Key levels:
Support: 705–702
Resistance: 710–713
What’s different now:
We are no longer in a clean trend or high-volatility regime. This is a hybrid market partial dealer support with room for movement.
Best setups:
Buy dips into 705–707 on reclaim.
Or wait for a clean break and hold above 710 for continuation.
Avoid trading the middle. That’s where hedging flows create noise.
708 is control.
713 is the upside target.
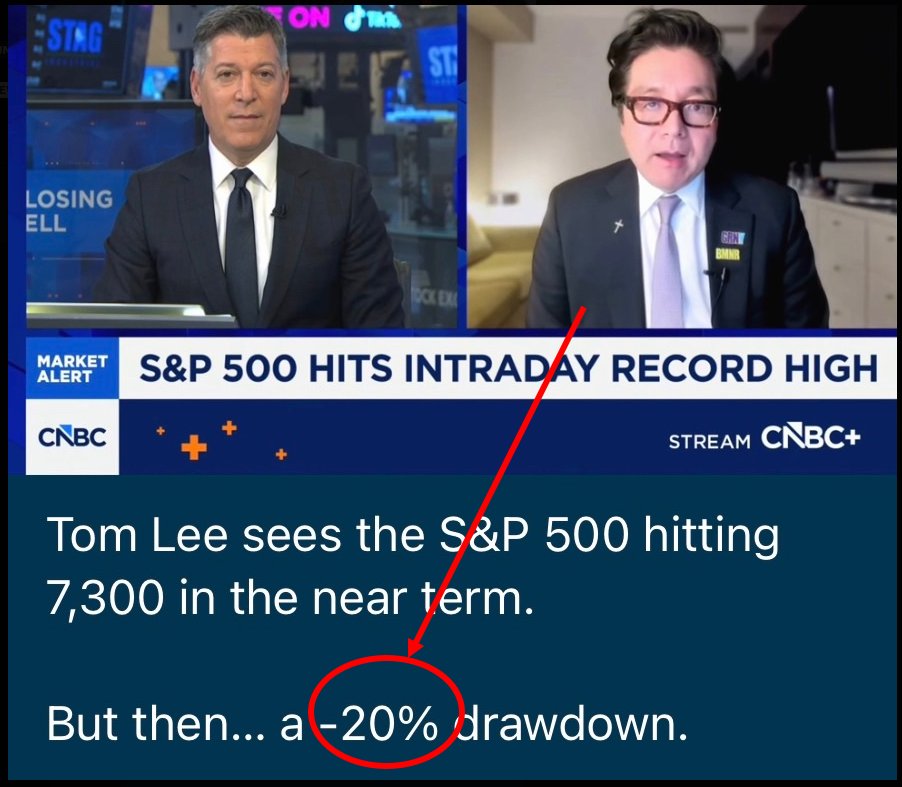
$730 is SPY target right now, but after it will crash 20% says Tom Lee to $580.
When ON SALE, I'd add these 20 stocks:
1. $IONQ – Quantum computing leader with massive asymmetric upside
Buy zone: $20–25 = early-stage value accumulation
2. $IREN – Cheap energy + AI compute = powerful margin expansion
Buy zone: $25–30 = strong support + cost advantage
3. $ASTS – Space-based telecom disruptor with global scalability potential
Buy zone: $65–70 = high conviction accumulation
4. $CRWV – AI data center REIT riding infrastructure demand wave
Buy zone: $70–75 = early positioning before scale
5. $GOOG (Alphabet Inc.) – AI + search dominance with strong cash flow engine
Buy zone: $150–170 = major institutional demand zone
6. $BE (Bloom Energy) – Data center power demand drives long-term growth story
Buy zone: $120–130 = prior base + demand zone
7. $COIN (Coinbase) – Crypto infrastructure with leverage to bull cycles
Buy zone: $130–140 = strong cyclical support
8. $AAPL (Apple Inc.) – Ecosystem moat + AI integration tailwinds building
Buy zone: $220–230 = long-term value zone
9. $TSLA (Tesla) – AI + autonomy optionality with massive upside
Buy zone: $280–300 = strong psychological support
10. $LITE (Lumentum Holdings) – AI data flow bottleneck driving explosive growth
Buy zone: $500–550 = momentum continuation base
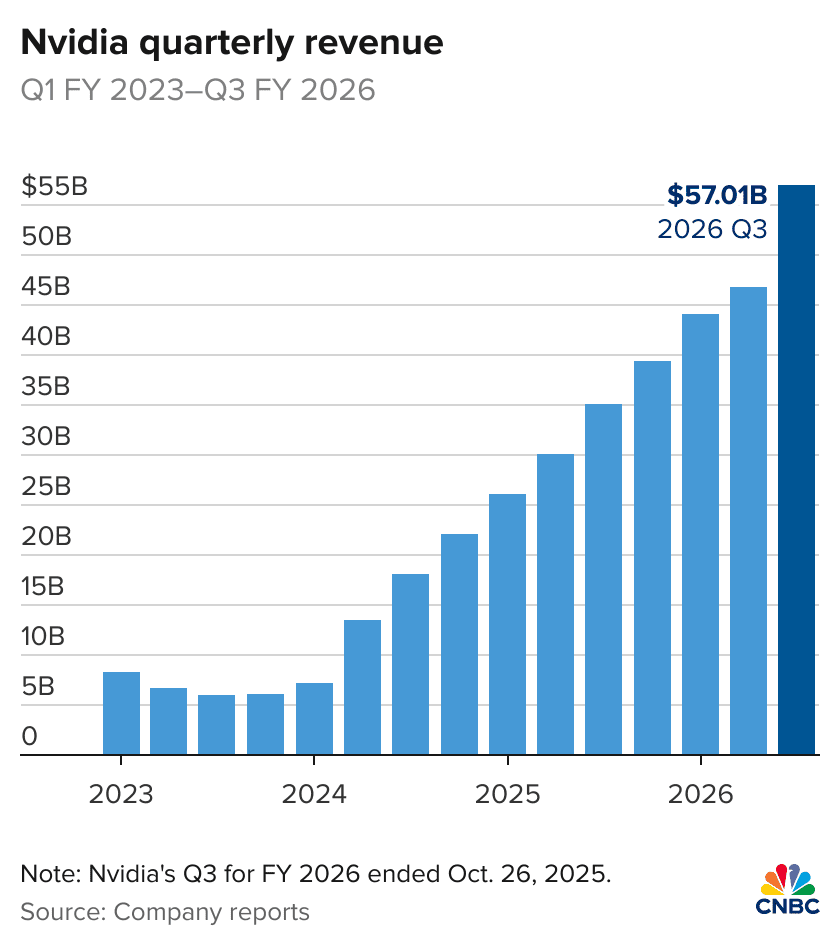
11. $NVDA (NVIDIA) – AI leader with unmatched demand and pricing power
Buy zone: $150–160 = institutional accumulation
12. $AMD (Advanced Micro Devices) – Competing in AI chips with strong upside leverage
Buy zone: $180–190 = breakout retest zone
13. $HOOD (Robinhood Markets) – Retail trading growth + monetization expansion
Buy zone: $60–65 = demand + growth inflection
14. $SOFI (SoFi Technologies) – Fintech scaling with improving profitability trends
Buy zone: $13–15 = early-stage base
15. $QS (QuantumScape) – Solid-state battery breakthrough potential long-term
Buy zone: $5–7 = speculative accumulation
16. $MU (Micron Technology) – Memory cycle + AI demand driving pricing power
Buy zone: $310–320 = cycle bottom support
17. $SNDK (Sandisk) – Storage demand surge from AI + data growth
Buy zone: $550–600 = structural demand zone
18. $ONDS (Ondas Holdings) – Private wireless + drone tech early growth phase
Buy zone: $5–6 = high risk accumulation
19. $NKE (Nike) – Global brand reset with margin recovery potential
Buy zone: $35–40 = long-term support
20. $COHR (Coherent Corp.) – Optical infrastructure play on AI data explosion
Buy zone: $220–230 = direct LITE sympathy play
♻️RESHARE this post & write 1 comment for my list of SMALL CAPS under $20.
SPY is back at 707 and positioning has flipped from bullish expansion to fragile / negative gamma.
Here’s the clean read.
Net GEX is now -275.98M.
This is a major shift. Dealers are no longer long gamma. They are now closer to short gamma which means they sell dips and sell rips less, and volatility can expand.
This creates one thing:
A more directional, faster market.
708–709 is now the dominant resistance zone.
You can see heavy negative GEX stacked there. This becomes your ceiling and rejection area.
Below, 700–702 is your key support band.
There is still some structure there, but it’s weaker now. If this breaks, downside can accelerate quickly.
Above, 712–715 is still the next upside zone.
But with negative gamma building, price will need real momentum to reclaim and hold those levels.
Three scenarios:
Most likely: increased volatility, range between 702–708 with rejection at highs.
Bull case: reclaim 709–710, then push into 712–715.
Bear case: lose 702 and especially 700, quick move down to 697–695.
Key levels:
Support: 702–700
Resistance: 708–709
What’s different now:
We’ve shifted from controlled bullish trend to unstable, higher volatility conditions.
This is no longer a smooth grind higher.
Best setups:
Short failed moves into 708–709 if it rejects.
Or wait for a clean reclaim above 709–710 for upside continuation.
Avoid random entries in the middle. This is now a reaction market.
708 is resistance.
700 is the line in the sand.
Let me know if this helps by ♻️RESHARING this post and making 1 comment! Thanks.
Every stage for a millionaire trader:
Stage 1 – The Gambler
Right now you’re trading outcomes, not structure. Your decisions are emotional, inconsistent, and heavily influenced by P&L. There’s no stable process yet just reactions.
Review Process:
At the end of each day, log every trade and answer:
Did I follow any defined setup?
Was this planned or impulsive?
What emotion drove this trade?
Focus only on awareness, not fixing.
Timeline:
Typically 1–3 months (can be longer if ego is high).
To move to Stage 2 (The Student): commit to one market, one setup, and journal every trade. Your goal is to replace chaos with structure.
This trading coach here https://t.co/3tOgluwPFB will help analyze trades and thought process so you can go from stage 1-6 in less than 6 months! (Try it)
Stage 2 – The Student
You’re learning aggressively, but execution is inconsistent. You believe more knowledge will fix the problem it won’t. The issue isn’t information anymore, it’s application.
Review Process:
Track ONE setup only:
Screenshot entry/exit
Grade execution (A–F)
Note if rules were followed
Ignore P&L completely.
Timeline:
Typically 2–6 months.
To move to Stage 3 (The Emotional Trader): stop adding strategies and master one setup. Track execution quality, not profits.
Stage 3 – The Emotional Trader
You know what you should do, but you don’t always do it. Discipline breaks show up under pressure overtrading, cutting winners early, revenge trades. Awareness is high; control is unstable.
Review Process:
After each trade ask:
Did I feel fear or hope during this trade?
Did I exit based on plan or emotion?
Where did I break discipline?
Track emotional triggers daily.
Timeline:
Typically 3–9 months (this is where most fail).
To move to Stage 4 (The System Trader): reduce size, enforce hard stop rules, and measure rule adherence %. Emotional stability comes before performance.
Stage 4 – The System Trader
You have defined entries, exits, and risk. Losses are planned and structured. Now the challenge is patience and selective execution not taking trades that almost qualify.
Review Process:
Track strict metrics:
Rule adherence % (target 90%+)
Number of trades taken vs valid setups
Missed vs forced trades
Precision over frequency.
Timeline:
Typically 3–6 months.
To move to Stage 5 (The Consistent Executor): trade less, wait for full confirmation, and eliminate impulse entries. Precision separates you now.
Stage 5 – The Consistent Executor
You trust your system and understand variance. Emotional swings are smaller and you no longer need constant action. The threat now is boredom and over-optimization.
Review Process:
Weekly review only (not daily):
Did I follow my system all week?
Were any trades outside plan?
Am I forcing trades out of boredom?
Focus on consistency, not improvement.
Timeline:
Typically 6–12 months.
To move to Stage 6 (The Professional): think in weeks and months, not trades. Focus on capital preservation and long-term consistency.
Stage 6 – The Professional
You operate on probabilities, not emotion. Risk management is automatic. Trading is process-driven and stable.
Review Process:
Monthly performance review:
Equity curve trend
Max drawdown control
System consistency over time
Refine edges slightly, never overhaul.
Timeline:
Ongoing this is mastery.
Your job now:
Protect discipline, avoid complacency, and continue refining execution without increasing emotional exposure.