he Q2 2026 Update: A Strategic Platform Shift
The shift is here: FusionReactor is no longer a dependency—it's your source of specialized data. The Q2 2026 Update offers IT leaders strategic flexibility: deep ColdFusion/Java insights via OTel to any backend, plus optional AI-driven analysis via OpsPilot. Give your DevOps teams the freedom to choose their path.
https://t.co/dT4jJzMGBn
#DevOpsStrategy #OpenSource #ObservabilityStack #ITUpdate
Operational Efficiency through Native Alerting
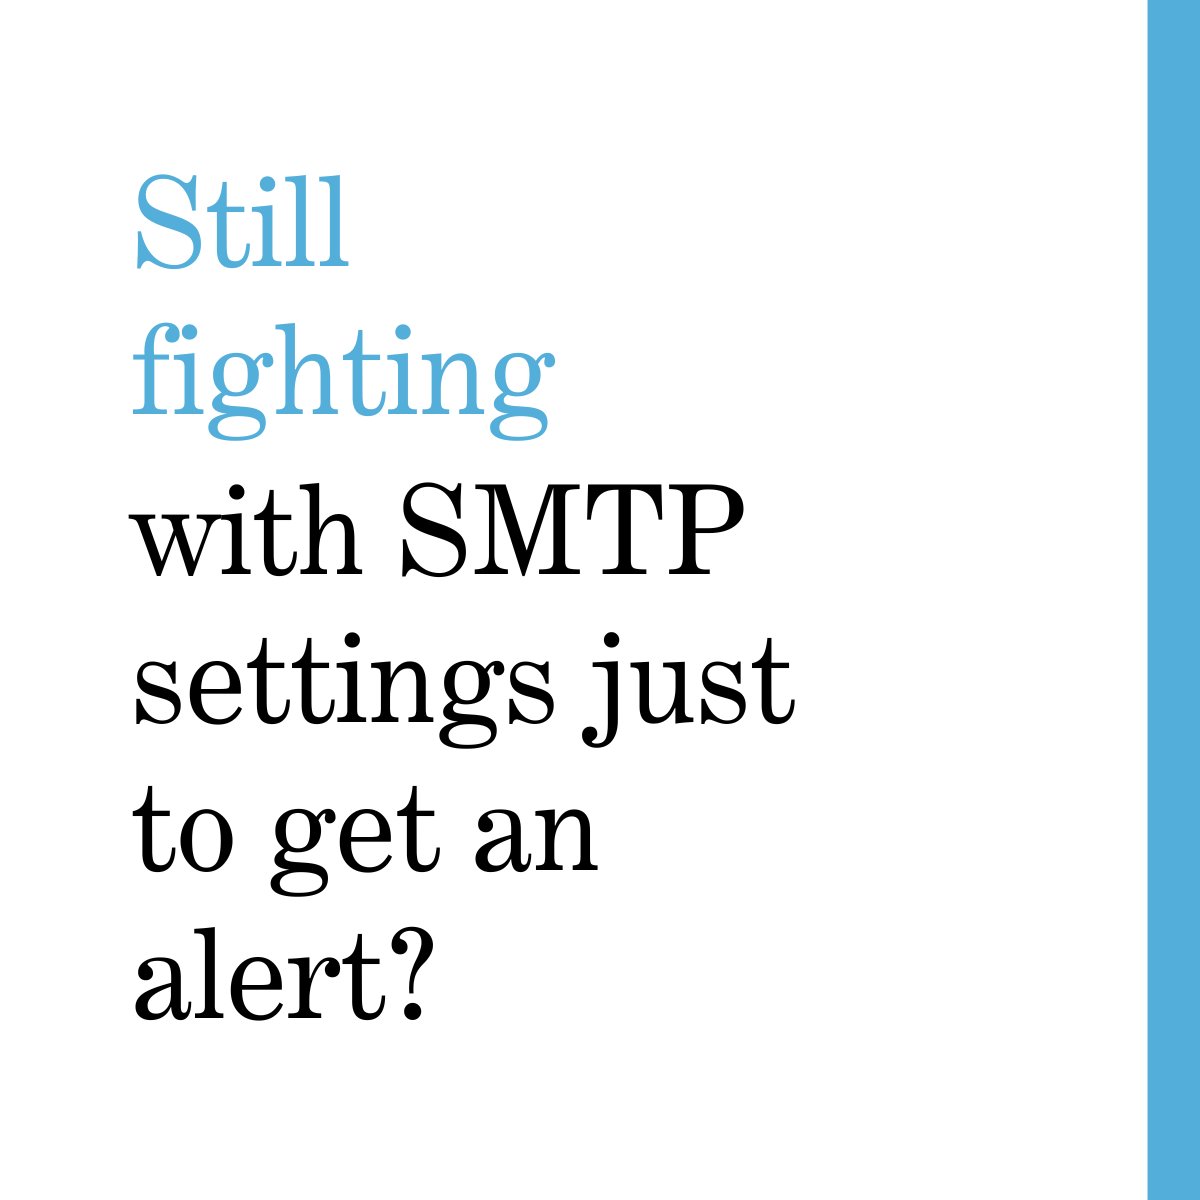
Operational efficiency matters. FusionReactor's Q2 2026 update introduces reliable, zero-config native alerting. Our built-in email service removes the common friction of SMTP configurations and credential management, ensuring your teams get critical alerts reliably out of the box. Less configuration, more focus on incident resolution.
https://t.co/dT4jJzMGBn
#Alerting #ITOperations #ZeroConfig #Efficiency
Strategic Flexibility and Specialized Data
Tired of vendor lock-in? FusionReactor is evolving from a locked-in monitoring tool to an open data source. IT leaders can now choose their observability backend while maintaining the best, specialized instrumentation available for ColdFusion. Access high-fidelity CFML request transactions and SQL performance data without a mandatory OpsPilot subscription.
https://t.co/dT4jJzMGBn
#FreedomOfChoice #ColdFusion #APM #ITStrategy
The End of Observability Silos
IT Leaders: Stop managing siloed tools. The FusionReactor Agent now supports native OpenTelemetry export, allowing you to seamlessly integrate deep ColdFusion and Java telemetry into your existing OTel-compatible backend (Datadog, Splunk, Grafana Cloud, and more). Consolidate your monitoring into a single pane of glass without losing specialized CFML insights.
https://t.co/dT4jJzMGBn
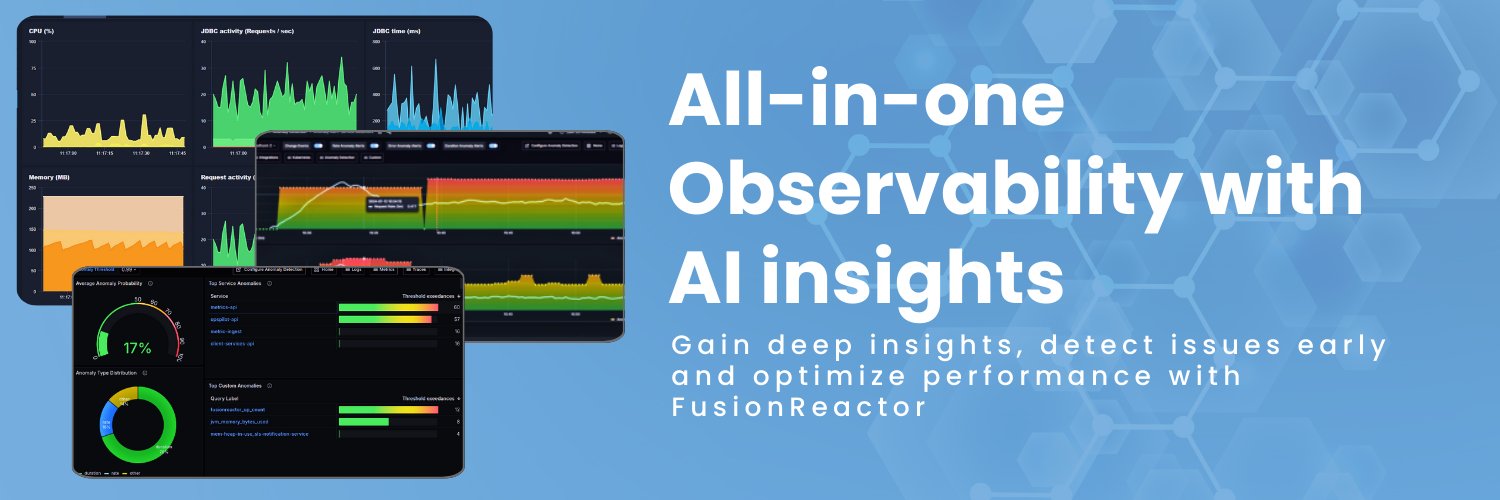
Maximize Your Data with AI-Driven Intelligence
For IT leaders looking to maximize data value: The OpsPilot Path adds an intelligence layer to your FusionReactor data. Invest in solving incidents faster with automated root-cause analysis, AI-driven anomaly detection, and natural language querying. Raw OTel data is powerful, but OpsPilot unlocks true analytical speed.
https://t.co/dT4jJzMGBn
#AIOps #RootCauseAnalysis #AnomalyDetection #TechLeadership
Need comprehensive database monitoring for your diverse environment? OpsPilot’s extensible, Prometheus-based architecture supports MySQL, PostgreSQL, SQL Server, Oracle, and MongoDB. Ready to transform your monitoring strategy and eliminate critical blind spots? Discover how OpsPilot can provide the complete visibility your team needs today!
https://t.co/8zelVJTBPQ
#MySQL #PostgreSQL #MongoDB #DatabaseTech #OpsPilot
Stop correlating timestamps across disconnected systems! When a database performance issue occurs, OpsPilot ensures you immediately see the complete picture: which users are affected, what queries are slow, and why the database is struggling. This leads to faster problem resolution and enables proactive performance management.
https://t.co/8zelVJTBPQ
#MTTR #Troubleshooting #PerformanceTuning
Say goodbye to switching between multiple monitoring tools! OpsPilot provides Unified Database Observability, offering application-level transaction context and deep instance-level diagnostics on a single pane of glass. Simplify your workflow, reduce tool complexity, and gain comprehensive database performance data.
https://t.co/8zelVJTBPQ
#UnifiedMonitoring #OpsPilot #TechStack #Database
Effective database monitoring stands on two essential pillars:1
- Application-Level: Provides transaction context and shows how database calls impact overall response times.1
- Instance-Level: Provides the "why," detailing resource utilization, lock contention, and concurrency bottlenecks.1
Without both, you're only seeing half the picture. OpsPilot delivers this complete visibility in a single platform.
https://t.co/8zelVJTBPQ
#AppPerformance #DatabaseDiagnostics #OpsPilot
Is your database monitoring fragmented? Relying on application-level views or deep diagnostics alone creates critical blind spots and leads to longer mean time to resolution (MTTR). Stop guessing the root cause! The solution is a unified approach that combines application context with instance-level insights.
https://t.co/8zelVJTBPQ
#DatabaseMonitoring #Observability #DevOps #OpsPilot
Reliable Alerting Is Now Standard
Focusing on flexible OTel routing (the big news) is great, but don't overlook this crucial update: The FusionReactor Agent is now solving the hidden pain of observability—alert delivery headaches.1
The Q2 2026 update includes the Agent's own built-in email service to handle notifications natively.1
What this means for your daily ops:
Alerts send reliably—no dependency on your internal email infrastructure.1
No complex SMTP configuration required during setup.1
Say goodbye to credential expiry silently breaking your notification pipeline.1
Reliable alerting is non-negotiable. See how this makes FusionReactor significantly easier to run in production:
https://t.co/BcH6c8cVra
#Alerting #Reliability #FusionReactorUpdate #ProductionMonitoring #DevOps
Solving the Hidden Pain of Observability
Alerts failing due to expired SMTP credentials or complex configurations? We’ve all been there.
Alongside the major OTel flexibility update, FusionReactor is quietly fixing a major friction point: reliable alerting. The FusionReactor Agent will soon ship with its own built-in email service to handle delivery natively.
What this means for you:
Alerts send reliably, without depending on your internal email infrastructure.
No more SMTP configuration headaches during setup.
Faster time-to-value for new users—alerting works from day one.
Reliable alerting is non-negotiable. See how this makes running FusionReactor in production significantly easier:
https://t.co/BcH6c8cVra
#Alerting #ProductionMonitoring #FusionReactorUpdate #DevSecOps
A Game-Changer for ColdFusion Teams
ColdFusion teams, listen up! Java applications have long had flexible OTel options, but CF has been tied to specific pipelines—until now.
The FusionReactor Agent update in Q2 2026 breaks that dependency. You can now leverage FR’s deep ColdFusion instrumentation (CFML request transactions, query performance, error context) and ship that data directly into your existing observability workflows.
No re-instrumentation, no secondary platform costs. Just the deepest CF insight available, feeding your preferred backend.
Read the full announcement:
https://t.co/BcH6c8cVra
#ColdFusion #OTel #AppDev #Instrumentation #CFML
FusionReactor is giving you the choice: Two paths, one agent.
Bring Your Own Backend (OTel): Use FusionReactor as a best-in-class ColdFusion data source, feeding MLT into your preferred OTel-compatible provider (Splunk, Honeycomb, etc.). No OpsPilot license needed for routing.
Go All-In with OpsPilot: Get the full AI-powered observability experience, including AI-powered anomaly detection, natural language querying, and automated root cause analysis.
Whether you need data flexibility or an AI companion, FusionReactor fits into your stack.
See what option is right for your team:
https://t.co/BcH6c8cVra
#OpsPilot #AIOps #ObservabilityTools #FullStack
Big news for observability teams! FusionReactor is breaking down barriers. Next quarter, you can finally use FusionReactor's unmatched ColdFusion instrumentation and ship your Metrics, Logs, and Traces (MLT) data directly to any OpenTelemetry (OTel) compatible backend—including Datadog, Grafana Cloud, New Relic, and more—with no OpsPilot subscription required to extract and route your data.
This means you get the deepest ColdFusion insight without paying for a second observability platform for storage. Integrate FR into your existing stack, on your terms.
Ready to unify your telemetry and save? Learn more about this major update:
https://t.co/BcH6c8cVra
#FusionReactor #OpenTelemetry #Observability #ColdFusion #DevOps
What if you could monitor your ColdFusion application the same way you'd ask a colleague?
"Has anything been running slow today?" "Show me error rate on /member/* for the last 24 hours." "Flag anything that's taking longer than usual to initialise."
That's OpsPilot. Natural language queries, real telemetry data, no custom dashboards required.
We used it as the example in our latest blog post — covering how to monitor a specific ColdFusion architecture pattern (cached components as scoped proxies) where failures are silent and traditional logging falls short.
If you work with ColdFusion applications in production, it's worth a read. Link in comments.
https://t.co/IFGfbLuJ8Y
#ColdFusion
Engineers call it hotfix hell.
The cause is almost never the code itself. It's that the team is operating blind — no visibility into memory trends, no transaction traces, no thread data.
So every fix is a guess. And guesses create new problems.
The way out isn't a rewrite. It's observability.
Install FusionReactor. Get 48 hours of production data. Now you're fixing root causes, not symptoms.
Full breakdown — including real CFScript examples — in our latest blog:
https://t.co/CE52N7CEhK
#ColdFusion #Lucee #CFML #LegacySystems #FusionReactor
The most dangerous production bugs aren't the ones that crash your app.
They're the ones that don't.
Wrong routing. Missing state. A setupRequest() that takes 40ms instead of 0.4ms because someone accidentally added a database call to it six months ago and nobody noticed.
These are the failure modes that matter in ColdFusion applications using long-lived, cached components with per-request state — and they're almost impossible to catch with traditional logging alone.
FusionReactor gives you request tracing across every component initialization, ML-based anomaly detection that learns your baseline, and OpsPilot AI that you can simply ask: "Have there been any requests in the last hour behaving unusually?"
Find out more …
https://t.co/qewkU4YxQh
#ColdFusion
Your ColdFusion server is fine.
Until it isn't.
Then someone restarts it. Metrics look normal. Incident closed.
Four days later — same thing.
This is restart culture. And it's costing you more than you think.
Every restart hides the real problem:
→ Memory leaks accumulating in long-running threads
→ Thread contention quietly exhausting your JVM pool
→ Configuration drift you'll only discover at 3am
The server coming back up isn't a fix. It's a delay.
FusionReactor breaks this cycle by showing you exactly what's wrong — heap trends, thread state, object retention — before the next incident, not after.
We wrote about the full pattern (and the code-level fixes) here:
https://t.co/CE52N7CEhK
#ColdFusion #CFML #DevOps #APM #FusionReactor
Visualizing Performance with New Metrics Views
Performance tuning relies on clear data visualization. The new OpsPilot UI offers two specific ways to view your metrics graphs, depending on whether you need a historical perspective or a live look.1
For Historical Trends: To look back at specific timeframes, simply select a server and open the Metrics tab.1
For Live Agent Metrics: To see real-time data directly from FusionReactor, use the UI Tunnel tab and navigate to Metrics > Web Metrics.1
https://t.co/eTg1wsf7ut
#OpsPilot #FusionReactor #UIUpgrade #PerformanceMonitoring #TechNews