$LTC is showing potential trend exhaustion on the 4H timeframe after printing a clean TD 9 sell signal at 43.86. Price action has pushed cleanly above the local volume profile value area and is now entering a minor structural resistance zone. The 4H RSI is stabilizing near 58.90 suggesting the upward momentum is beginning to stretch thin right at this local peak.
$PUMP has locked in a fresh 4H TD 9 sell signal right at the 0.001551 level. The price action expanded steadily off the lower structural buy zones and is now hitting the upper boundary of the local high volume profile cluster. RSI is hovering near 58.02 indicating that while momentum remains neutral the immediate buying pressure is starting to face notable structural friction.
Tokenomics and long term supply metrics matter for macro trends but short term price action is driven by liquidity and structural exhaustion. The algorithmic models look at immediate market mechanics and order book imbalances where sharp relief bounces occur regardless of supply inflation.
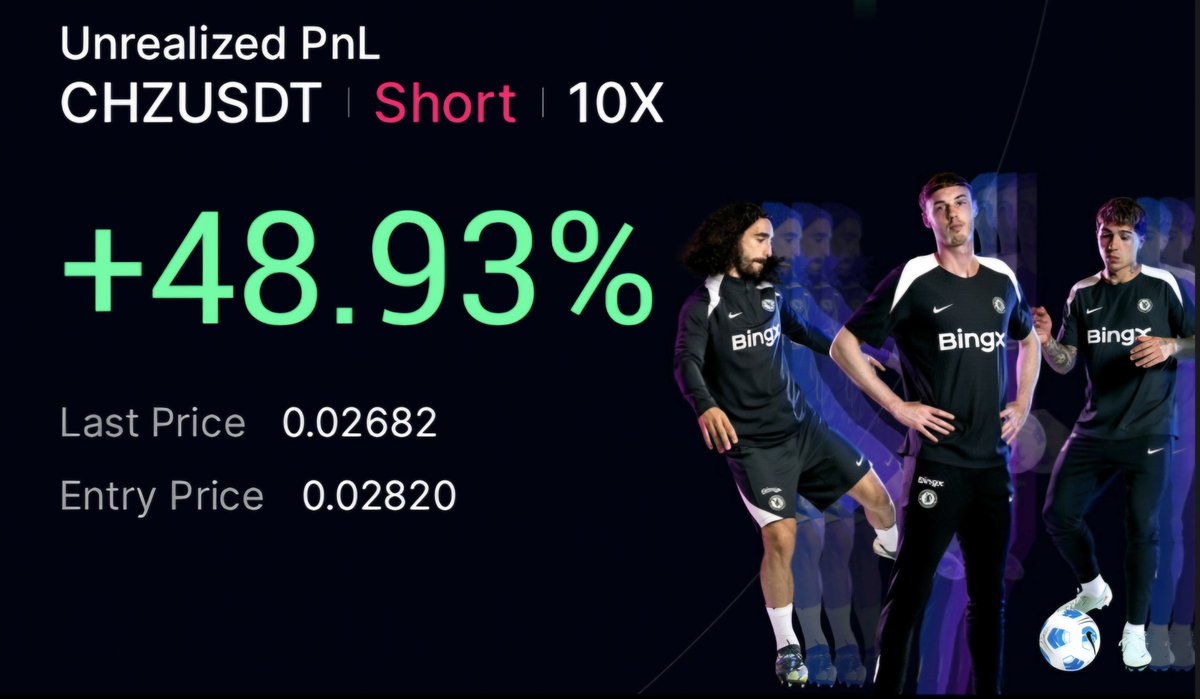
$CHZ has printed a clean 4H TD 9 buy count coupled with a structural B signal right at the 0.02585 level. Price action is stabilizing near the absolute lows of the recent flush while the 4H RSI remains compressed at 42.35 showing deep seller exhaustion. The volume profile structure shows that the main high volume node resistance is sitting much higher up leaving a clear window for a potential squeeze.
$XAUUSD is starting to react right off that daily TD 9 buy signal we highlighted. Price expanded slightly up to the 4218.560 level as buyers step in above the lower demand pocket. Daily RSI is slowly grinding up to 36.06 but remains heavily compressed showing a lot of room for a broader mechanical relief rally through the thin volume profile gap above.
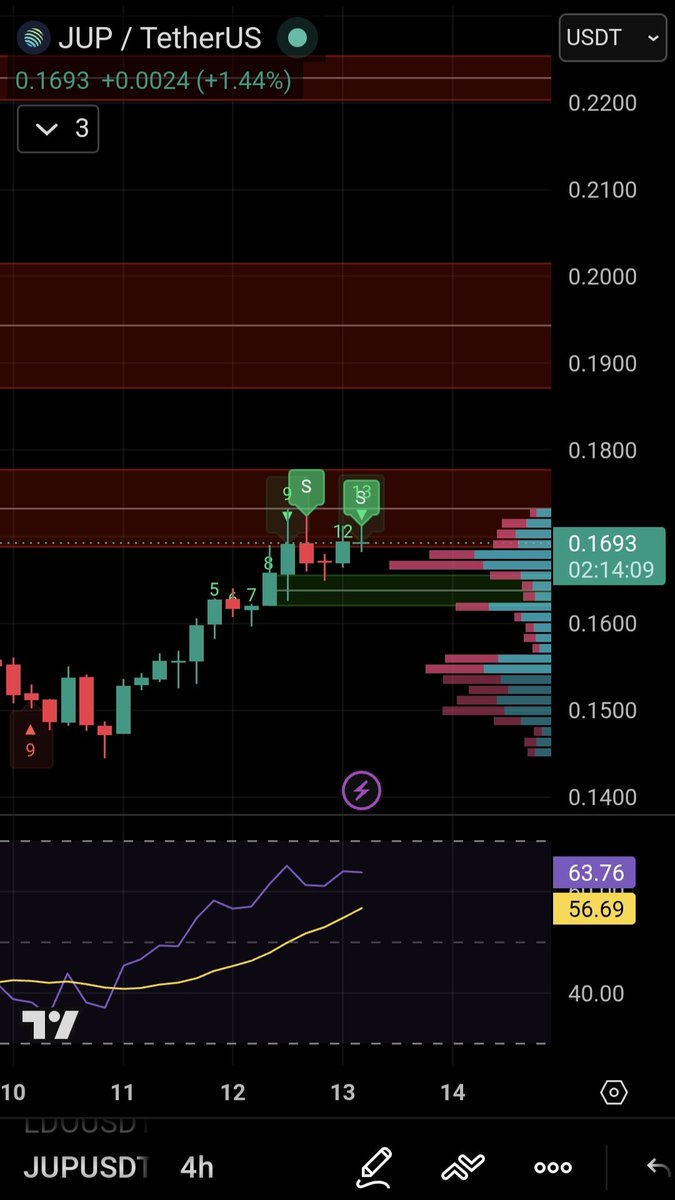
$JUP has officially locked in a fresh 4H TD 13 sell signal right at the 0.1693 level. The price action expanded past the initial sequential counts and is now directly testing the upper limits of the overhead volume profile block. RSI is holding strong near 63.76 confirming heavy overextended conditions as buying power stretches into major structural resistance.
$JUP is showing clear signs of trend exhaustion as the 4H timeframe prints a clean TD 9 sell signal at 0.1662. Looking at the volume profile structure price is directly testing the upper boundary of the local trading cluster. RSI is currently hovering at 62.03 confirming that the recent buying momentum is starting to stretch thin right below major overhead resistance.
$JUP is showing clear signs of trend exhaustion as the 4H timeframe prints a clean TD 9 sell signal at 0.1662. Looking at the volume profile structure price is directly testing the upper boundary of the local trading cluster. RSI is currently hovering at 62.03 confirming that the recent buying momentum is starting to stretch thin right below major overhead resistance.
$VIRTUAL just locked in a fresh 4H TD 9 sell signal right at the 0.6211 level after a notable upward expansion. Price action is currently pushing into a minor high volume node while the RSI climbs to 63.62 indicating growing bullish exhaustion at this local peak. The major overhead resistance blocks are looming slightly higher up the chart.
$XAUUSD just printed a clean daily TD 9 buy signal at the 4186.740 level following a massive flush throughout June. Price action is stabilizing right above the lower liquidity pocket with the daily RSI sitting deeply compressed at 34 showing heavy seller exhaustion. Looking at the volume profile structure the major trading clusters are resting much higher up leaving a thin zone for a fast mechanical relief bounce.
$BTC is presenting a highly critical inflection point on the 4H timeframe. Price action just pushed up to the 63602.64 level and printed a fresh TD 9 sell signal. This exhaustion count is triggering right inside the upper volume profile cluster which serves as immediate overhead resistance. RSI is stabilizing near 56 showing neutral but fading momentum.
$XMR move played out completely in our favor since caching that perfect entry down at 308.75. Fast forward to now and our 10X long position is sitting at a clean plus 197% profit as price hits 369.10. Interestingly the 4H chart has just printed a fresh TD 9 sell signal right at the top of this aggressive expansion while RSI flashes overextended at 73. Strictly educational. Did you bank the full profit with me or are you holding for higher resistances?
$SPX index just locked in a fresh 4H TD 9 buy signal at the 7300.82 level after a steady flush through June. RSI has dipped down to 37 showing notable exhaustion on this recent leg down. Looking up at the volume profile structure the main overhead resistance clusters are resting way higher up.
$CRV printed a clean 4H TD 13 sell signal right at the 0.2437 level after an aggressive upward expansion. Price action is hitting the top of a heavy high volume profile cluster while the RSI is deeply overextended at 78. Heavy seller pressure usually steps in at these structural exhaustion counts. Strictly educational. Are you shorting this resistance block or looking for a breakout? Drop your bias below👇
Called that $XMR capitulation drop perfectly back on June 6 when the 4H TD 9 buy signal printed near the green demand zone. Fast forward to today and the entry at 308.75 is sitting at 352.04 giving us a clean 140% profit on a 10X long position. Patience pays off when you rely on technical structure. Hope you loaded your bags alongside me.
Significant structural validation appearing on the $XMR 4h chart as a powerful buy confirmation triggers on the 9 count.
Price action is tightly stabilizing directly inside a horizontal green demand block around the 300 dollars territory while the RSI compresses near 36. Volume profile distribution shows that major overhead resistance clusters remain far above our current level.
Did you catch this capitulation drop to load your bags or are you staying sidelined?
@TonyL202525 Financial markets do not care about emotions or project bias. The data showed a structural price exhaustion level at the exact point where retail sentiment capitulated. Trading the mechanics of the market will always be more efficient than trading opinions.🫡
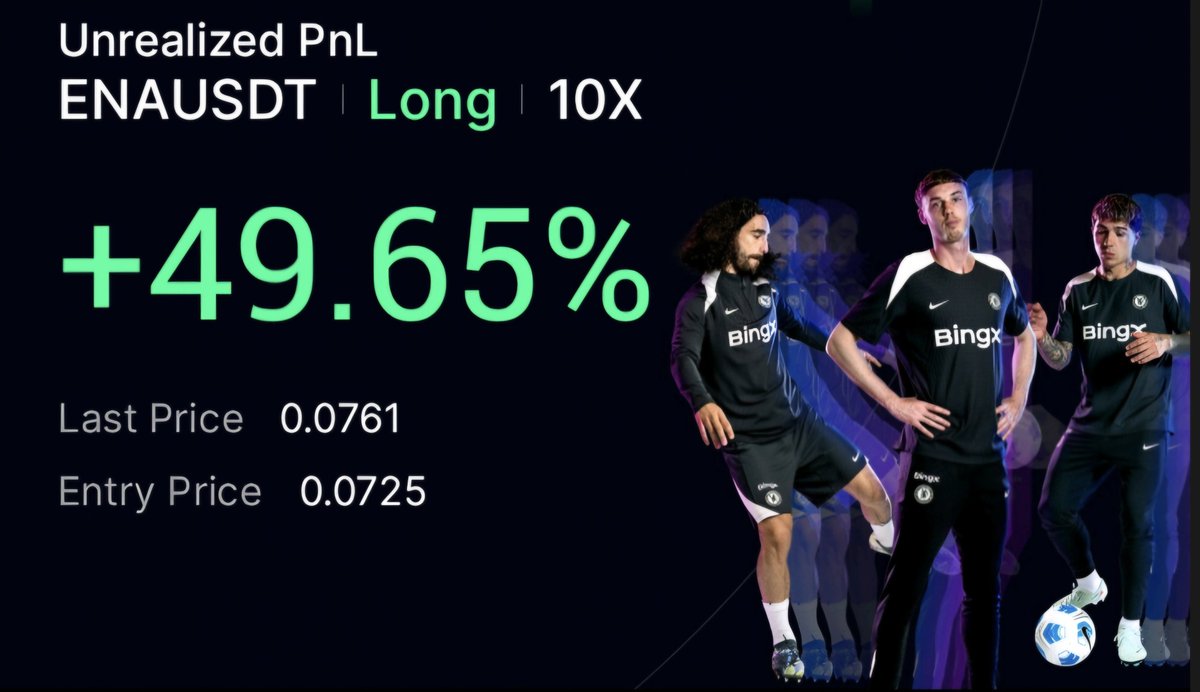
$ENA shows a massive downside extension but structural help might be on the way as a 4H TD 13 buy signal flashes at 0.0722. RSI has dropped heavily into oversold territory down at 27. Looking at the volume profile the main trading blocks are stacked much higher up. High probability area for a sharp mechanical bounce.
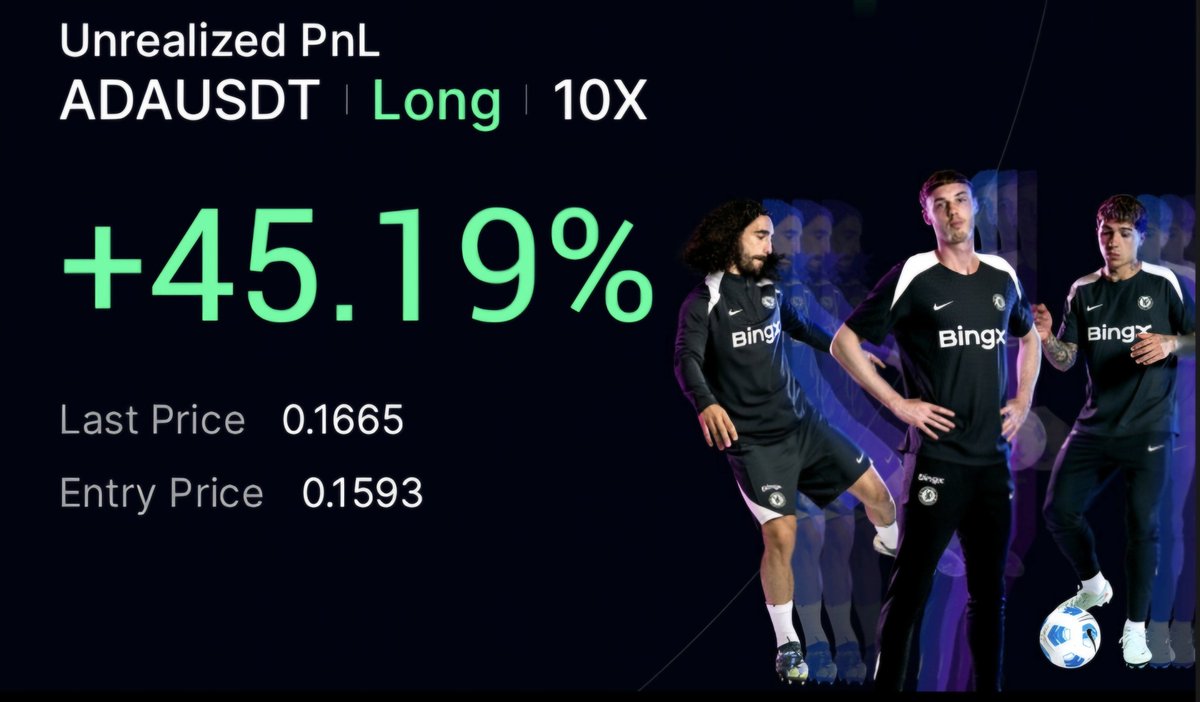
Yesterday was a highly efficient session across multiple assets. Algorithmic structural setups hit across $ENA $ADA $XLM, $chz and more with precise execution. Keeping the focus on mathematical market data over hype. Drop a follow to catch the next live chart breakdowns before the move happens.
Posted this TD Sequential 9 exhaustion signal on the $TON 4H chart a few days ago right at the overhead volume cluster. Short entry was locked at 1.731 and it is currently sitting at +48.5% profit today. Drop a follow to track the next structural setup live.
Serious bullish exhaustion showing on the $TON 4h timeframe as a clean TD Sequential 9 sell signal prints right after a strong vertical relief wave.
The steady upward extension has pushed the RSI back up near 53 while price action stalls directly under heavy overhead volume profile distribution nodes. With key resistance blocks looming just above, the upward momentum looks heavily capped here.
Are you locking in profits near this supply zone or looking to open a short position for a retest of the lower blocks?
$CRV just printed a TD 9 sell signal on the 4H chart following a decent push up to 0.2121. Price is pushing directly into a high volume profile cluster which could offer immediate structural resistance. RSI is getting hot around 65 indicating that momentum might be overextended here. Expecting a local cooling off period or minor pullback.