1) The Baseline vs. The "World Cup" Illusion ⚽ Estimates hover around 110k (vs May's 172k). But watch out for temporary distortions: host cities for the World Cup saw a massive spike in temporary jobs in leisure & hospitality. This boost is real, but it has a built-in expiration date.
2) The Dovish Shift 🕊️ At Sintra, Fed Chairman Kevin Warsh noted falling inflation expectations post-June FOMC and flagged AI's medium-term disinflationary potential by expanding the supply side. Not a hawk's tone. A moderate NFP today will cement this new Fed narrative.
3) Regime Change 📊 In May, markets feared strong data meant higher rates. Today, with inflation risks receding (Truflation at 1.75%) and oil down, a moderate print confirms an orderly normalization without recession.
Full blog: https://t.co/oVDjE9SAee
#KevinWarsh #USA #Investing
Wall Street’s calendar is shifting today, July 2nd, for an early NFP release. But beyond the headline number, there is a three-dimensional game playing out for the US labor market.
Here are 3 things you must know before the data drops 🧵👇
#NFP#Macroeconomics#Fed
📈 Piazza Affari officially broke the "June Curse"! 🇮🇹
Historically a negative month, the FTSE MIB closed June at +3.29%. Even better? It capped off a record Q2 (+16.64%), making it the second-best quarter since 1998.
What drove this historic rally? 👇
🏦 The banking sector was the undisputed engine, fueled by M&A rumors and solid fundamentals. Top monthly performers: 🟢 BPER Banca +18.2% 🟢 Monte dei Paschi +17.7% 🟢 Mediobanca +17.5%
UniCredit alone contributed a massive 83.5 basis points to the index!
⚠️ But it wasn't a broad rally, only 17 out of 40 stocks actually beat the index.
Industrial and defense sectors took a heavy hit: 🔴 Stellantis crashed -27.5% (the worst performer). 🔴 Leonardo dropped -12.7% as European rearmament hype cooled down
The big takeaway? Seasonal trends don't matter when strong fundamentals and stock picking take the wheel.
With the Italian market hitting new all-time highs, where are you allocating for H2? Still riding the banks, or buying the industrial dip? 👇
Full blog: https://t.co/pFhDmaJ6FN
#FTSEMIB #FinTwit #PiazzaAffari #Investing #StockMarket
Mercati europei: chi sono i veri vincitori del 2026? • L'analisi di Gabriel Debach (eToro) mostra come Italia, Spagna e Olanda stiano guidando le Borse europee, mentre sono semiconduttori, banche ed energia i veri motori della crescita.
https://t.co/MlyWDtkaFH
🚨 Thinking of Europe as a single passive equity proxy is a major tracking error. As of June 26, inner index distribution reveals a massive structural divide between countries and sectors. Here is the data breakdown. 🧵👇
1/ The Nominal Mismatch 📊: YTD nominal returns display a wide gap across the continent. Milan leads the group with a +13.92% gain, followed by Madrid (+11.9%) and Amsterdam (+11.5%), while Paris (+2.7%) and Frankfurt (+0.7%) lag behind .
2/ The Equal-Weight Reality 🧮: When placing every stock on equal footing (Total Return), the Netherlands leads YTD with an average stock return of +14.9%, ahead of Spain (+13.5%) and Italy (+13.3%) .
3/ Momentum Risks 📉: The Dutch rally is highly recent; its +15% YTD return explains almost all of its +19% 1-year performance, leaving it exposed to momentum normalisation . Meanwhile, Spain and Italy built their moats back in 2025 .
4/ Long-Term Italian Moat 🇮🇹: On a 3-year cumulative TR horizon, Italy dominates the panel at +150%, followed by Spain (+121%), while Germany sits at +75% . Italy's strength relies on 13 financial stocks (+14.3% avg) and 3 energy titles (+49.4% avg) .
5/ Extreme Quintile Polarization ⚖️: The gap between winners and losers is widening. The worst-performing YTD quintile dropped -24% on average, while the top quintile surged +50.2% . On a 3-year timeline, this gap expands to a massive 145 points .
6/ The Tech Faglia 💻: Looking at sectors as single blocks hides the truth. Tech is highly fragmented: European software names plunged by an average of -30.9% (SAP down -34%), whereas the semiconductor supply chain surged +122% YTD (STMicroelectronics at +180%) .
7/ The Consumer Drag 🚘: Traditional industrial sectors are being crowded out. The European automotive sector shed -13% on average YTD (Stellantis down -47%, BMW down -33%), while the Luxury basket retraced by -11% .
8/ The Safe Havens 🛡️: Energy (+35% average) and Utilities are the only two sectors completely absent from the worst-performing quintile in 2026, protecting indexes like Italy and Spain that hold a high concentration of these assets .
Passive exposure to broad European indexes delivers average metrics that mask massive internal variance . Two distinct European markets coexist: a narrow group riding computing/banking infrastructure, and a silent block bound to legacy cycles .
Full European equity quintile breakdowns and automated flow matrices on eToro: 🔗 https://t.co/UAacbOWAeQ
$SPY $VGK $EWI $STM $ASML #Trading #Macro #EuropeEquities #PiazzaAffari
Fed, Oil, and Tech: Why the market's reaction to the new Fed regime matters. 🧵
The US just delivered two massive signals: a de-escalation in the Middle East and a recalibration of rate expectations. Here is what you need to know from the latest market data. 📊
The Energy Pivot: The Iran-US peace memorandum is a game changer. Brent is back below $78/bbl, hitting its 200-day moving average. We are worlds away from the $120/bbl stress levels seen during the height of the crisis.
The "Warsh" Fed: Markets are treating the Fed not as a source of recessionary shock, but as a "stricter" authority because the economy is still too strong. Higher yields are being driven by robust nominal growth, not fear of collapse.
The Tech Divide: Watch the divergence. While telcos and real estate (-2.5%) were punished by rising rates, the semiconductor/AI hardware sector held its ground. This isn't just "growth" - it's productivity-driven capex.
The market is separating pure duration-heavy growth from real, productivity-focused growth. This is the most critical shift for the remainder of 2026.
https://t.co/rnKD6JhCIr
#Fed #Warsh #StockMarket #AI #Macro #Investing #Semicondutors
Adidas vs. Nike: The real World Cup battle isn't on the pitch, it's on the stock market. 📉📈
Does sponsoring the winning team actually make shareholders rich? The data tells a surprising story. 👇
Think the 4-week tournament guarantees profits for sports brands? Think again. Over the last 6 World Cups (2002-2022), Adidas averaged a -3.95% return during the games, while Nike barely moved at +0.56%. The pattern is widespread weakness, not a massive rally.
What about sponsoring the winning nation? It has zero predictive value for the stock! 🏆 Adidas dressed the winners in 2010, 2014, and 2022, seeing post-tournament returns of +1.99%, -6.12%, and +21.63%. Lifting the cup doesn't guarantee a stock pump.
The real story is the massive divergence since the 2022 Qatar final. Since December 18, 2022, Adidas stock has soared +39.56%, while Nike has plummeted -60.79%. A massive 100+ point gap built quarter after quarter. Why? Execution.
It's a tale of two CEOs. Adidas (under Bjørn Gulden) nailed its turnaround, posting 14% revenue growth in Q1 2026. Meanwhile, Nike is paying the price for excess inventory and an extreme direct-to-consumer push, seeing a 3% revenue drop in Q3 2026. 👟📊
Looking at 2026 Polymarket odds: Nike-sponsored teams (France, England) have a combined 28.8% chance to win, beating Adidas teams (Spain, Argentina) at 24.6%. But remember: the sports market and the stock market are telling two completely different stories! 🎲💰
No matter who wins between Nike and Adidas, the ultimate financial winner is FIFA. The 2023-2026 cycle will bring them a staggering $13 BILLION in revenue (+72% from Qatar), thanks to a 48-team expansion and the lucrative US media market. 🤑🌍
Full analysis https://t.co/rOEAJr5Nr3
#Nike #Adidas #Investing #MarketAnalysis #StockMarket #Strategy #Retail #WorldCup2026 #FIFAWorldCup #StockMarket
🚨 Geopolitics completely inverted the macro narrative. Markets shifted from viewing the Middle East as a growth threat to pricing it as a systemic solution. Here is the quantitative breakdown of the data-driven rotation. 🧵👇
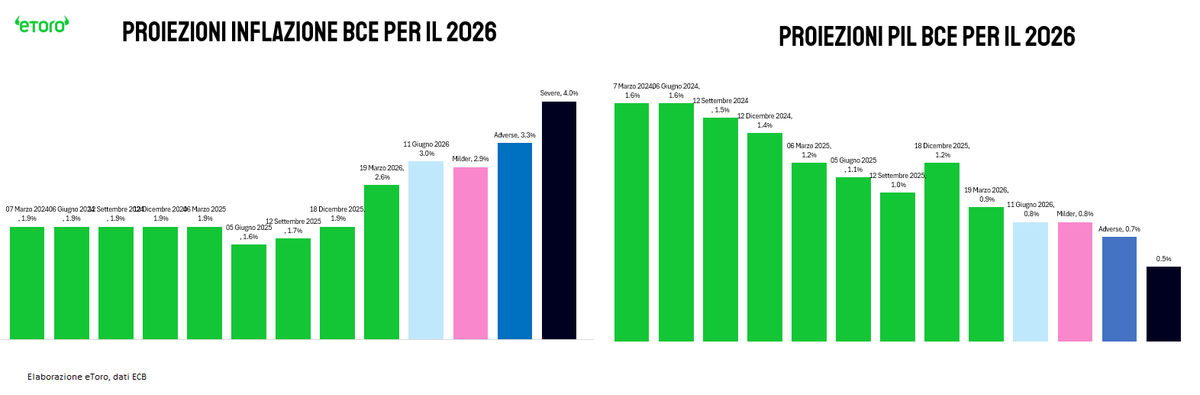
1/ The session opened highly hawkish: the ECB raised rates by 25 bps and lifted its 2026 inflation projection to 3.0%. Concurrently, US Core PPI accelerated to 5.1% y/y (+0.8% m/m), lifting bond yields.
2/ Everything pivoted when Trump announced an imminent US-Iran agreement. A clear vertical line divided the session : Tech ($XLK) surged +3.73%, Materials ($XLB) gained +3.27%, and Industrials ($XLI) rose +3.24%. 3/ Conversely, Energy ($XLE) dropped -1.94%. The S&P 500 closed up +1.75%, while the Nasdaq rallied +3.29% and the Russell 2000 gained over 3% , completely sidelining the hawkish US PPI print.
4/ The mechanical explanation: Brent crude falling to $88.8/bbl lowers manufacturing input costs and compresses the geopolitical risk premium. This directly fuels cyclical assets and rate-sensitive tech.
5/ According to ECB models, a formal peace agreement aligns with a "milder scenario" where oil averages $88 in Q3 2026, driving Eurozone GDP growth to +1.4% in 2027 and pushing inflation below 2%.
6/ In contrast, June's baseline scenario models a weaker 2026 GDP growth of 0.8% , with core inflation sticky at 2.5%. ECB maintains that wage growth slowing to 3.2% in 2026 will prevent a wage-price spiral.
7/ The risk shift led US 10Y yields down ~10 bps, compressed credit spreads, and lifted EUR/USD back to 1.17 / 1.16 , alongside gains in Gold and Bitcoin. 8/
Markets moved aggressively on a unilateral social media announcement, not a signed treaty. Any complications or official denials will reverse this brutal rotation at the exact same velocity. 🔗 https://t.co/lkdo7JcRrB
$SPY $QQQ $US10Y $GLD $BTC #Trading #Macro #Fed #ECB #Inflation
🚨 Apple ($AAPL) drops -1.89% on day one of WWDC 2026, aligning with a strict historical pattern. Beyond the immediate "sell the news" tape, a structural divergence is reshaping Cupertino's software and services margins. Here is the data breakdown. 🧵👇
1/ The WWDC Stat 📊: History repeats with Swiss-watch precision. In 16 out of the last 20 years, Apple's day-one keynote return closed in negative territory, averaging a 141 bps loss. Wall Street sold the debut of the original iPhone (-3.45%), FaceTime, and iCloud.
2/ The Siri AI Framework 🤖: Apple delivered its most radical assistant redesign since 2011, partnering with Google's Gemini models under the hood. While the market tracks this strategic dependency , data requests remain secure via Private Cloud Compute infrastructure.
3/ Ecosystem Gross Margin Moat 📈: Apple's gross margin expanded from 29% in Sept 2007 to an all-time record of 48% today. This continuous expansion proves Apple has methodically swapped low-margin hardware revenue for high-margin software and services.
4/ Direct Monetization 💵: These robust margins easily absorb external model licensing costs. Daily cloud limits on advanced Siri features are designed to incentivize users to upgrade to paid iCloud+ plans, converting AI queries into recurring revenue.
5/ The Invisible Hardware Wall 📱: Advanced Apple Intelligence features require a minimum of 12 GB of unified memory, strictly excluding iPhone 14 and older models. This structural barrier locks in a massive, multi-year hardware upgrade cycle.
6/ Spatial Disconnect 🌐: A near-term headwind targets the stock: Siri AI will initially be excluded from China and the European Union-two critical growth regions for the upcoming iPhone 18 cycle. This restriction explains the day-one market cool-off.
7/ The Reversal Precedents 🔄: Historical patterns show day-one drops are rarely definitive. In 2024, the stock slid -1.91% on day one but gained +7.9% by week-end. In 2019, it dropped -1% on the keynote to finish the WWDC window up +8.6%.
June is a technical dress rehearsal; Apple’s real commercial catalyst always materializes during September hardware rollouts. With an installed base of 450M already capable devices , the long-term upgrade runway remains fully intact.
🔗Full Analysis: https://t.co/KG9J9yHbv7
$AAPL $SPY $QQQ #Trading #Macro #Apple #WWDC26
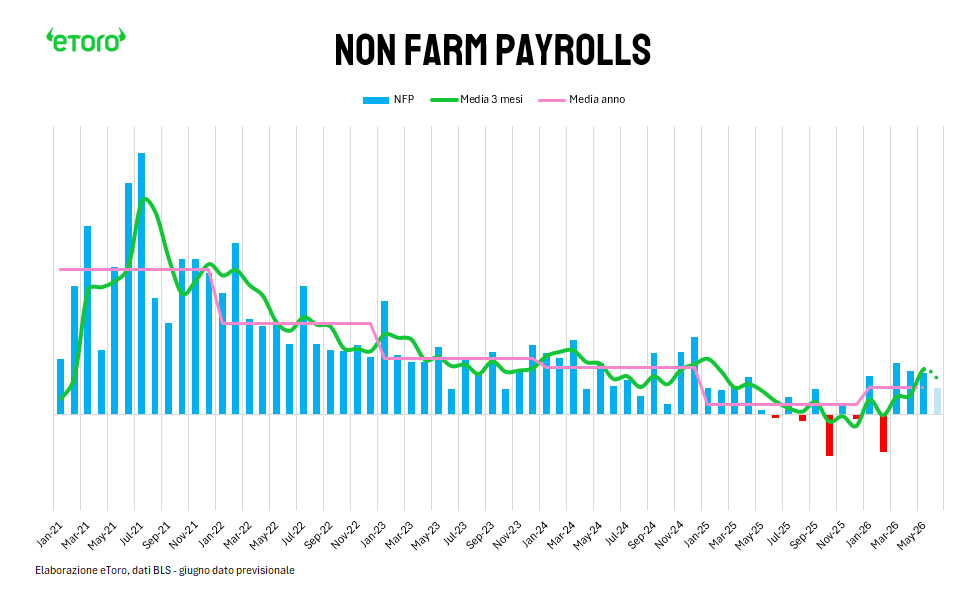
🚨 US May Non-Farm Payrolls day is here. This is the final macro print before the June 17 Fed meeting, the first chaired by Kevin Warsh. Beyond the initial market numbers, a severe statistical disconnect is rewriting history under the hood. 🧵👇
1/ The Technical Pause 💻: As tech experiences a physiological pause, the debate on whether massive AI infrastructure Capex will convert into proportional corporate profits intensifies. But today, macro data takes the steering wheel.
2/ The First Print Trap 📊: Market consensus expects +85k jobs today, following Wednesday's solid +122k ADP beat. But macro history gives a clear warning: distrust the first reading. Initial prints are consistently overstated.
3/ The Revision Disconnect 📉: Since Jan 2025, out of 15 available releases with final revisions, 13 out of 15 were quietly revised downward post-publication day. Markets cheered phantom numbers that never existed in reality.
4/ 1.2 Million Jobs Erased 🧮: Downward revisions deleted 638k jobs in 2025 alone. Accumulating 2023, 2024, and 2025 data, final revisions have completely wiped out over 1.2 million jobs from initial historical announcements.
5/ The Structural Macro Trend 📉: The longer-term trajectory is linearly shrinking. 2025 printed a total of 502k jobs-the lowest reading since 2010 (excluding crisis periods)-sharply down from 2,348k in 2024 and 2,780k in 2023.
6/ Fed Rates Re-pricing 🏛️: CME FedWatch prices a 96.4% probability of steady rates (3.50%-3.75%) for June. But looking at Dec 2026, cut expectations are gone: futures assign a 38% chance to one rate hike and 11% to two hikes.
7/ The Warsh Framework ⚖️: If NFP prints near 85k, it lifts the 3-month moving average, proving resilience and removing the Fed's excuse to cut. Yet, 85k monthly prevents arguments for aggressive hikes. The Fed is stuck in a directionless framework.
Full institutional payroll and Fed Watch analysis on eToro:🔗 https://t.co/KW3PP8gwtn
$SPY $QQQ $TLT $NFP #Trading #Macro #Fed #NonFarmPayrolls #JobsReport
🚨 Markets are undergoing a major structural reconfiguration. Technology is no longer just a sector driving performance; across the US, Emerging Markets, and Europe, it is effectively becoming the market itself. Here is the technical data breakdown. 🧵👇
1/ Wall Street’s Run 🇺🇸: The S&P 500 secured 9 consecutive positive sessions. A 10-day winning streak hasn't occurred since Sept 13, 1995. Resilient macro data (May ADP at 122k vs 117k expected) keeps the economic backdrop exceptionally solid.
2/ The Fed Rate Re-pricing 🏛️: Strong data is shifting rate expectations. CME FedWatch for Dec 2026 shows unchanged rate probabilities down to 41.1%, while a +25 bps hike rises to 40.6% and a +50 bps hike reaches 14.4%. Rate hikes and flat regimes are near parity.
3/ The US Sector Disconnection 📊: Inside the SPY ETF, Information Technology has methodically crowded out traditional sectors. Its weight expanded from 34.29% on Jan 28 to 39.72% on June 2 - compressing Financials (down to 11.22%) and Health Care (down to 8.09%).
4/ The Emerging Markets Metamorphosis 🌏: Inside the EEM ETF, the shift toward AI hardware is absolute. Tech weight nearly doubled in 18 months, surging from 24.34% to 44.37%. Traditional emerging narratives like demographics and internal consumption are fading.
5/ Geographic Overturn 🌐: China dropped to 20.63% and India slid to 10.44% inside EEM. Meanwhile, Taiwan hit 26.32% and South Korea exploded to 23.83%. Together, Taiwan and South Korea now command over 50% of the entire Emerging Markets ETF.
6/ Piazza Affari Reshaped 🇮🇹: Milano’s FTSE MIB is reflecting the same digital infrastructure wave. Prysmian claimed the 4th spot at 5.91% weight (up from 2.75% a year ago) on submarine cable and data center data grids. STMicroelectronics surged to 6th place overall, claiming a 5.28% index weight. In May alone, STM added $8.3B in market cap, accounting for an impressive 25% of the total market cap expansion of the Italian benchmark. Banks remain the foundational pillar, commanding 37.9% of the FTSE MIB ($271B market cap). UniCredit (15.43%) and Intesa Sanpaolo (12.44%) are highly consolidated, concentrating 27.9% of the entire index.
The structural shift is uniform across global equities. Capital flows are abandoning broad, diversified vectors to establish highly concentrated proxies on advanced computing and semiconductor infrastructure.
Full global index metrics and structural flow analysis on eToro:🔗 https://t.co/9qKYOPiYmB
$SPY $QQQ $EEM $FTSEMIB $STM #Trading #Macro #AI #Semicondutors #Fed
🚨 Alphabet ($GOOG) just announced a historic $80B equity issuance, the largest in recent corporate history. This move signals a massive structural transformation: tech is becoming a heavy capital-intensive industry. Here is the technical data. 🧵👇
1/ The Hardware Metamorfosis 💻: For a decade, Big Tech was praised for being asset-light. Generative AI rewrites this template. Language models require massive physical assets: data centers, GPUs, cooling systems, and power grids. Tech is returning to an industrial scale.
2/ The Cash Disconnect 💸: Why issue equity when you hold $126B in cash? Because Alphabet's projected 2026 Capex is tracking between $180B and $190B, nearly doubling YoY. At this velocity of spending, free cash flow completely evaporates.
3/ Financing Sequencing ⚖️: Alphabet didn't choose between debt and equity; it leveraged both. Between late 2025 and March 2026, it scaled long-term debt from $11B to $77.5B, including a multi-currency bond blitz and a rare £1B 100-year bond maturing in 2126. 4/ Avoiding the Oracle Template 🛡️: Loading more leverage risked a credit rating downgrade -a precedent Oracle faced that Alphabet avoided. With the stock hitting its 14th all-time high on May 13, issuing equity at elevated multiples became highly cost-efficient.
5/ The $80B Structure 🎯: The transaction splits into a $30B public offering ($15B common, $15B convertibles), a $40B ATM program starting in Q3, and a strategic $10B private placement to Warren Buffett’s Berkshire Hathaway ($BRK) at a discount.
6/ Ecosystem Inflow 📈: This capital mobilisation provides massive tailwinds for the hardware supply chain. The Magnificent 7 are on track to spend over $700B in Capex in 2026. Broadcom ($AVGO) gained ~5% following Google's deep commitments.
Dilution cost shareholders $174B in market cap on day one, but it secures unlimited ammunition. The ultimate question is no longer free cash flow boundaries, but whether AI can generate returns massive enough to justify this unprecedented capital migration.
Full analysis on eToro:🔗 https://t.co/fYnTavbYn4
$GOOG $BRK $AVGO #Trading #Macro #AI #CapitalMarkets #TechStocks
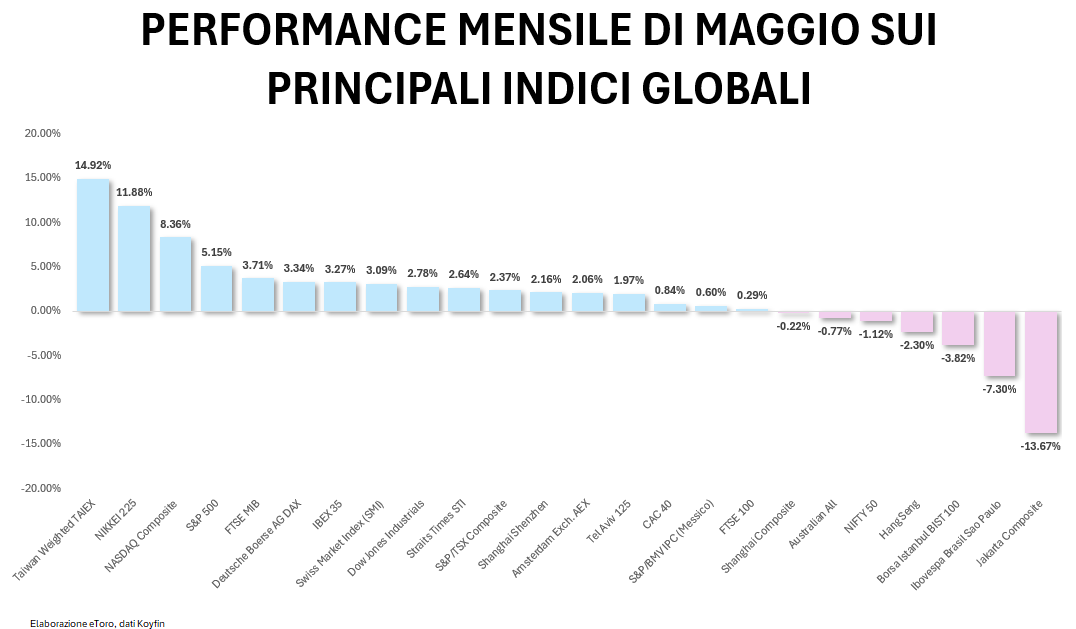
🚨 May wasn't about "Sell in May", it was strictly about "Select in May". While global indices notched fresh all-time highs, inner distribution reveals a severe structural disconnect. Here is the technical data breakdown. 🧵👇
1/ The Milano Milestone 🇮🇹: Italy's FTSE MIB finally broke its 26-year resistance from March 2000, closing May at 50,036 points (+3.71% nominal, +5.3% Total Return). It secured the top spot in Europe driven by high internal dispersion.
2/ Italian Catalysts 🚀: The monthly rally was driven by Avio (+36.6%) following its successful Vega C satellite launch, STM (+28.2%), and Prysmian (+15.7% on AI grid infrastructure). UniCredit (+13.1%) single-handedly added ~187 bps to the index.
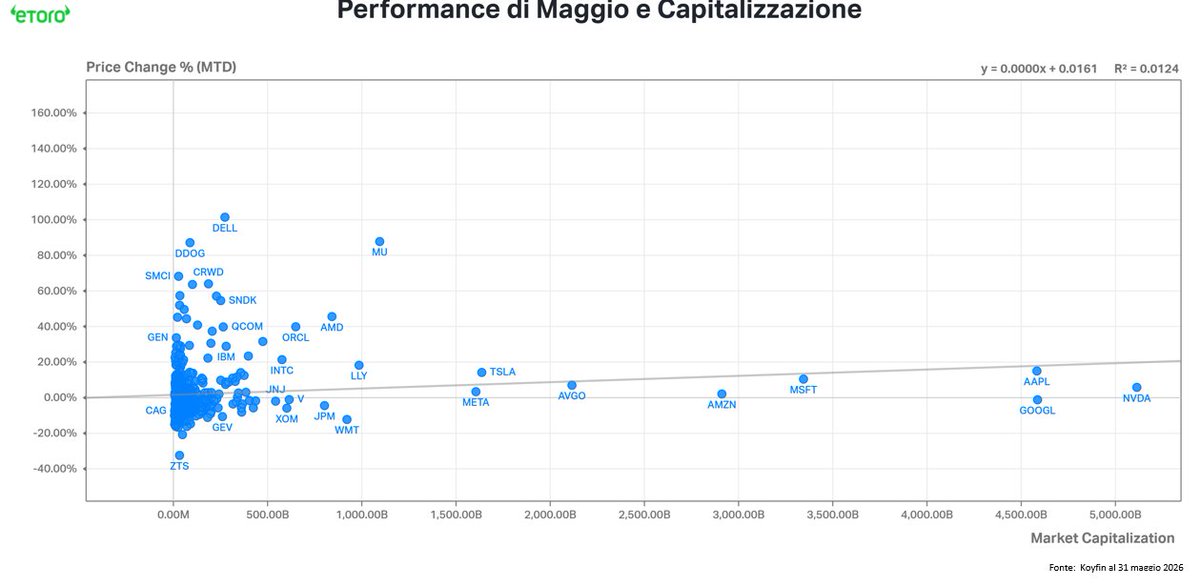
3/ The US Hardware/Software Split 🇺🇸: S&P 500 rose +5.15% and Nasdaq 100 gained +10.5%. But size didn't matter: market cap explained a mere 1.24% of the performance variance (R² = 0.0124). Alpha was captured entirely within the $50B-$500B hardware range.
4/ Iron and Memory Only 💻: Markets aggressively rewarded physical data infrastructure. Dell Technologies surged +101.4%, Micron clocked +87.8%, and SMCI jumped +68.2%. Meanwhile, mega-caps stayed flat and software names plummeted on AI monetization doubts.
5/ The Asian Dominance 🌏: May was an Asian story at its core. Taiwan’s TAIEX led global indices with a +14.92% gain (+54.45% YTD) as TSMC powered a 110% YoY index doubling. Japan's Nikkei 225 followed with +12% monthly gains, boosted by a weak Yen (-1.7%).
6/ The Crypto Reversal 🪙: Bitcoin shed 3.6% in May as spot ETF flows marked a severe divergence. After early inflows, May 15 triggered a 10-day consecutive streak of net outflows totaling $2.97B, bringing the monthly net balance to -$2.43B.
Buying the broad index in May meant buying underperformers. Alpha required active selection, separating physical AI infrastructure from lagging sectors. The market has written the manual for June.
Full flow data and metrics on eToro: 🔗 https://t.co/pDs0sfA6RI
$FTSEMIB $SPY $QQQ $DELL $AVIO #Trading #Macro #Stocks #BitcoinETFs
An objective answer does not exist today. A 3.8% PCE with a 2.4% Trimmed Mean means the Fed stays on hold. A 3.8% PCE with a 2.7% Trimmed Mean signals trouble. Statistical framework selection is the real driver.
Full systematic analysis on eToro: 🔗https://t.co/8zthHD73yK
$SPY $QQQ $TLT #Trading #Macro #Fed #Inflation #PCE
🚨 US April PCE day is here. This is the first major macro release of the Warsh era at the Fed. Beyond the headline prints, a deep structural disconnect is emerging between core inflation metrics. Here is the data breakdown. 🧵👇
The Nasdaq 100 closed above 30,000 for the first time in history. The S&P 500 hit a new all-time high at 7,519. The Kospi triggered an automatic halt on program buying.
But the real story is in memory chips. A thread. 🧵
$MU $KLAC $AMAT $NVDA $TSM
Counter-signal: the Russell 2000 is up +16% YTD vs S&P 500 +10%.
Tuesday: Russell +1.8% vs S&P +0.6%.
In a consensus "narrow tech rally", small caps don't lead. And the S&P 493 (ex-tech) just posted its strongest earnings growth since 2021.
Breadth is there. The flows just haven't caught up yet.
The macro backdrop:
Fed cut probability at June FOMC: 3%
ECB June hike probability: 91%
Core PCE: 3.2%
10Y Treasury: 4.47%, -20bp from recent peak
WTI: -2% yesterday, -4% today on Iran peace memo progress
10Y breakeven: 2.375%, 1-month low
Records at all-time highs. Rate hikes expected. Oil falling. All simultaneously.