Updated version
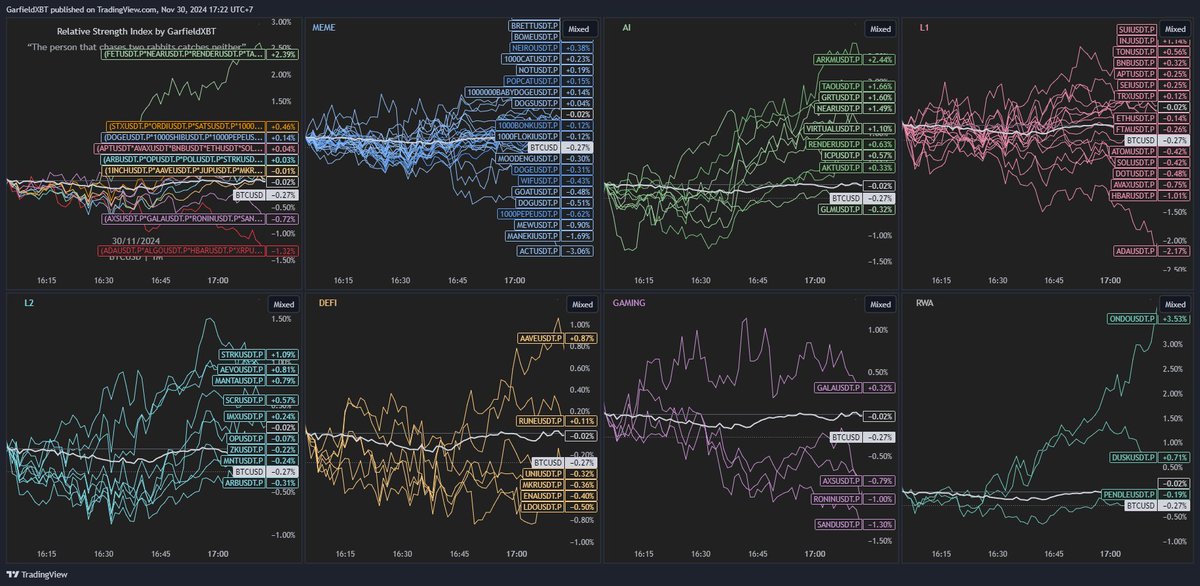
Adding anomalies like dinocoin pump and more sector. Checking spaghetti becoming my daily and weekly routine. To check what coin perform at the moment and asset filtering
https://t.co/agydCcD2Oj
For the past few weeks i've been learning trading beta,
Milih sektor mana yang outperform benchmark kaya BTC, ETH, atau SOL. Would be the highest EV when alts season is happening
So here's my template for relative strength (will update later) https://t.co/22K5IOgPAr
Spot vs. Perp CVD
Spot flow is often considered “cleaner” because it represents unleveraged demand, while perp driven moves are frequently dismissed as fake or trap due to leverage and funding dynamics.
Although this statement is mostly accurate, it requires an important distinction.
Whose effort is being rewarded by price?
> If perp buyers are aggressive, yet price fails to advance or stalls, that indicates, The market is absorbing perp demand = weak move.
> If spot flow is neutral or flat, perps continue to buy, and price still grinding higher, then the effort is being rewarded. Supply is insufficient to stop the move, regardless of the source of demand.
In that scenario, labeling the move as “bearish” or “fake” simply because it’s perp-driven is incorrect.
The market doesn’t care where demand comes from only whether it gets rewarded.
CVD Divergences Cheat Sheet
CVD (Cumulative Volume Delta) represents the net difference between market buy and market sell orders slamming into the order book. In simple terms, it tracks the aggressive market orders interacting with passive limit orders, rather than just following price movement.
This makes CVD a powerful tool to assess the effort behind price action, showing which side is truly in control.
Key dynamics like absorption (when large market orders are absorbed without price movement) or exhaustion (when aggressive flows fail to move price further), can be identified by comparing the CVD with actual price movement, to evaluate effort vs reward.
Perfect example from today
1. Slow controlled selling
2. Selling climax
Learn to only fade inefficient moves
Run up the likes & I'll break this down
You build a profitable system
Have the data
Know the edge exists
And still blow your account because you can't pull the trigger after three losses in a row
The strategy works
Your psychology doesn't
More people fail from their ability to not follow a system than the system lacking profitability itself.
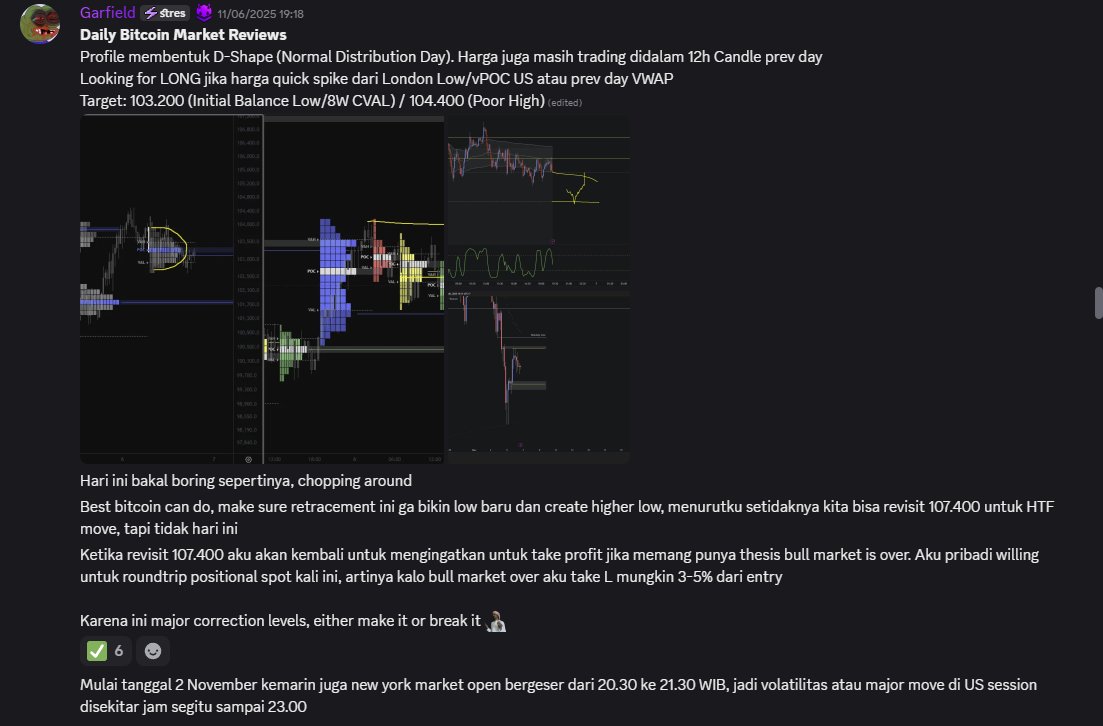
Market Profile Series #7 out! More about momentum, and the importance of "experiencing". The next article will wrap the MP series up, and then we will move to Orderflow and scalping.
Enjoy, and please repost if this series has been useful for you so far.
Session TPO Profiles 🧵
Unlike daily profiles, session profiles break down the auction into distinct trading periods — Asia, London, NY, and Pre-Close.
Each session has its own participants and behavior, giving more precision, clearer context, and sharper signals of balance and imbalance.
In the following points, we’ll see how session profiles uncover market behavior that daily profiles tend to blur.
You can now add multiple TPO sessions to your charts, segmented by market trading hours like London, New York, and Asia.
It’s perfect for spotting how each region builds structure and flow through the day.
Custom sessions are coming next.
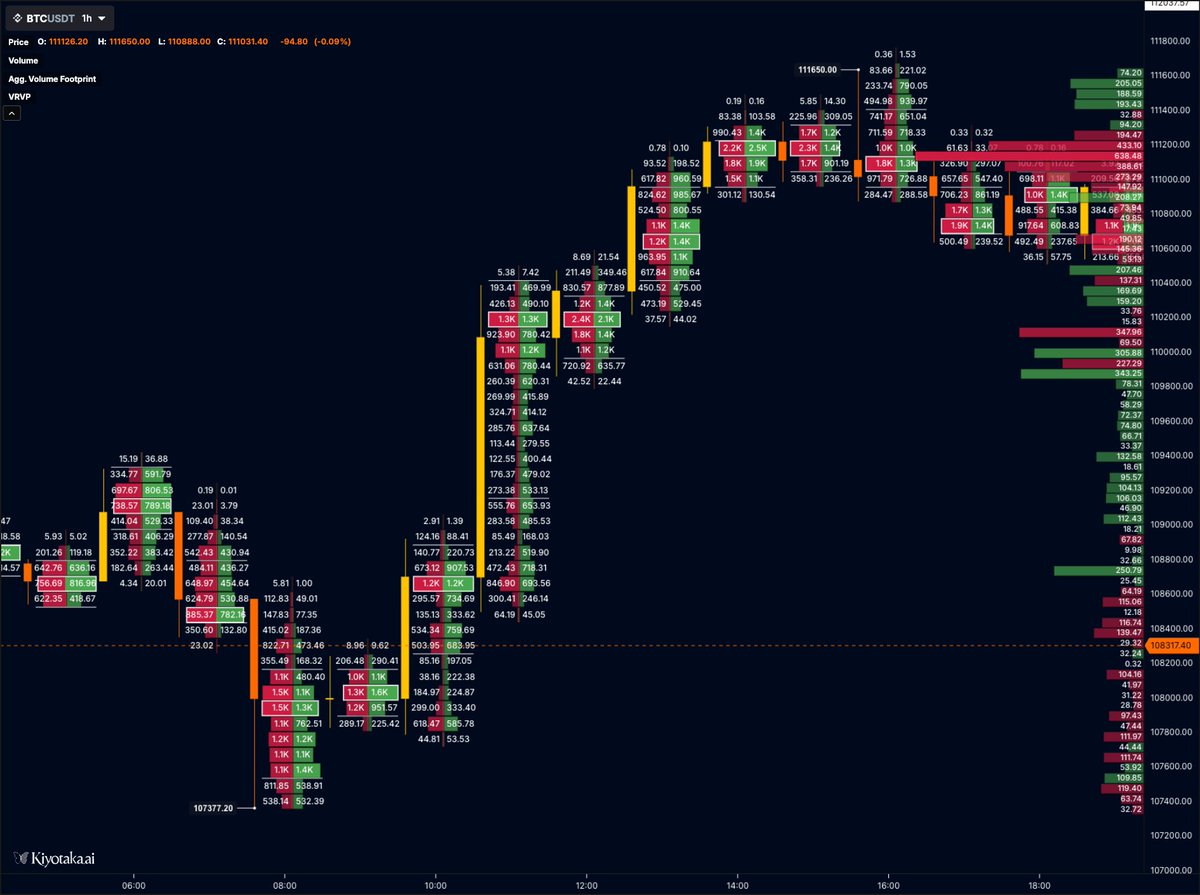
We're launching something that's never been done before: Aggregated Volume Footprints.
We now merge order flow from up to 14 spot and perp exchanges into one global view. Now you can watch order flow across every major exchange at once.