🚨 Real-time #renewables dashboard for gas/power traders
Wind + solar can swing gas burns, load balance, and intraday price risk… so I built a live grid view by ISO.
https://t.co/FQjk9JZIuI
#natgas#trading#power
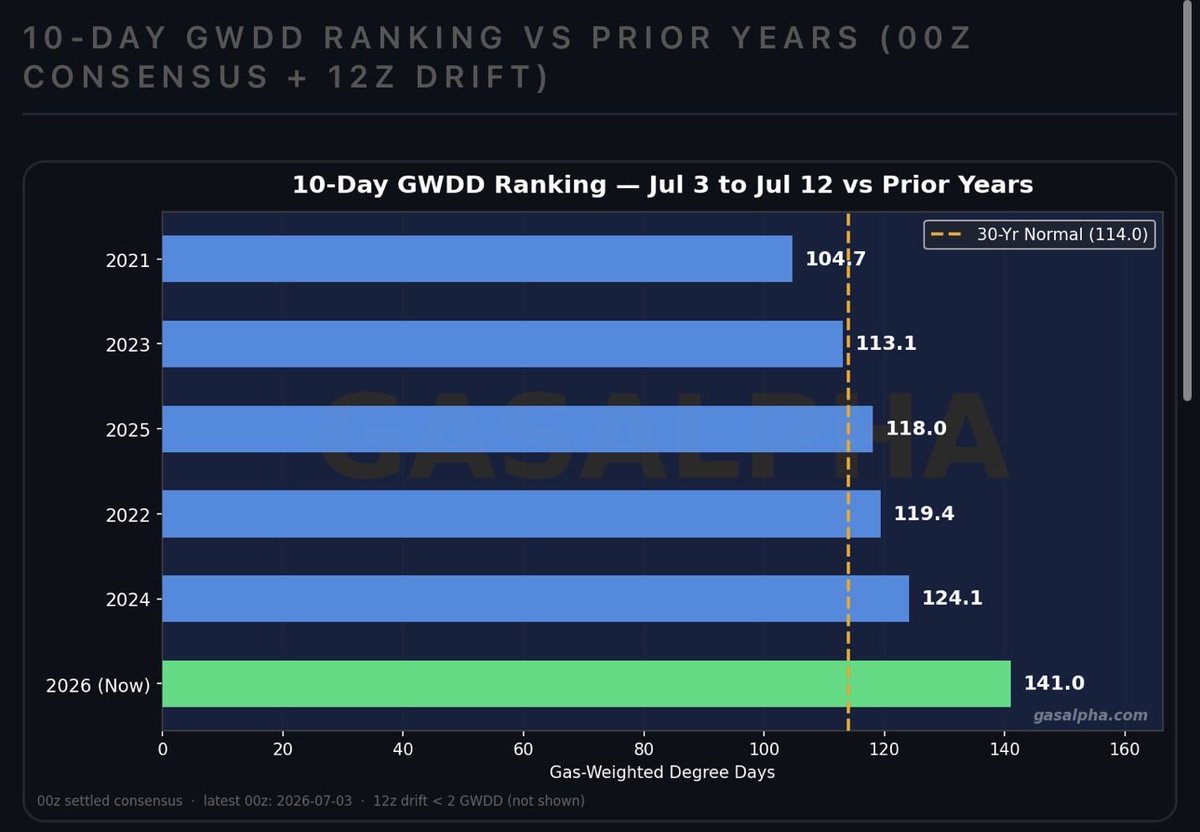
GFS 00z keeps heating up.
Both now well above the 5-year avg.
Summer gas signal = heat where it matters for power burn.
https://t.co/pqaekBzRly #natgas#pwcdd#gwdd
That’s why I’ve been posting PWCDD more lately.
In summer, the cooling load in the power stack can matter more than the raw national degree-day number.
The market does not just care that it’s hot.
It cares where the heat is hitting.
https://t.co/HJVJPqtOMh #natgas#pwcdd#cdd
1/
The headline weather number is not always the number that moves summer nat gas.
The better question:
Is the heat showing up where it actually drives gas-fired power burn?
That’s what the PWCDD–GWDD spread captures 👇
Simple version:
GWDD tells you broad gas weather demand.
PWCDD tells you summer power-burn pressure.
When PWCDD is running well above GWDD, the weather signal is more bullish for power burn than the headline gas-weighted number alone might suggest.