Many traders make a mistake and then compound it in frustration by suddenly taking a shit trade or betting way too big etc
And so this is a wonderful time to remind you that if you have a flat tyre you don't get out of the car and slash the other three like a cunt
Cheers
When it comes to passing challenges and getting paid out, most traders don't even have a system they can follow with set rules
That changes today, as I share one of my top performing systems for passing challenges and getting paid out
👇 🧵
Made a graphic that consolidates all of ICTs Weekly profiles into a quick refence format. This is from Core Content Month 7-Video 2. IYKYK 😜Feel free to use if helpful with your studies! #ICT#ICTStudent#WeeklyProfiles#NWOG#NDOG
I used to miss a lot of trades waiting for specific PD arrays to be hit before executing. Now, I am more interested in which PD array is being traded to during that specific time of day.
Important Statistics that will improve your trading:
$EURUSD - 80% probability price retests Mon London Open on Tue/Wed
$GBPUSD - 80% probability price retests Mon London Close on Tue
Mon and Fri have the highest probability of being the High or Low of the Week for all $USD pairs
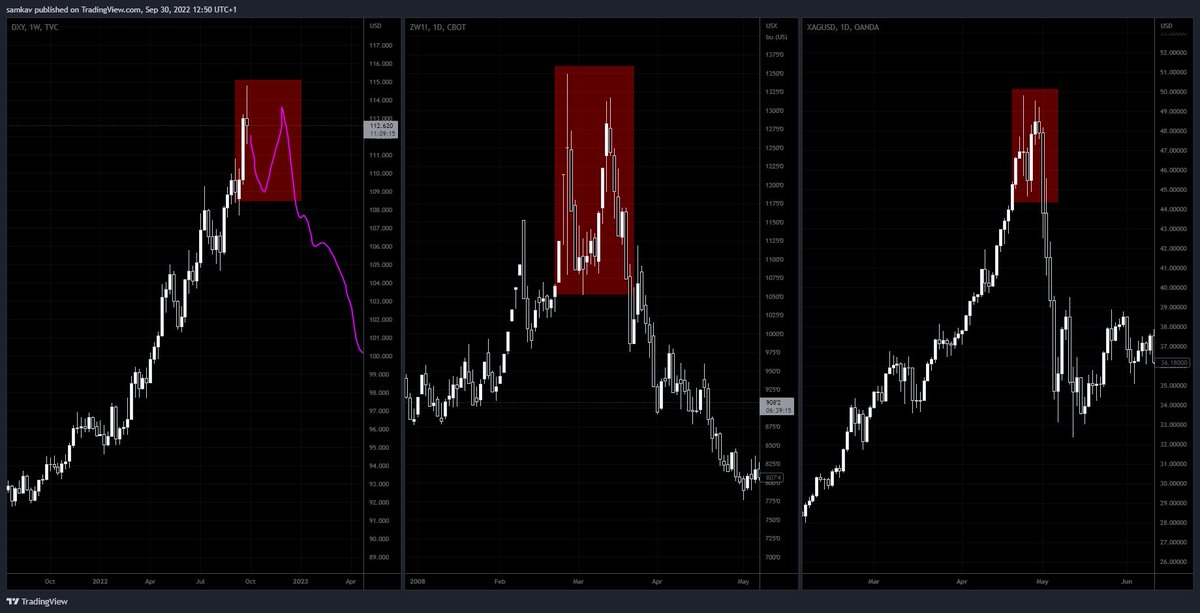
Those who ever studied @Trader_Dante 's stuff might remember a pattern he mentioned once he'd seen play out in Wheat in 2008 and Silver in 2011.
This very pattern has marked the All time high of both the wheat and silver market.
I wonder if the USD might be ready to go
If you have a pair or asset that from Monday to Friday has seen a steep one way move
And the following week, we continue in that direction into a reference point/ Point of interest (whatever you want to call it), its very likely there will be a mid week reversal on the week
Weekend Study 👀❤️
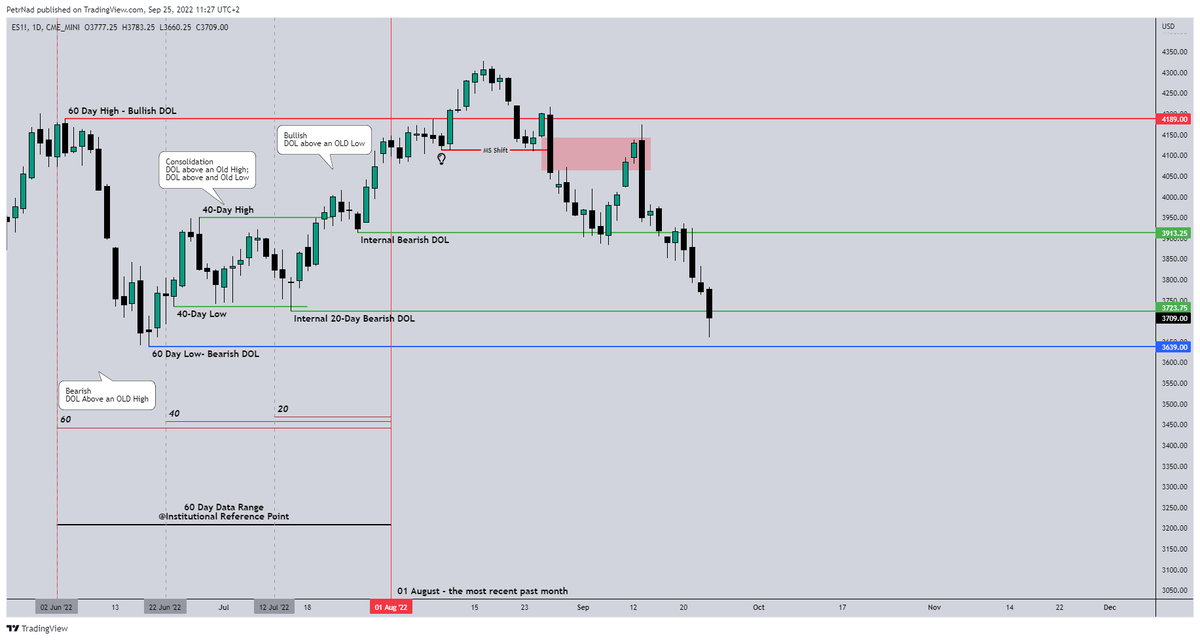
20/40/60 & Quarterly Shift topic..,
These 20 / 40 / 60 Day or 3 Month; Old High & Lows are Institutional Reference Points for IPDA.
Keep them on your charts.
ICT said: Ask yourself, what could the next weekly candle look like? You don't need to know the closing price.
I said I expect a bullish start of the week, creating a HOTW and closing bearish. Now, look at the candle. Random? This is the Power of 3.
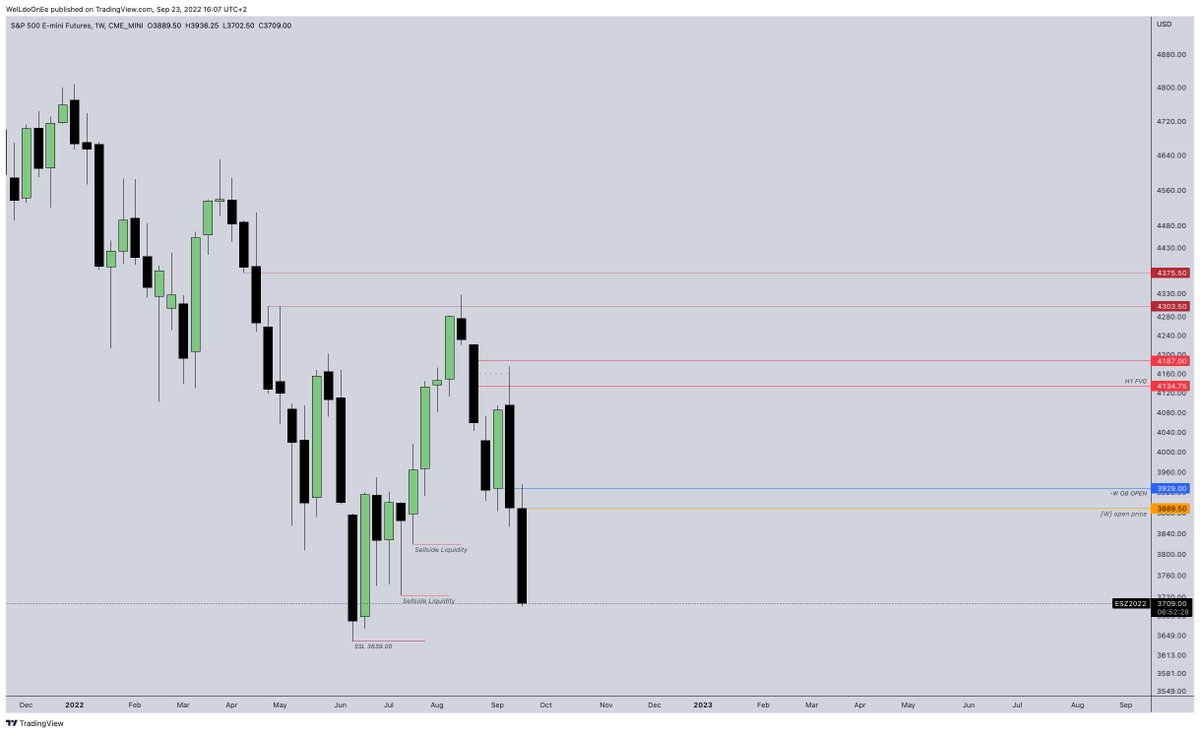
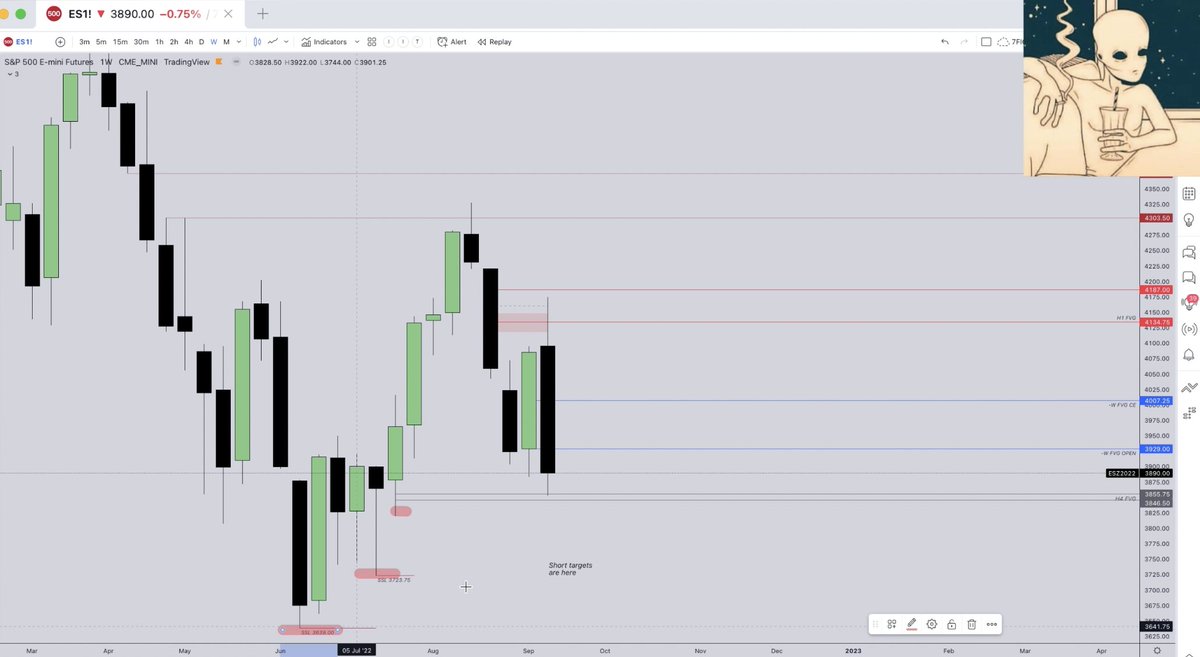
Short targets were on point
The higher time frame "draw on liquidity" or "narrative" is really the only important thing for me, lower time frame MMXMs will form everywhere, the high probability ones form in line with the HTF narrative
HTF Premium/Discount FVG or Swing Point hit --> DOL up/down --> LTF MMXM
ICT quote : Keys to daily biais…
-Every day biais is unrealistic
-Determine the likely weekly expansion
-Look for obvious liquidity in that direction
-Identify imbalance in price delivery top down
-Focus on the high or medium calendar news event dates
“You just need to know where is the market likely to draw to… that is where a majority of your time should be spent… not where do i get in because that is the easiest part” - ICT
Price action concepts tend to create predictive traders but it doesn't have to be that way.
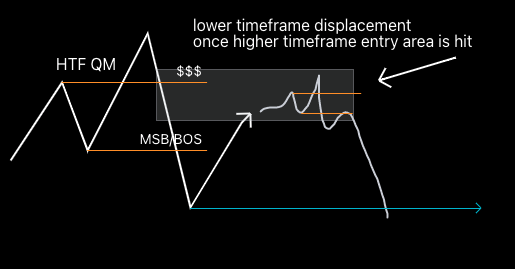
Instead of assuming a FVG or breaker will hold, look for a new lower timeframe structure break at that higher timeframe area you're looking to enter on.
Basic confluence to reduce L's
This should answer the questions from my last post...
"How do you trade the OHLC of the daily candle & what does it look like?"
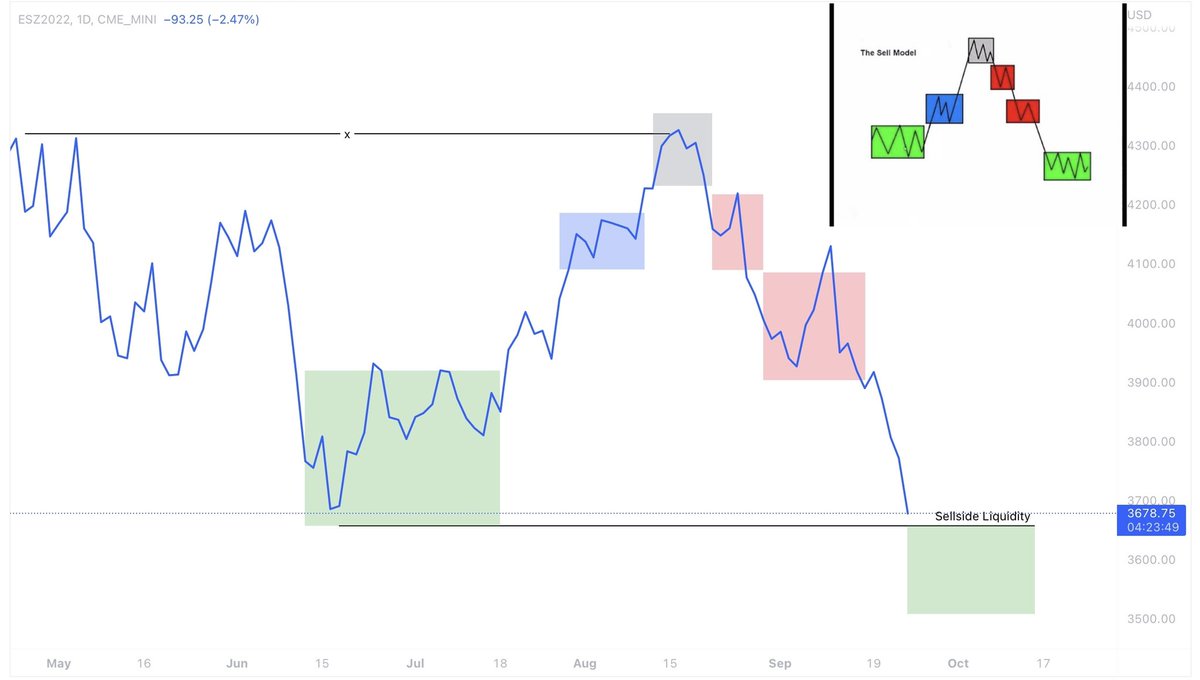
This is an entire trading model...
You can quit your job with this.
You can pass funded accounts with this.
You can make MILLIONS with this.
💎