We'll have to wait until Sunday night to see how the weekly candle will close, but if it closed here it would confirm the weekly bullish divergence for the crypto market.
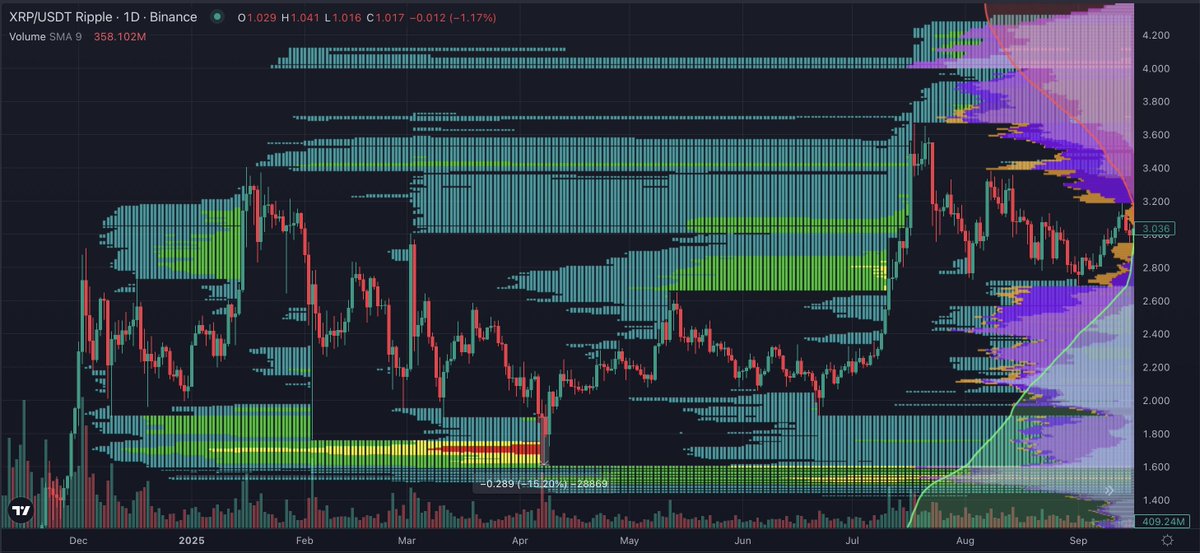
In April 2025, when ripple:native was hovering and finding support multiple times around the $1.90 level, we had red liquidity building below us, similarly to how we do now.
When we finally lost that $1.90 support, XRP crashed 15.2% in a single day before ultimately recovering and then going on to set a new all time high in July 2025.
Now, if we did something similar in terms of move size, we would come down to around $0.85.
After the July all time highs, we did come down and sweep the liquidity that was left below. This happened on October 10th.
This is one of the things that I've been so vocal about in this cycle currently. I want this liquidity gone below us because, as you can see when I show you from this zoomed out perspective, that's the last bit of liquidity to the downside that we really have on XRP.
If, slash, when we take this, the only real thing left will be all time highs.
So, I'll be saying that I think we're going to start to head back at least towards the liquidity up at $1.87, and then from there, it looks like we stair step different areas in order to chase liquidity up towards all time highs.
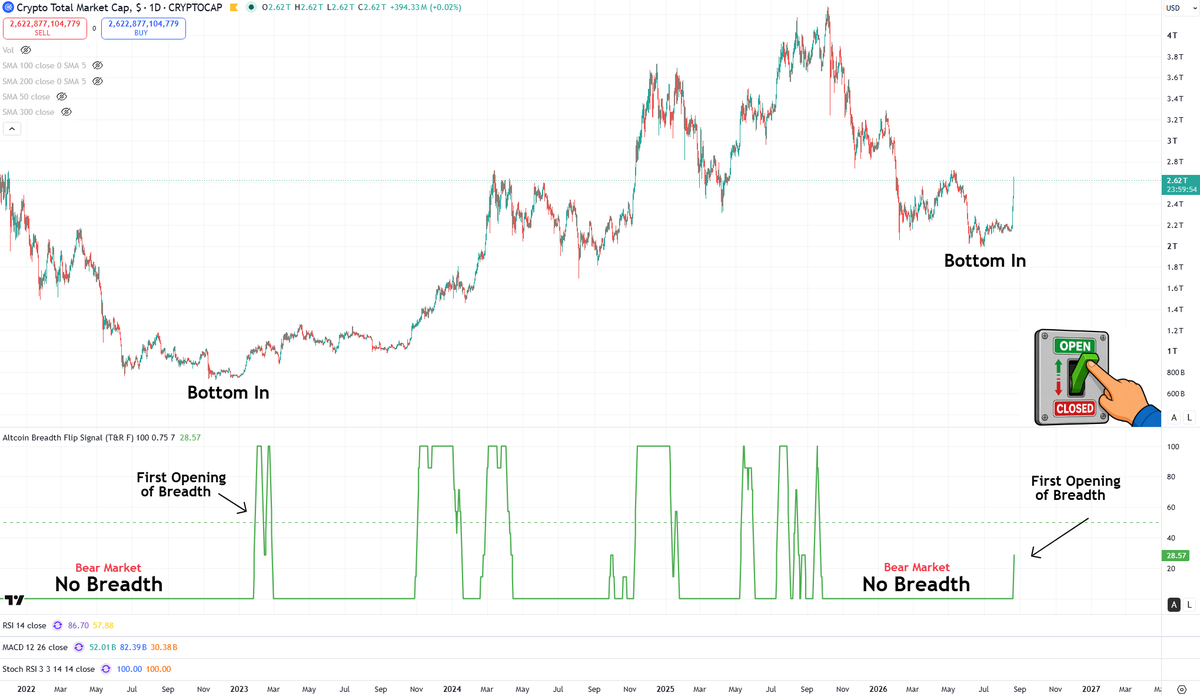
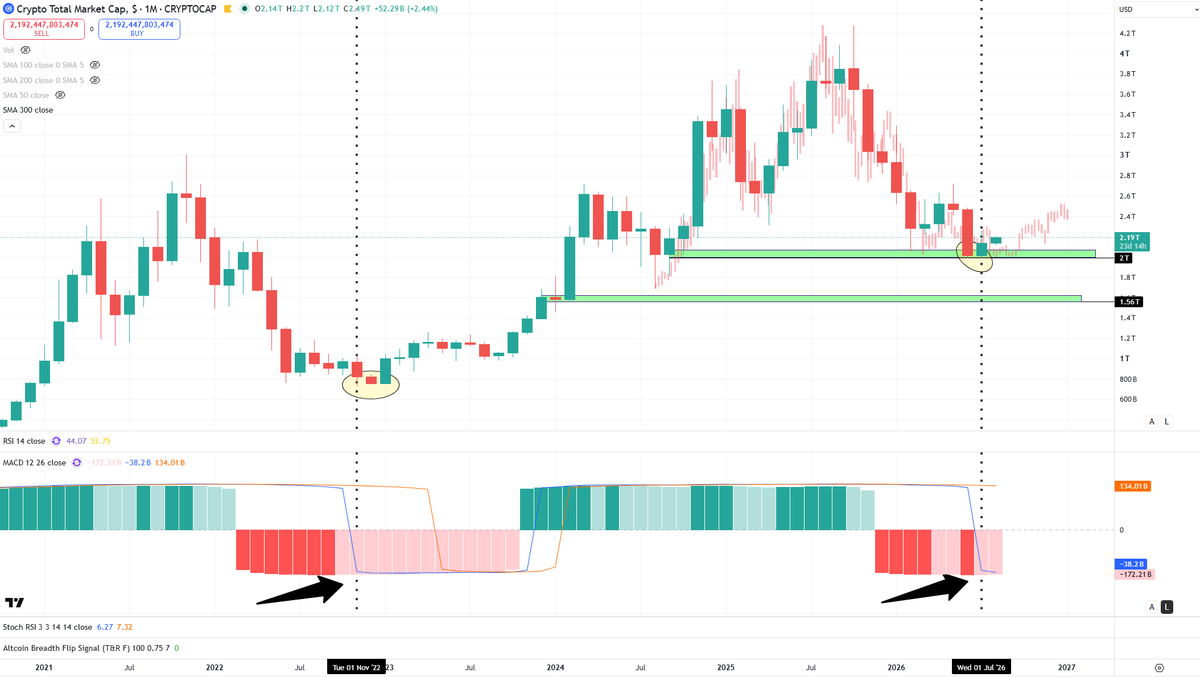
In 2022, when the monthly MACD crossed through zero, FTX collapsed & Bitcoin hit 10.6 million coins in a loss.
In 2026, when the monthly MACD crossed through zero, STRC de-pegged, Strategy sold & Bitcoin hit 10.8 million coins in a loss.
In 2022, that was the bottom of TOTAL.
This shows business cycle acceleration.
We are in economic expansion, nothing like the 2022 bear market.
This is why risky stocks have been in price discovery since late 2025.
That risk appetite will spill into crypto ultimately. There's always a lag.
Buckle up.
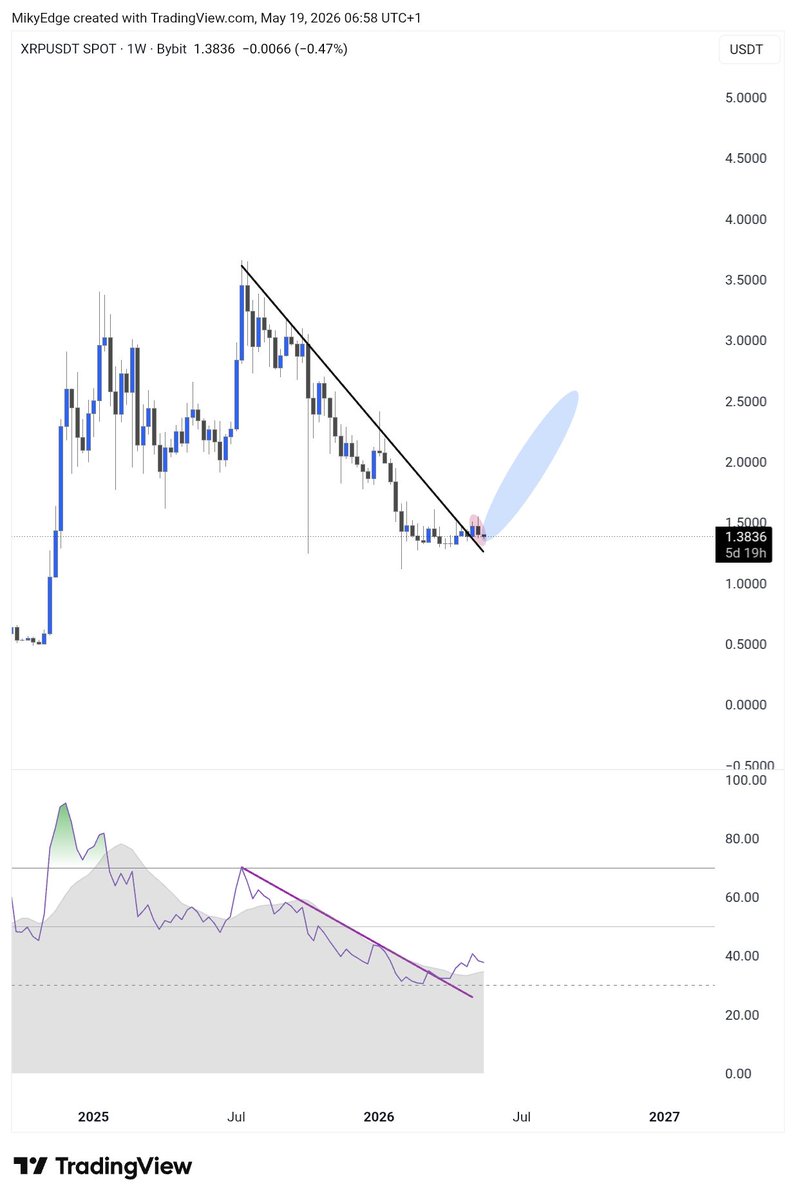
And now, $XRP weekly is quietly turning.
The Macro Wave 4 Low Is Likely In, Wave 5 Surge to Double Digits is Loading.
A hidden bullish divergence just printed on the weekly RSI, too.
Most people will realise Wave 4 bottomed months after it did. Some already know :)
Where were all the pessimists in September and October of last year? The herd was bullish for Q4.
Now the herd is pessimist and coralled looking for bearish Q4.
They always move together.
For the past couple of weeks I've presented the idea of of what we're seeing in the market today.
Here's an excerpt from my May 22nd video. We essentially are looking to see if BTC can find its footing in the 64-67k area for a few days to signal there is a strong support here.
Hi all!
XRP Update on the 2-week time frame!!!
The primary Elliott Wave structure is intact 🌊
Resistance & Support apex has no more room, and is expected to deliver a strong surge through the end of May.
Supports: $1.36 – $1.31
Resistances: $1.47, $1.88, $3.56
#XRP will break that Orange resistance.
Throwing this out there for future reference regarding ~$106k.
If $60k low holds for Bitcoin, then the .702 retrace is also the weekly resistance of late 2024 / early 2025 when the technical strength of the bull run ended.
Be alert of social media euphoria/confidence there.
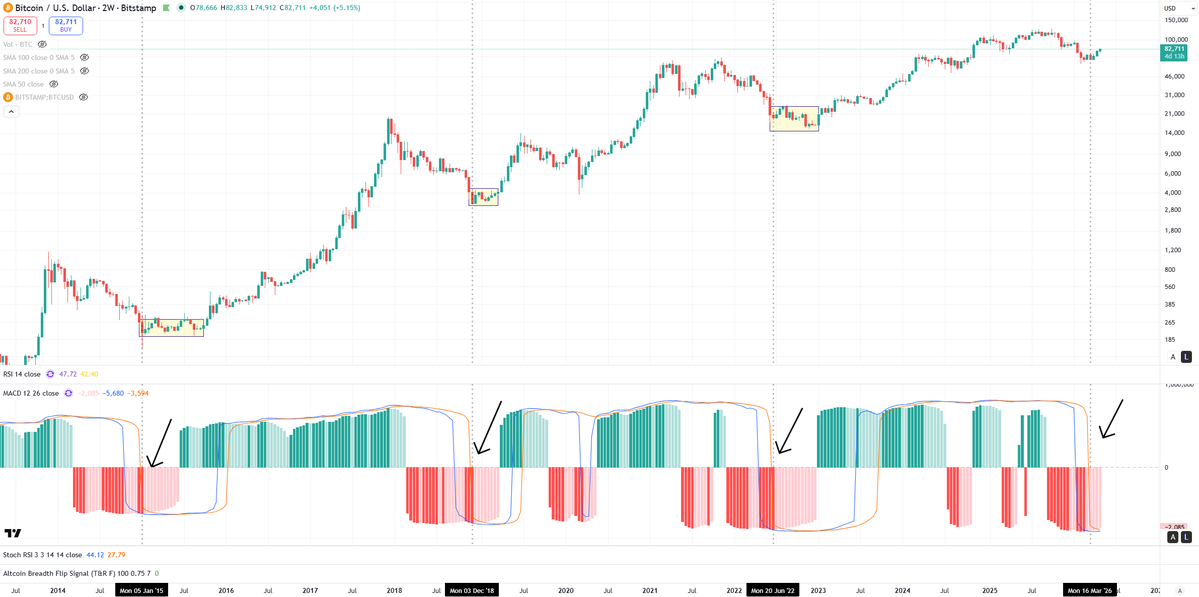
"Bear markets in the crypto space historically conclude and enter into accumulation and bottoming formations once the 2-week MACD has its 9-week EMA crash to the lows (orange)."
Track record still stands.
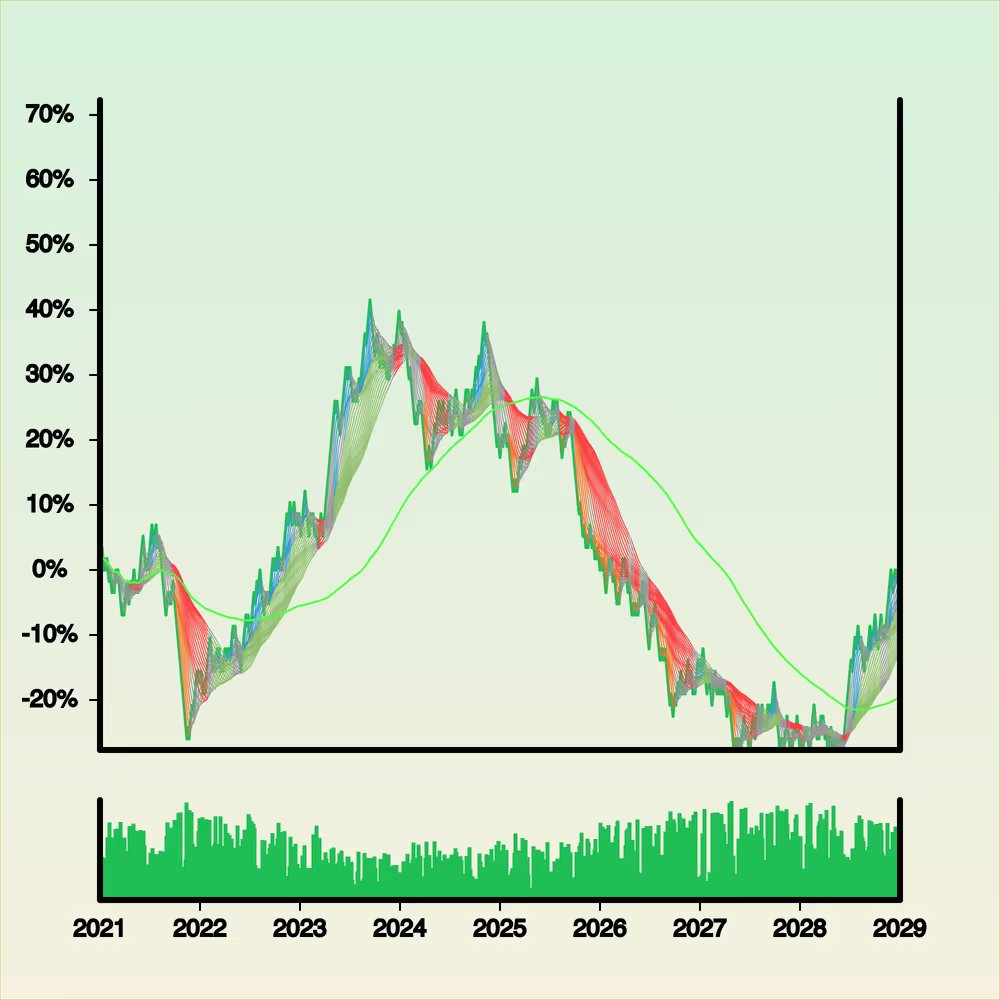
Some of y’all still don’t know the story behind Wonky Stonks and why I will continue to relentlessly bull post them.
With NFTs starting to wake up a bit (imo still disbelief stage), I think it’s important to revisit it:
Summer of 2021, the NFT marketplace started to wake up. Punks, Apes, Squiggles, and Penguins were all sending. I wanted to launch a collection that resonated with my audience and introduce the trading community to the NFT space.
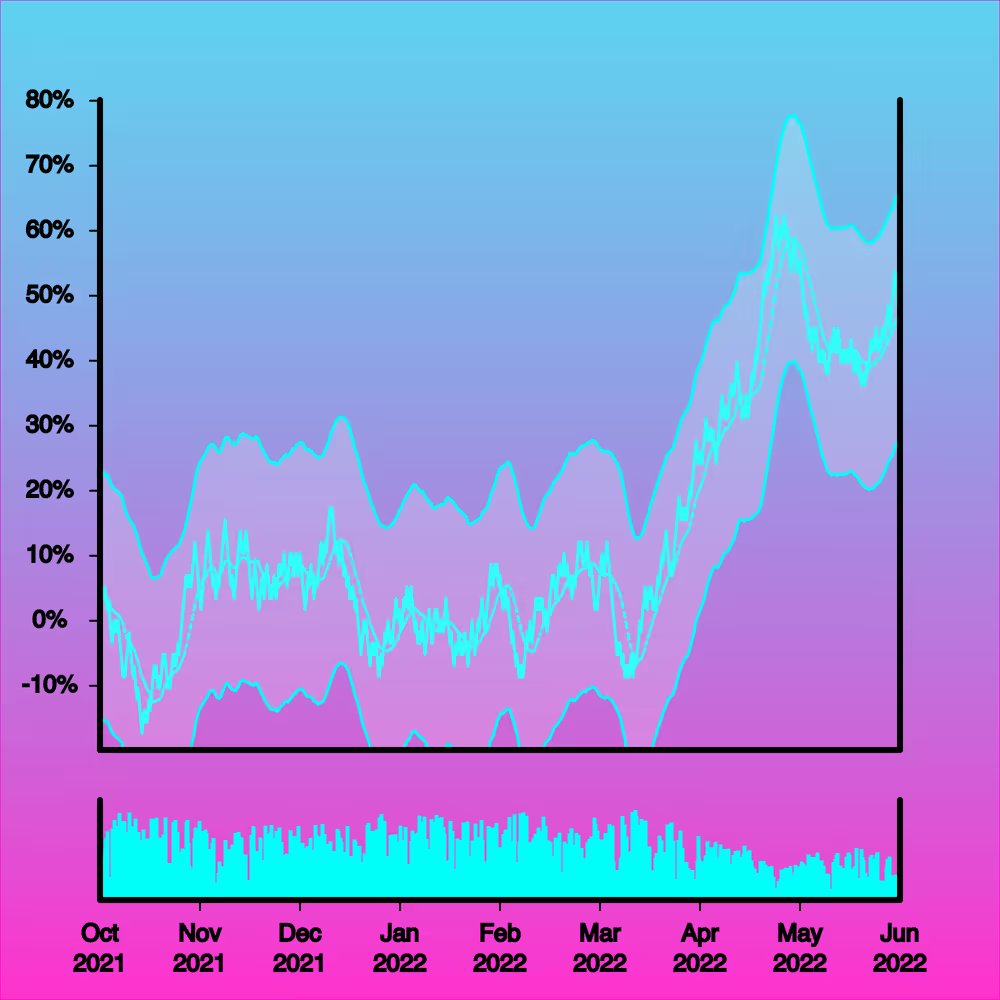
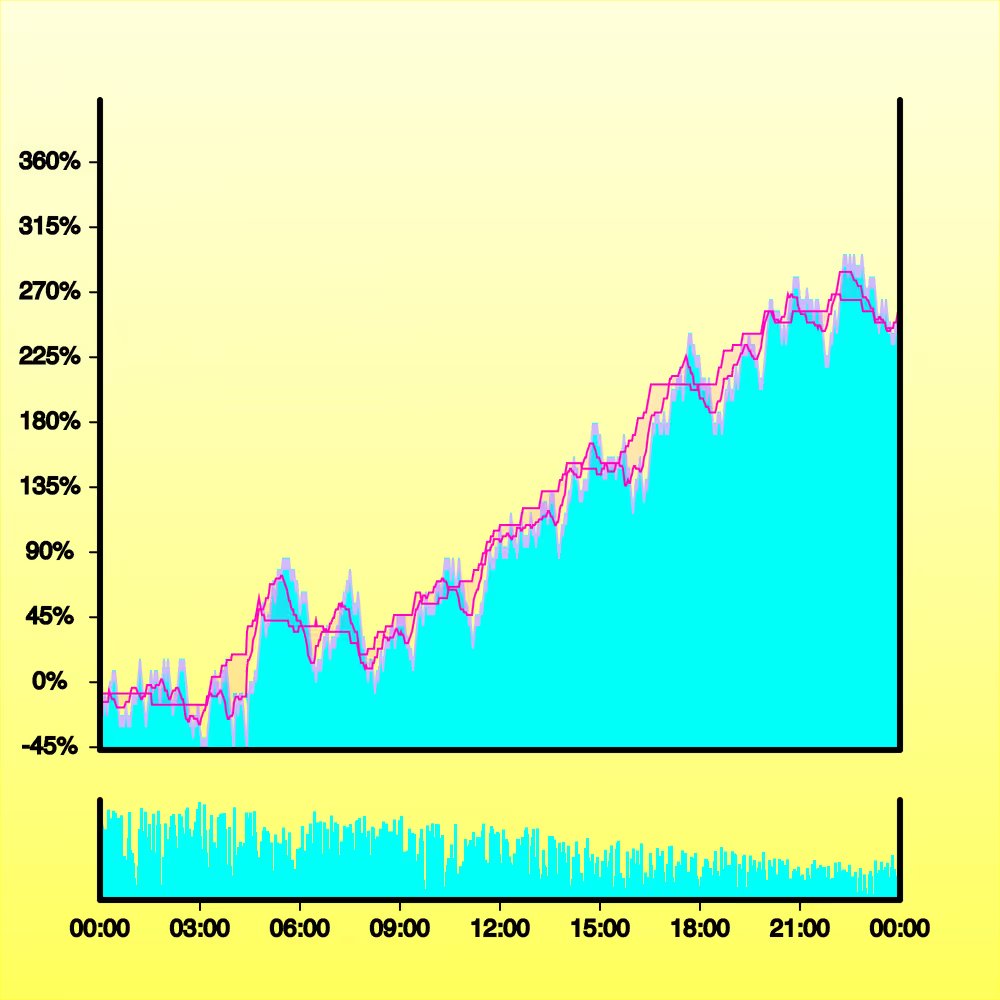
So rather than doing a pfp collection, we came up with fully generative digital art of charts. It felt way more authentic to my brand, and it was something that hadn’t been done before. If you’ve stared at charts for long enough, eventually they become art.
And seeing how an algo could randomly generate price action that resembled real structures so well was beautiful to watch. The ultimate meme was people collecting charts rather than just studying them all day.
I wanted to do it in a fair way, so we decided to do a free mint with a stealth launch.
No honoraries.
No hype and crazy price gauging.
Any wallet could claim one stonk for free.
The goal was to give back in the process, but I honestly had no idea what it would really turn into from there. It minted out in just over an hour with an initial 81% unique wallet distribution. Pretty soon I fell in love with the community that grew out of it.
Utility was the ultimate meta back then and everyone asked for it, but I truly believed (and still do) that the art was enough. As we’ve seen with countless collections, utility fades with time.
Art survives.
It was born at the end of the last bull market, and cultivated through the entirety of the bear. The community is as cultish and strong as any that I’ve seen out there.
I own over 250 stonks, and have given away just as many over the years. I’ve purchased ALL of them that I’ve ever owned on secondary markets outside of the one free mint I got day one.
For me it’s a project of passion. I’ve definitely put way more into it from a financial perspective than I’ve gotten out of it, but I love the community and I truly love the art. I’m not going anywhere and neither are the Stonks.
Wonky Stonks are inevitable.
It's totally normal to feel bored and checked out right now. This is how the market always acts after bear markets as it's bottoming and trying to rebuild itself. Enjoy life. Smell the spring roses. Have some fun. The exciting times requiring our constant attention will return.