Doubling Theory.
Quarterly Theory.
Oracle Theory.
Liquidity Dispersal Theory.
Gaps Theory.
Weighted Probabilities Theory.
Weekly Halving Theory. etc.
Everything applies Newton's Law:
For every action there is an equal and opposite reaction.
Top những câu nói bất hữu Lê Duy:
- bán vàng múc sol
- eth break 5k
Thời điểm nói: 26/8/2025
Đến bây giờ: 4/6/2026
- vàng tăng 32,8%.
- sol giảm 63,3%.
Ví dụ nếu đầu tư 100 triệu VNĐ ngày 26/08/2025
Mua vàng: hiện giá trị khoảng 132,8 triệu VNĐ.
Mua SOL: hiện giá trị khoảng 36,7 triệu VNĐ.
Học viên của Lê Duy đang khóc!
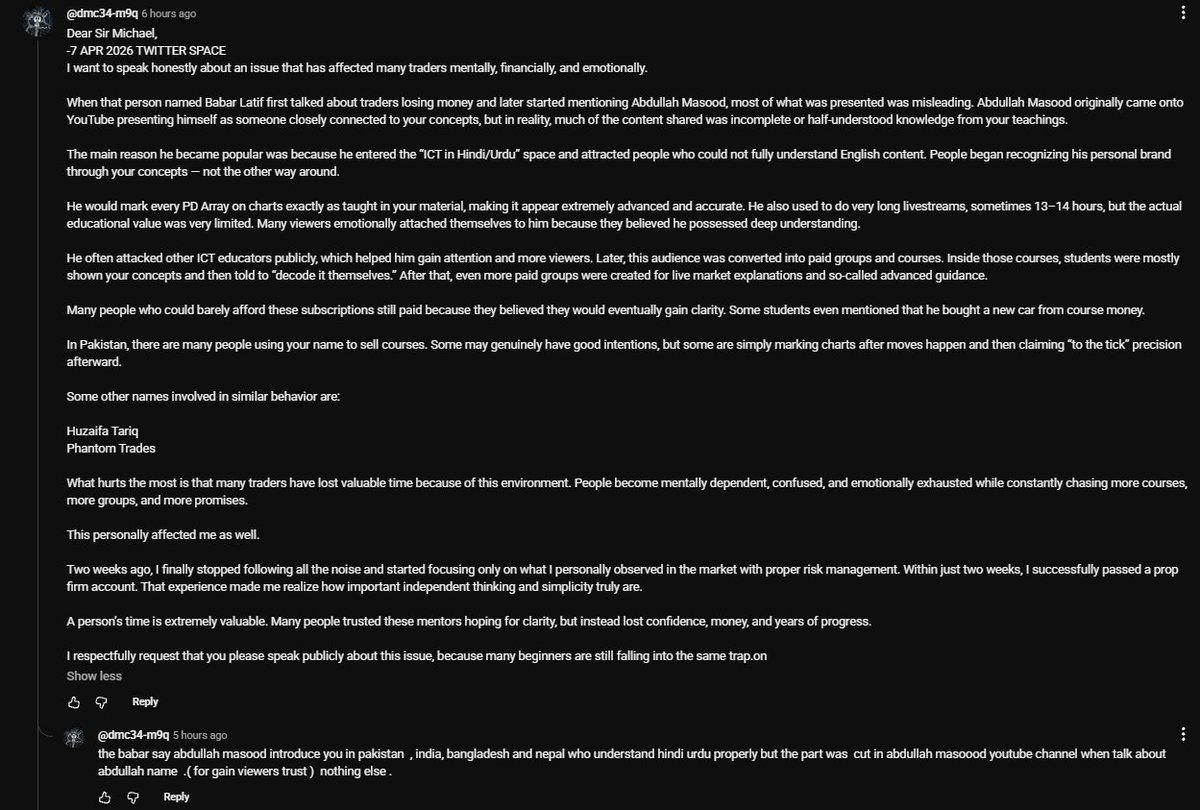
This is someones Comment under Recent ICT Video
Don’t pay a single penny to anyone for ICT educational content.
Funny when course sellers say “free content isn’t good enough"
Meanwhile they learned from free ICT videos themselves before repackaging it into a paid course.
How Time Controls Price Delivery ?
Price delivery during New York session is heavily influenced by predefined time windows where liquidity is engineered, repriced, and expanded toward higher timeframe objectives.
Understanding these time elements changes how intraday price action is interpreted.
NY AM SESSION:
• 7:00 A.M. → NY Killzone begins
• 7:00–8:30 → Premarket Silver Bullet
• 8:30 → Early Open / News Embargo
• 9:30 → Equities Open
• 9:30–10:00 → Opening Range
• 10:00–11:00 → AM Silver Bullet
The 9:30 Opening Range is one of the most important intraday windows.
This is commonly where the market:
• Creates the high or low of the day
• Runs liquidity
• Rebalances inefficiencies
• Establishes directional delivery
If bullish, the algorithm often engineers sellside liquidity below short-term lows before expanding higher.
If bearish, the algorithm often engineers buyside liquidity above highs before delivering lower.
PM SESSION:
• 12:00–1:00 → P.M Lunch Hour
• 1:30 → PM Open Macro
• 2:00–3:00 → PM Silver Bullet
• 3:15–3:45 → Final Hour Macro
• 4:00 → True Day Close
• 4:30 → NY PM Close
After lunch hour, the market transitions into a different delivery phase.
By 1:30 PM:
• AM manipulation is usually complete
• Daily targets may already be reached
• The market prepares for either continuation or reversal
Between 2PM–3PM, the PM Silver Bullet window often delivers:
• Liquidity runs
• Inefficiency rebalancing
• Expansion setups
• Continuation or reversal delivery
Then comes the Final Hour Macro.
3:15–3:45 PM is one of the cleanest delivery windows of the day.
If higher timeframe liquidity remains unsatisfied, the market will often expand aggressively toward that objective before close.
Markets are programmed around liquidity and time.
If liquidity is engineered before the open, then continuation becomes more likely.
If liquidity remains untouched into key macro windows, then manipulation is more likely before expansion.
The objective is understanding how the algorithm shifts delivery based on current market conditions and liquidity positioning throughout the session.
If you want to be profitable, you must collect data of your system.
Most traders think journaling and collecting data are the same thing. They’re not.
Journaling is a review of price action and emotions. And it’s important too.
Data is tracking the numbers behind specific rules of price delivery.
Data gives you confidence. Not the fake confidence of a winning streak. Real confidence — the kind backed by numbers.
Data gives you the information to build your own risk management plan. Not someone else’s. Yours.
Data tells you exactly what to do for each market condition. When to trade. When to sit out. When to size up. When to protect.
That’s how you build an If → Then system.
So you know what to do in every situation before it happens.
In simple terms, data will make you free and independent.
The Quarter Sequence chain never breaks, and remember… HTF quarters are the ones controlling time in the lower quarters, so always try to align the HTF quarters with the lower ones, at least so you can have the highest probability setups.
For example:
Let’s say the Quadrennial Cycle is currently in Q1.
If the cycles below it are not in Q1, that’s completely fine. It does not mean you shouldn’t participate. You can identify a smaller chain or focus on smaller chains that align with a higher quarter.
For example:
Quadrennial > Q1
Monthly > Q2
Weekly > Q2
Daily > Q1
90m > Q1
Micro > Q1
This is just an example so you understand that you can look for smaller chains. What matters is that the chain exists, that the sequence exists, and that it is guided by a higher one… not just matching chains randomly, because it is never random.
I’m going to give you a task so you can try to disprove everything I’m writing here.
Go to @traderdaye Twitter (X) and study every chart he has shared. Look at the dates, then go back to your own charts and analyze what sequence existed in every setup or analysis he shared… and prove me wrong.
Jane Street pays $650,000 a year for quants. MIT wrote the exact bible to get there & released it for free.
51 pages. Zero to quant. Probability, stats, market making, real interview questions from Jane Street, Citadel, Two Sigma & more. Bookmark, before someone takes it down.
Sessions are not Killzones
Session{--------[KZ]-------------}
Asia Killzone: 7PM - 10PM EST
Asia Session: 7PM - 5AM EST
London Open Killzone: 2AM - 5AM EST
London Session : 2AM - 11AM EST
Killzone Highs & Lows [Don't limit your analysis to just these]
Session HIghs & Lows
HIGH PROBABILITY PSP
When PSP occurs after SSMT there is high probability reversal
Weekly SSMT —> 1H PSP
Daily SSMT —> 15M PSP
90m SSMT —> 5M PSP
In HTF PSP you can look for LTF PSP to get better entry
More confirmations I will post next week, if you are interested
HOW TO TRADE ICT ON ANY TIMEFRAME?
ICT concepts work on any timeframe.
The edge doesn’t come from chart size - it comes from top-down alignment.
1️⃣ Start with HigherTimeframe Bias (HTF)
Use Daily or 4H to define:
Draw on Liquidity (DOL) - where price is objectively reaching next
Market structure that supports that draw
Premium & Discount relative to the HTF dealing range
Key liquidity (equal highs/lows, old highs/lows)
Your bias always comes from HTF - even if you trade the 1m.
2️⃣ Mark Higher-Timeframe PD Arrays
Identify areas price is likely to react from:
Fair Value Gaps (FVGs)
Order Blocks
Previous Highs & Lows
Session highs/lows
These are areas of interest, not entries.
3️⃣ Drop to Your Execution Timeframe (LTF)
On the LTF, wait for:
Liquidity to be taken in the direction of the HTF draw
Displacement showing a change in state of delivery
Entry using a refined FVG or OB aligned with HTF context
This is where precision comes from.
📌 Rule of Thumb:
HTF = Direction & Objective
LTF = Timing & Entry
Timeframes don’t change ICT - context does.
A 15m trader and a 1m trader can take the same trade with different executions.
⏰ Respect Time:
London & New York sessions
Killzones
Manipulation windows (e.g., Judas swing when applicable)
If Your Model Fails, It’s Usually Because of:
No clear HTF draw on liquidity
Trading premium/discount incorrectly
Ignoring liquidity and time
Final Truth :
Master one model.
Apply it across timeframes.
Consistency > Complexity
RT if this helped. 💡
For the Record:
My FVG Theory is the Real Point Of Control.
My Order Flow is what the Market refers to.
My Liquidity Pools are the Depths The Markets reaches into.
My 1st Presentation Theory is the Value Area High and Low.
My PD Arrays give you the future long before anything else even hints at so called "foresight".
As we will prove all year long.