#Mapflow Forest crowns output as points (the data is still based on real tree crown estimates, including area, radius, and height). Apply meaningful, data-driven styling to your mapping design.
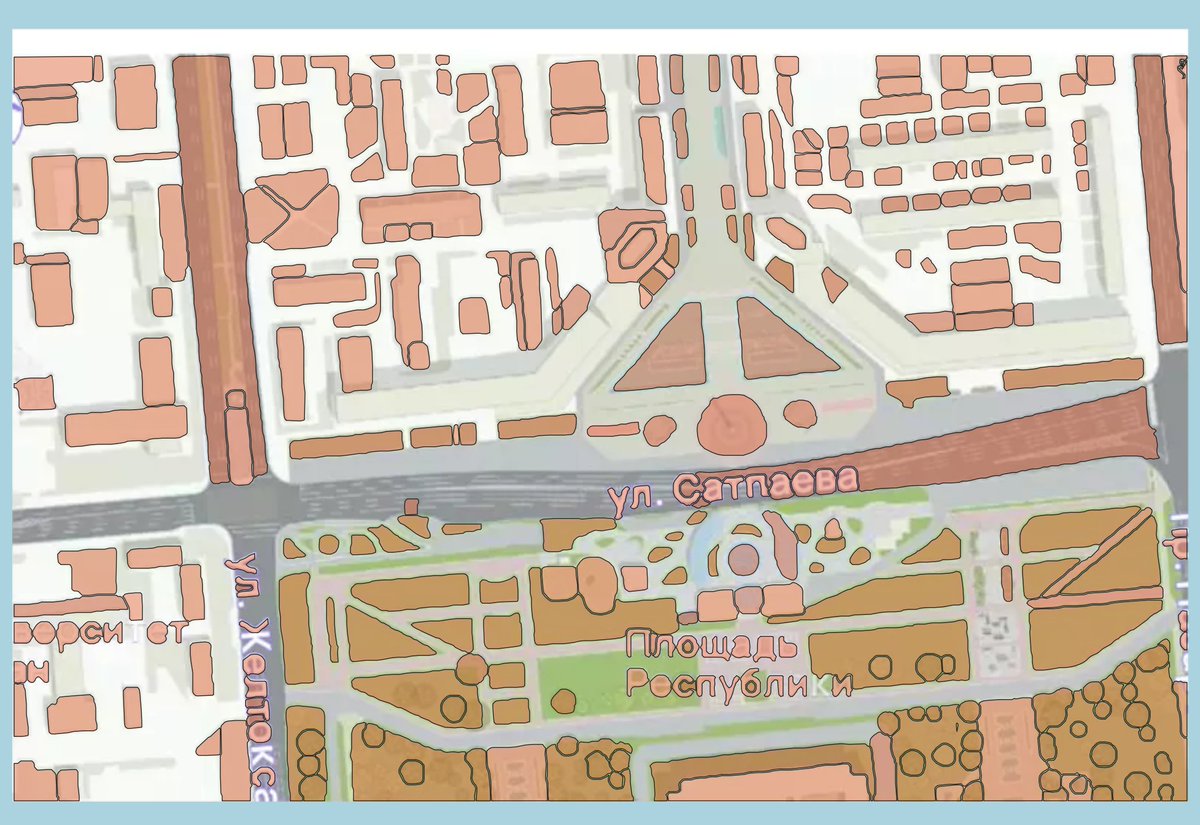
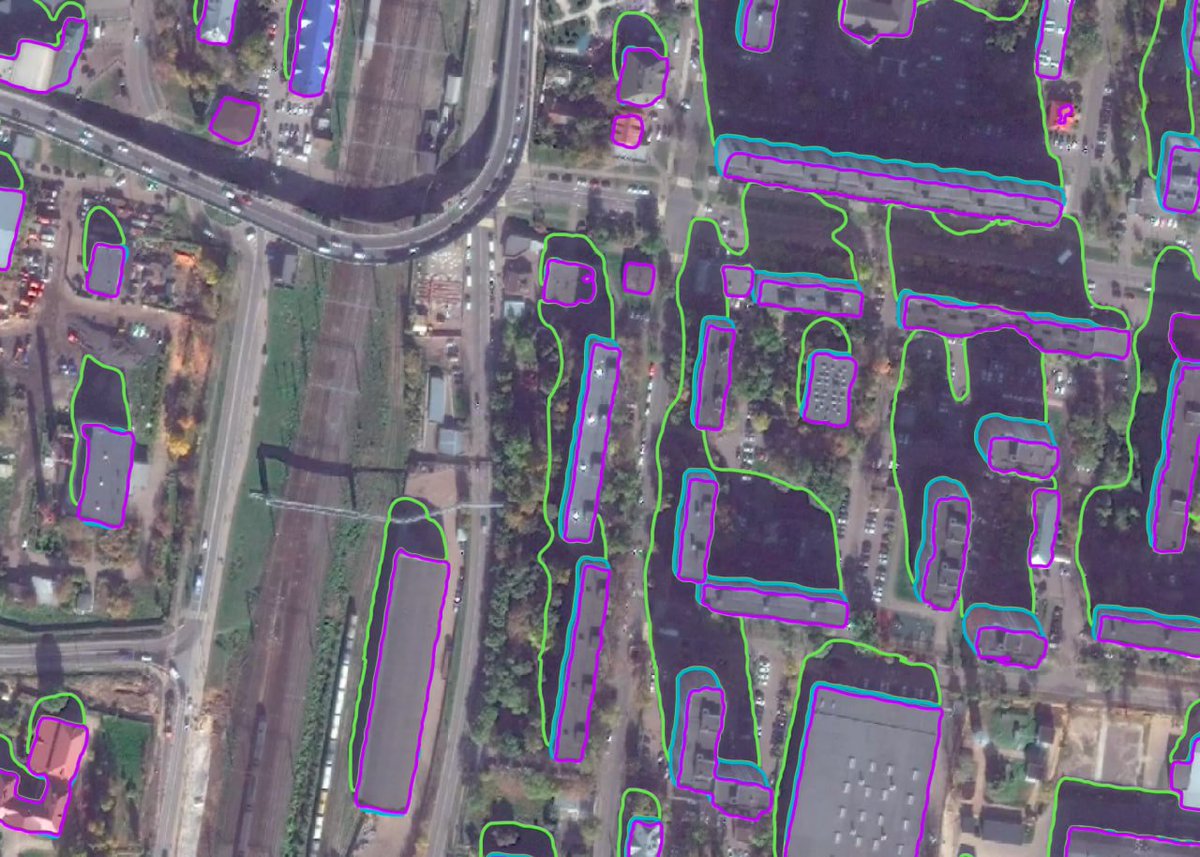
We’ve spent a good amount of time striving to find the best possible simplification for the Buildings model.
🚀We ended up with a new tool and a compromise to settle on two options instead of one: Simplification and Regularization.
Read more in our blog 👀 https://t.co/QK1POSgIuP
🚀 We are launching a major update to Mapflow’s satellite imagery search.
Why Mapflow Search is not yet another commercial imagery marketplace with carts and checkouts?
Read the full story on our blog: https://t.co/H0dwyMS7PH
A little late for #30DayMapChallenge - My Data, but sharing our #Mapflow AI usage statistic for last month.
The trends by countries and the numbers displayed on the global map.
For the data we use Postgres/#Postgis and for the statistics and charts we use Apache #Superset.
Tomorrow #Geoalert and @EthaumVenture will host an event dedicated to 'Innovations & Policies Disrupting the Geospatial Analysis Space'. We have 5 experts onboard and more than 80 attendees registered. Join us online –https://t.co/JGNUK5bZGZ
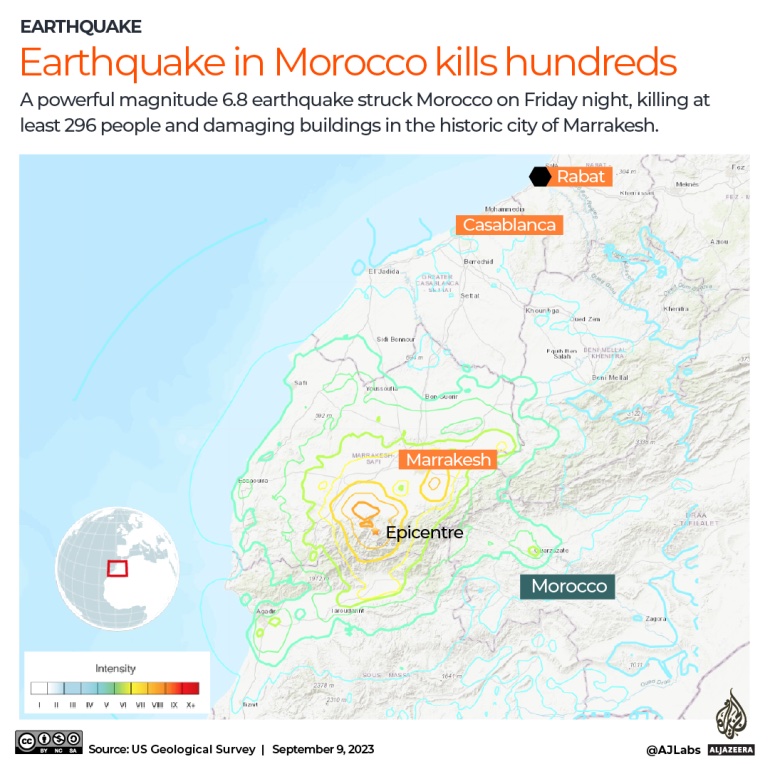
Check out the #Emergency Mapping repo (https://t.co/B6fLGEe2H2) for #buildingfootprints open data. As usual, if you are helping in volunteer activities and find this useful we encourage you to contact us about leveraging Mapflow AI to assist in your efforts in #Morocco mapping.
With #Mapflow#Custom you can start running combo pipelines featuring all ready-to-use Mapflow #AI models. It might be useful to run #mapping for topo plans creation and to optimize your time and costs for the data processing.
Currently, combo pipelines are available by request
We continue to research 🏡🌳 #urban green patterns around the World.
27 urban green patterns were generated using #Mapbox satellite and #Mapflow#AI-#Mapping.
The tree cover for Latin American cities from Mexico to Santiago reflects a unique mix of human-nature interaction.
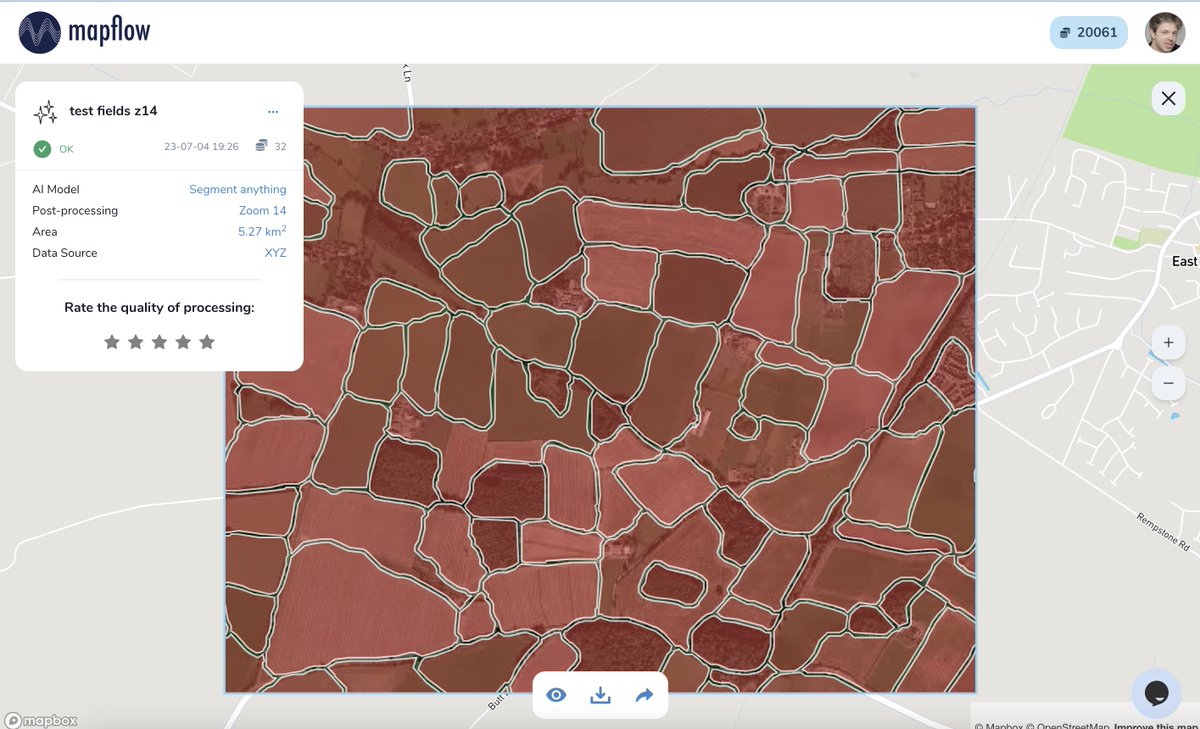
Here is the public beta release of the ✨ "#SegmentAnything Model" featured in Mapflow dashboard.
We adjusted it to the geospatial imagery workflows on a large scale with zoom options.
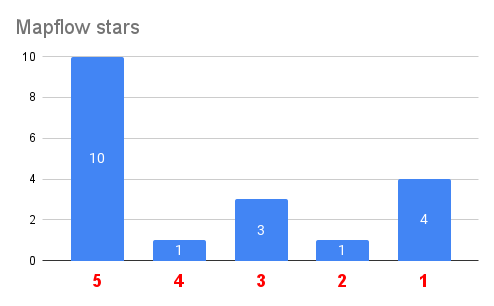
Share with us your samples and ratings. ⭐️
Read a full article here (https://t.co/6tg2zzWqrh)
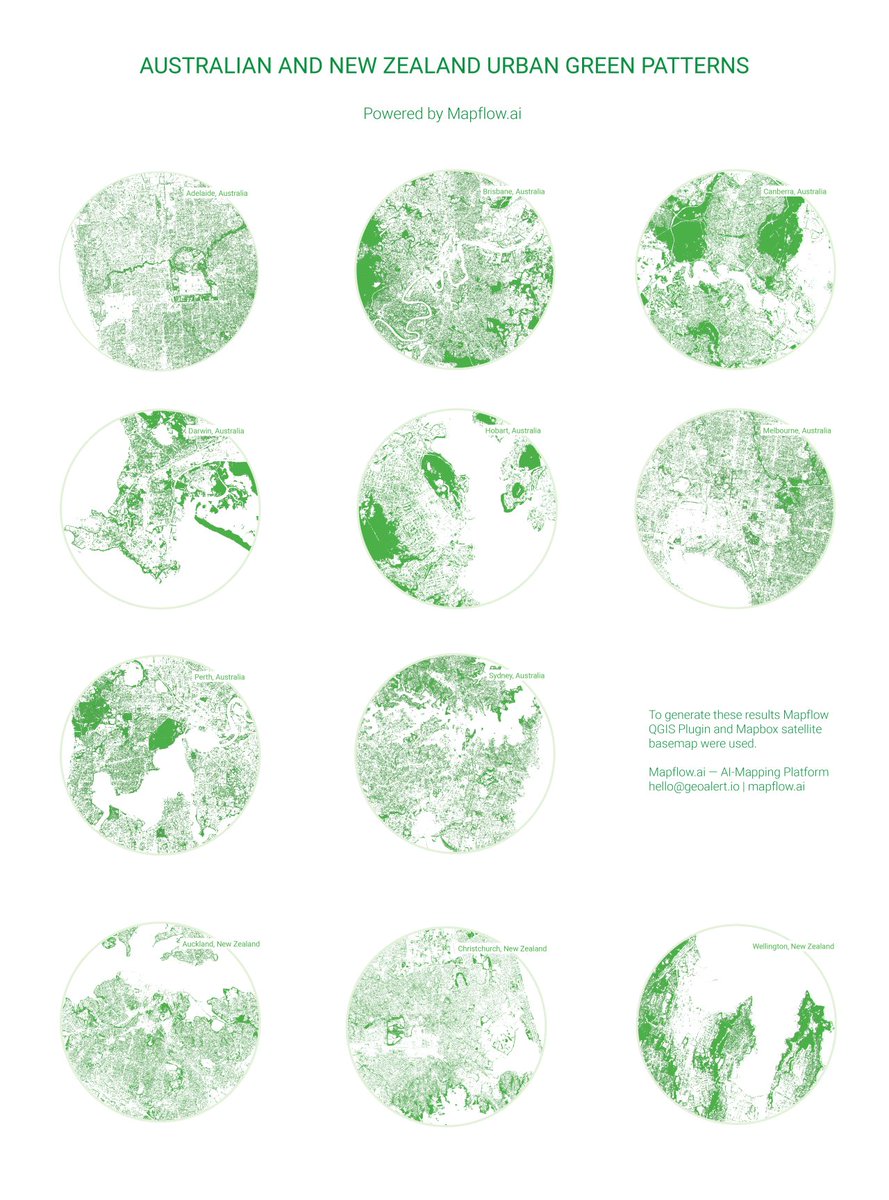
🌳 Australia and New Zealand urban green patterns powered by #Mapflow.
Which other cities you might be interested to analyze?
Check out open data updates on our github page (https://t.co/oqKbpMdfvg)
🌟 Plus, you can now use your credits to process commercial #satelliteimagery from $50! Discover more in our pricing documentation.
https://t.co/G6DF8nJszV
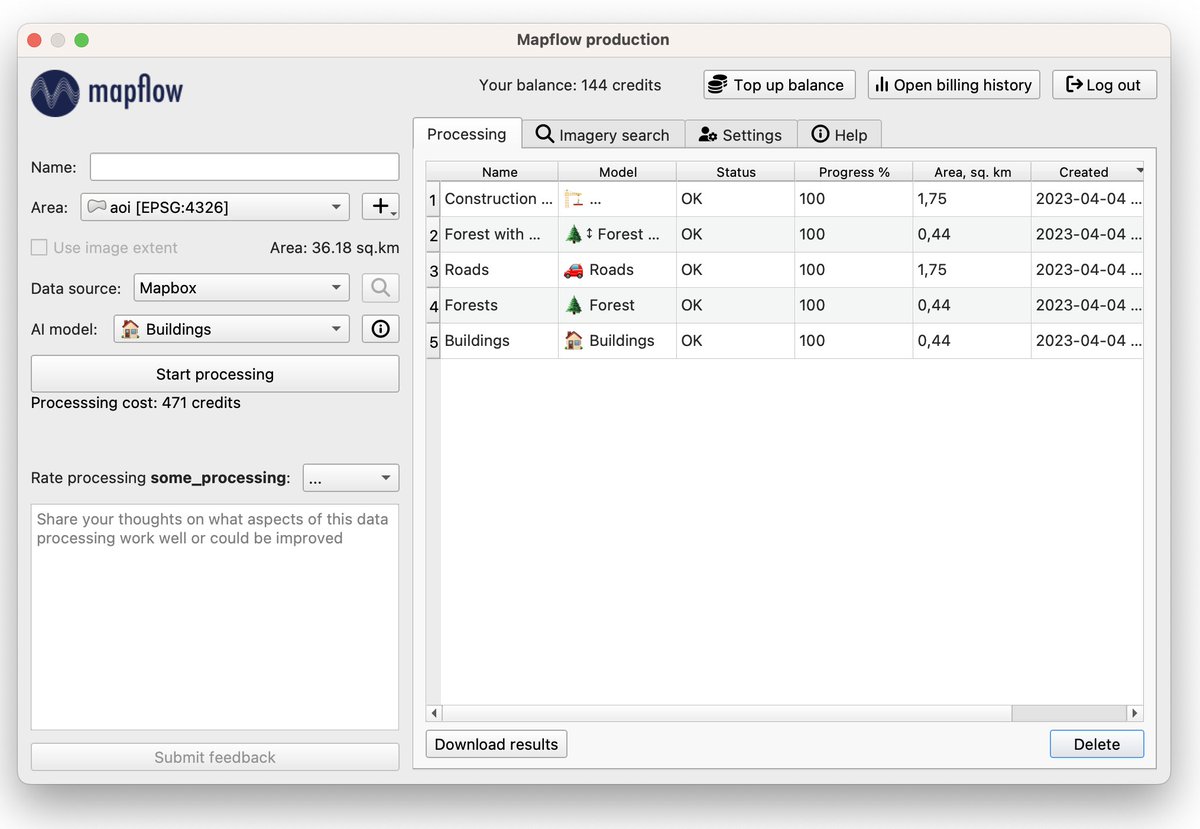
🚀 We're continuously working on integrating the web and GIS UX to enhance your #Mapflow journey.
📢 We are transitioning to credit-based billing for all our applications, providing a consistent and flexible UX for our users.
Your credits can now be used in both the Mapflow Web and QGIS/API, streamlining your payment process.
❗️Upgrade to Mapflow-QGIS 2+ for compatibility.
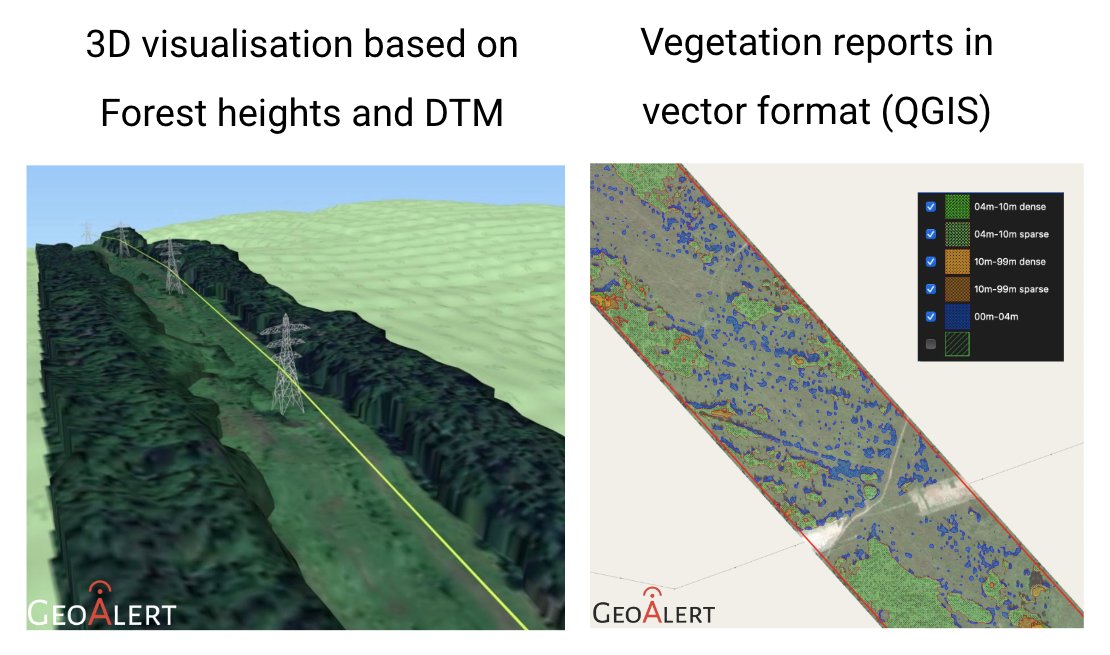
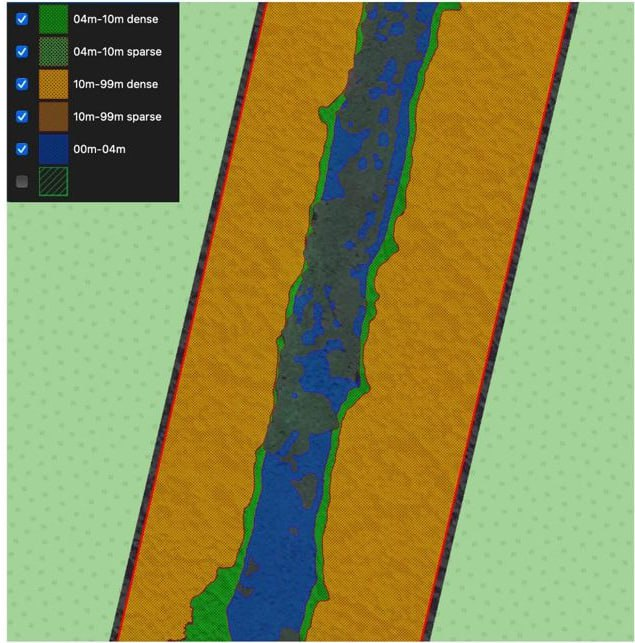
Check our page to showcase the solution for 🌿 #Vegetationmanagement 🌿 near #powerlines: #Mapflow AI for utility monitoring – https://t.co/dZB5HT838l
If you are related to utility assets control, etc. we would love to hear from you and to set up an evaluation account
Some teaser as we are looking forward to covering more specific cases. If you didn't find the solution for your case with the default #AI models in #Mapflow, it might be solved in the upcoming release. Contact us and we will include you in beta-testing with enough of free limit!
#Mapflow#QGIS#plugin version is just released. 🎉
Improved UI. Yet the major release 2.0.0 is related to the billing in credits which will be enabled in all Mapflow apps later this week. It brings a better experience to our customers who pay online. Kindly update if using QGIS.
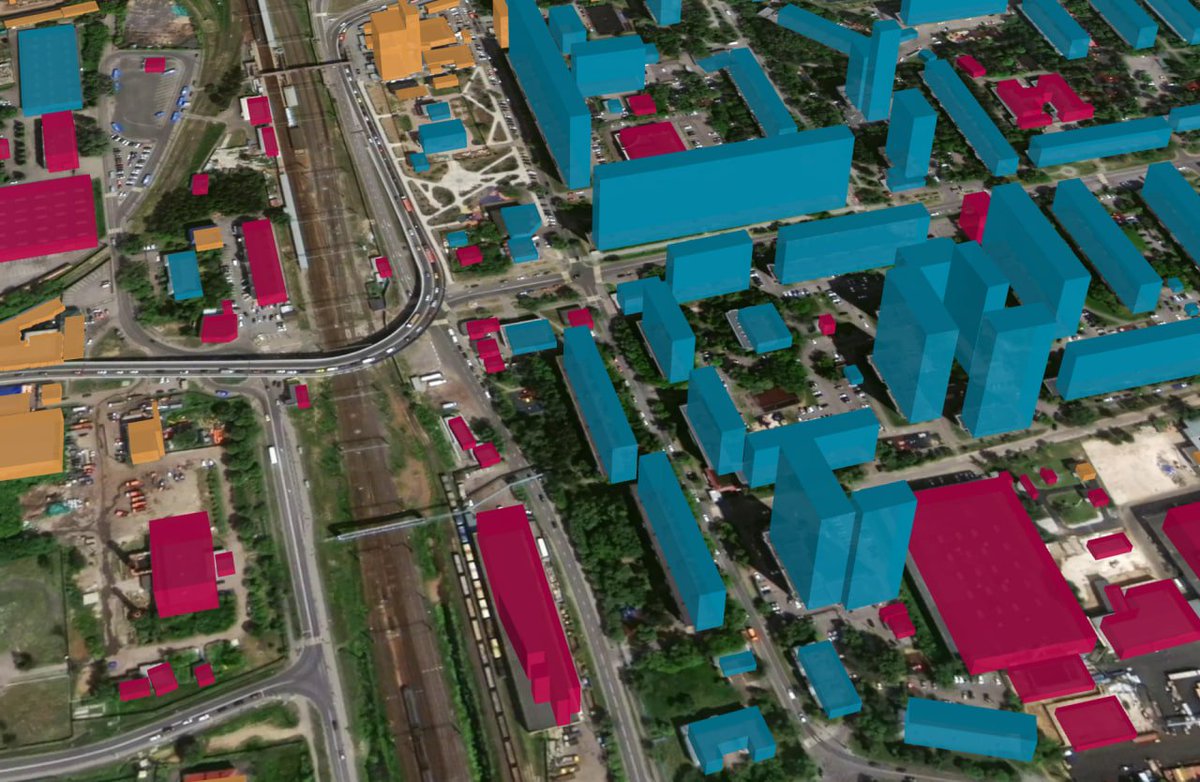
One of the basic methods for #Mapflow building heights estimation workflow. The model segments rooftops + shadows + walls. The next algorithm calculates the building 2.5D based on the known parameters of the satellite image. Simple yet effective when it comes to a large area
Last week we updated the #Mapflow forest heights model. Here is the showcase of using it for #Powerline monitoring and management.
The model can provide great visual results in #QGIS2threejs when accompanied by DTM and object presets.
Many thanks to all #Mapflow users who leave their feedback. Last week's results make 3.6 all models on average. We look forward to improving user ratings by improving Mapflow's models.
Past year we wrote a feedback review and organized our feedback in return for your assessments.