A 5 EMA crossing above the 20 EMA indicates a bullish trend, while a bearish crossover suggests weakness. Stochastic confirms momentum, helping identify overbought, oversold, and potential trend reversal points.
📌 Trading is about stacking evidence, not making predictions. 📊
- 3rd Trendline Touch
- 61.8% Fibonacci Retracement
- Morning Star Confirmation
One signal is interesting.
Three signals aligned are actionable.
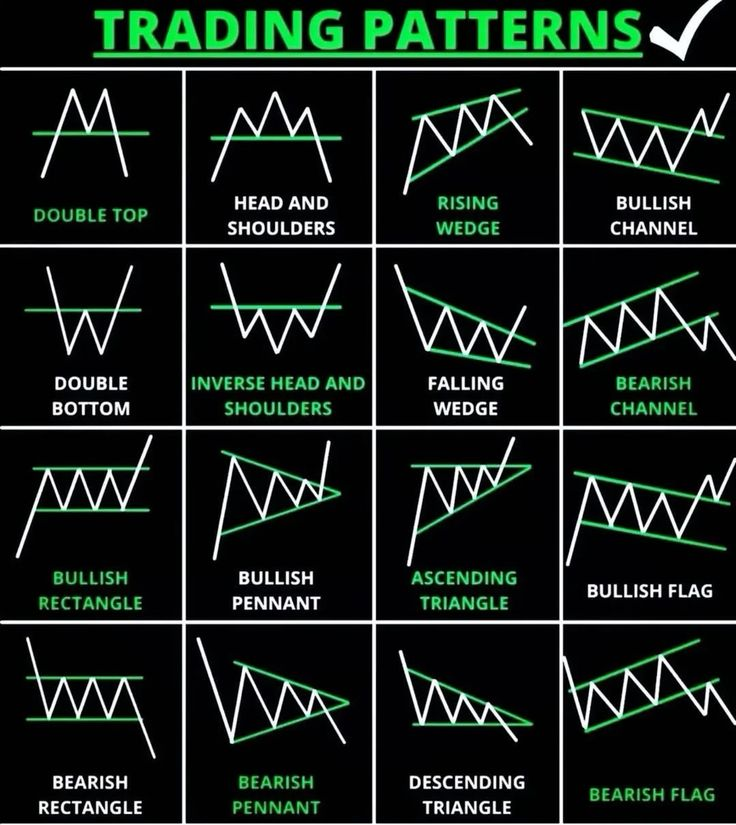
🚨THREE CHART PATTERNS
✔ Trap Wedge – Creates false breakout before reversal
✔ Short M – Double‑top structure signaling weakness
✔ W Pattern – Double‑bottom setup showing strength
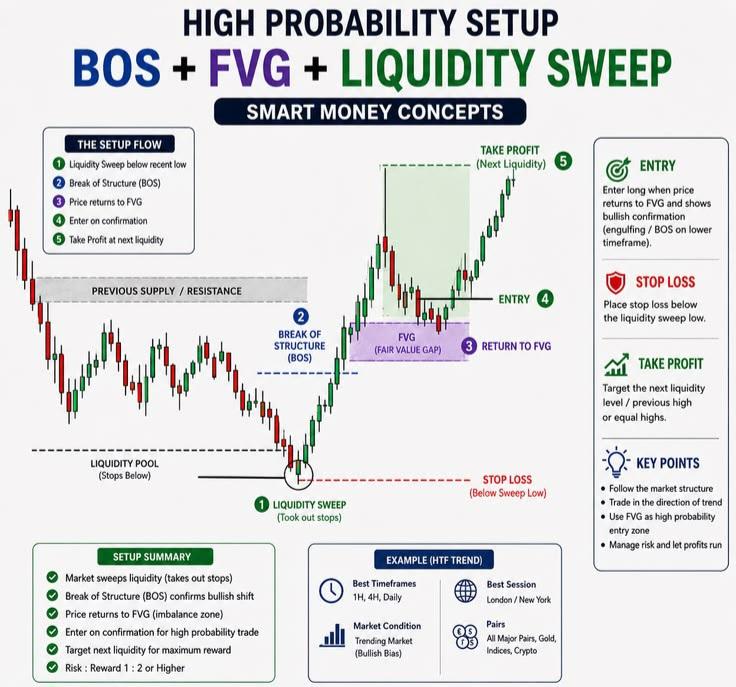
✔ BOS + OB – Break of structure with order block retest
✍️Use these formations to spot breakout and retest opportunities. Save & share for quick learning!
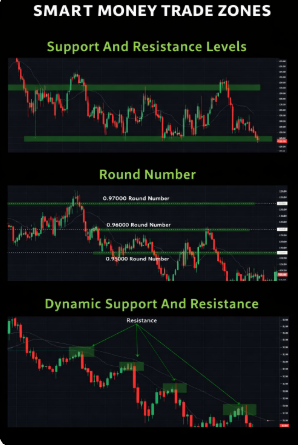
1️⃣ Liquidity is the fuel of the market.
Stop losses above highs and below lows create liquidity pools that attract institutional orders.
Learn to spot these areas before price reaches them.
🚨DOUBLE TOP: THE REVERSAL SIGNAL MOST TRADERS IGNORE
✔️ A Double Top forms when price fails to break above a key resistance level twice.
✔️ The second rejection signals weakening buyer momentum and growing seller pressure.
✔️ A break below the neckline confirms the bearish reversal setup.
✔️ Trendline support failure adds extra confirmation for downside continuation.
✔️ The best entries often come after the neckline is broken and retested.
✔️ Strong bearish candles after the breakdown increase the probability of a sustained sell-off.
✔️ Always wait for confirmation rather than selling at the first peak.
✍️ When buyers fail to create a new high, smart traders start looking for selling opportunities.