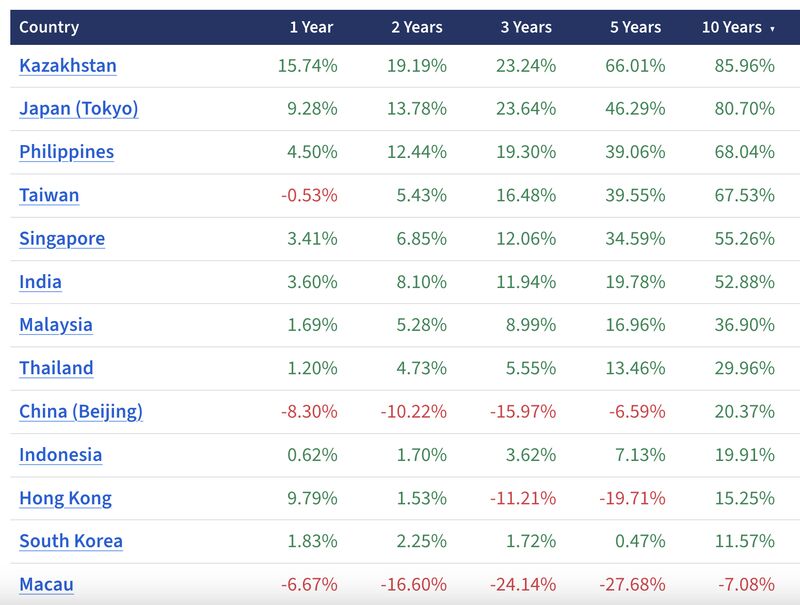
We just analyzed 5-year house price growth across Asia.
One market stood out immediately: 🇰🇿 Kazakhstan.
House prices have surged 66% over the past five years, making it one of Asia's fastest-growing housing markets in nominal terms.
Other strong performers include:
🇹🇼Taiwan: +40%
🇵🇭Philippines: +39%
But nominal numbers don't tell the full story.
For local buyers, what matters is inflation-adjusted (real) house price growth.
In Kazakhstan, despite nominal prices rising 66%, real house prices are actually down 5%, meaning inflation has outpaced housing appreciation.
For international investors, exchange rates matter more than domestic inflation.
Over the same period, the Kazakh tenge weakened by roughly 10.4% against the U.S. dollar and 7.3% against the Euro.
Because the local housing boom vastly outpaced currency devaluation, foreign capital captured high returns despite high local inflation:
USD-denominated capital gains: +50.3%
EUR-denominated capital gains: +54.7%
...and if those investors rented out their apartments, they would have captured another 7-8% in NET annual yields. Over 5 years, this brings the total return on investment to nearly 90%.
--
*Nominal prices tell you how much homes have appreciated.
*Inflation-adjusted prices show whether local purchasing power has increased.
*For international investors, currency movements and cash flow often matter just as much as house prices.
For years, €10,000 per square meter felt like a level reserved for only a handful of global trophy markets.
That's no longer the case.
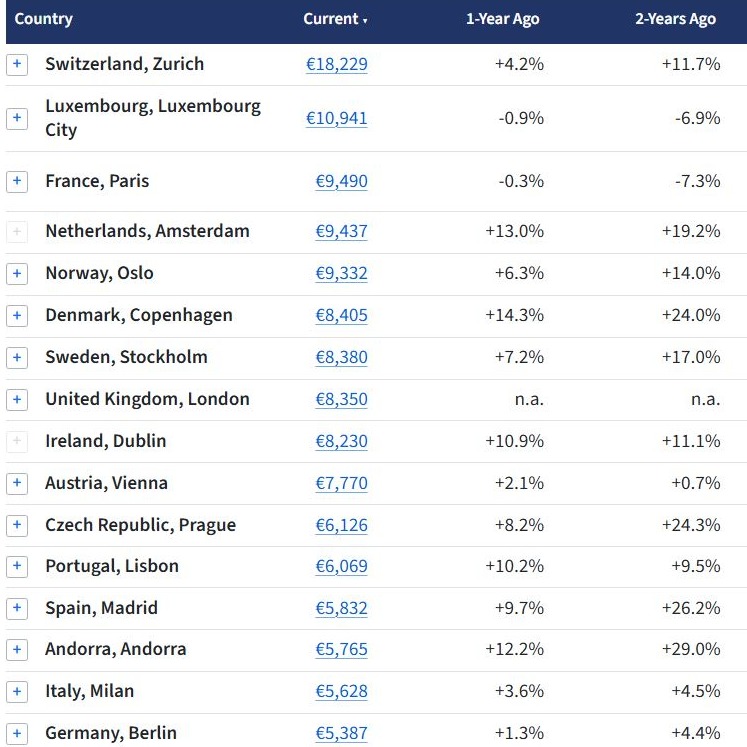
Across Europe, more and more cities are approaching that threshold:
����🇭 Zurich: €18,229/sqm
🇱🇺 Luxembourg City: €10,941/sqm
🇫🇷 Paris: €9,490/sqm
🇳🇱 Amsterdam: €9,437/sqm
🇳🇴 Oslo: €9,332/sqm
🇩🇪 Munich: €9,179/sqm
🇩🇰 Copenhagen: €8,405/sqm
🇸🇪 Stockholm: €8,380/sqm
🇮🇪 Dublin: €8,230/sqm
Just a step below are:
🇦🇹 Vienna: €7,770/sqm
🇨🇿 Prague: €6,126/sqm
🇵🇹 Lisbon: €6,069/sqm
🇪🇸 Madrid: €5,832/sqm
🇦🇩 Andorra: €5,765/sqm
🇮🇹 Milan: €5,628/sqm
🇩🇪 Berlin: €5,387/sqm
The interesting part isn't just today's prices—it's the pace of growth. Amsterdam, Copenhagen, Prague, Madrid, Stockholm, and Oslo have all posted strong gains over the past three years, pushing them steadily closer to the €10,000/sqm milestone.
Which city do you think will be the next to cross it?
@Schmit_Henri These are city averages, both new/old builds. SQM data from Milan comes from here: https://t.co/Irm7UFYk3Q
City center is indeed around €8,000/sqm.
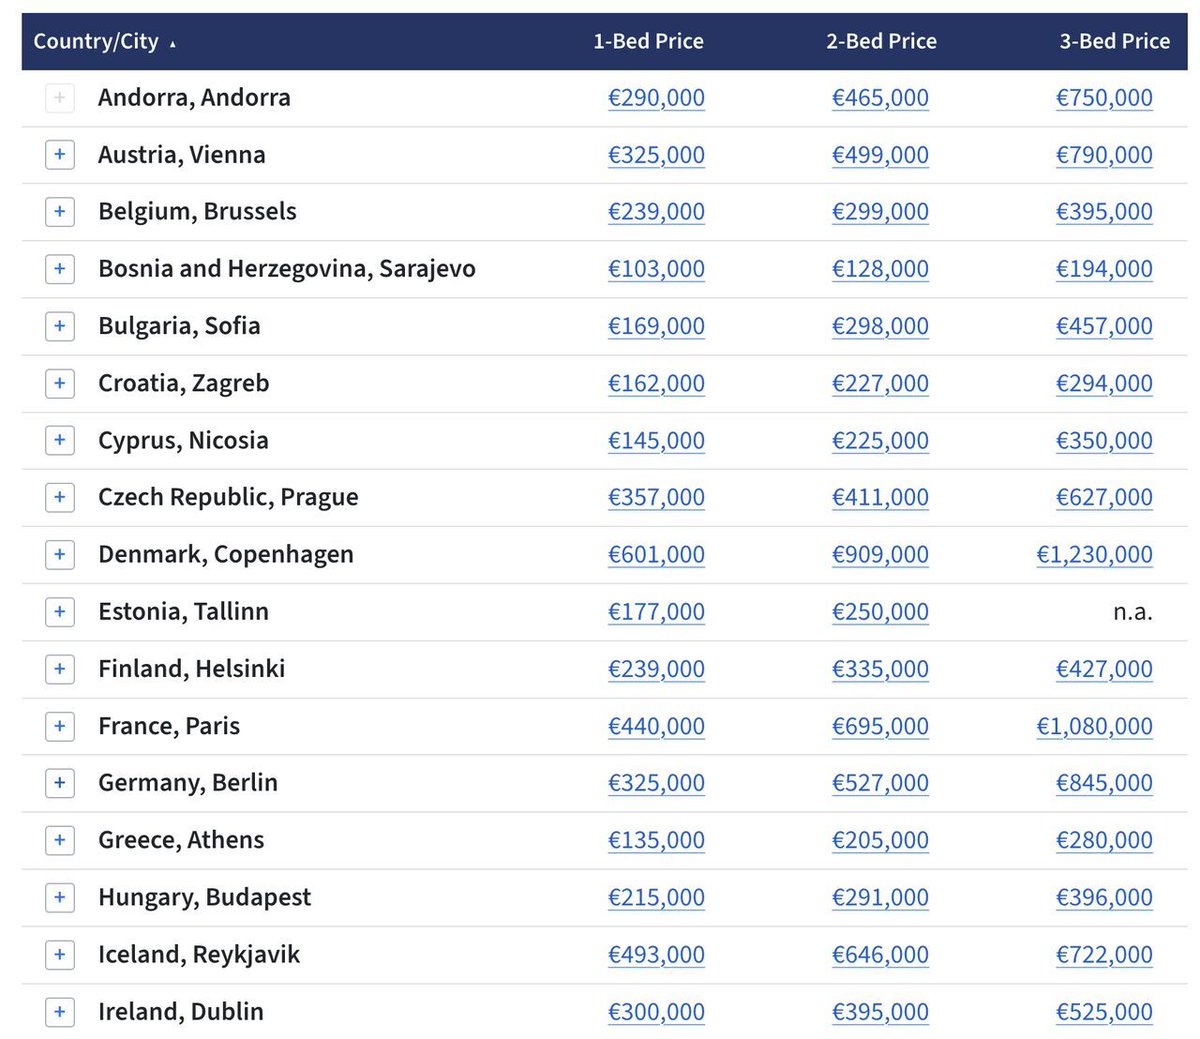
Median asking prices for a 1-bedroom apartment in Europe can vary a lot.
Our latest data shows Zurich now sits at a median of €1.15 million, Europe's most expensive market by some distance. At the other extreme, a 1-bedroom in Skopje goes for just €55,000. That's a 20x gap across the same continent.
At the top end:
🇨🇭 Zurich: €1,151,000
🇱🇺 Luxembourg City: €669,000
🇩🇰 Copenhagen: €601,000
🇩🇪 Munich: €548,000
🇬🇧 London: €522,000
🇫🇷 Paris: €440,000
At the lower end:
🇱🇻 Riga: €125,000
🇲🇪 Podgorica: €118,000
🇷🇴 Bucharest: €110,000
🇧🇦 Sarajevo: €103,000
🇲🇩 Chisinau: €79,000
🇲🇰 Skopje: €55,000
In between sits most of the continent: 🇵🇹 Lisbon (€440k) now level with 🇫🇷 Paris. 🇩🇪 Berlin and 🇦🇹 Vienna around €325k, and much of Central and Eastern Europe—from 🇵🇱 Warsaw to 🇬🇷 Athens—still under €180,000.
Which European capital do you think offers the best value today?
@imidaily@MacroJason I think if gross rental yield drops below 4% (at current prices) it makes sense to sell it and "invest" elsewhere unless the property has some sort of sentimental value.
We have just updated our latest gross residential rental yield data across 250+ cities in Europe.
Below are some of the cities with the highest rental yields according to our research:
🇮🇪 Cork: 8.8%
🇬🇧 Liverpool: 8.6%
🇮🇹 Palermo: 8.2%
🇲🇩 Chisinau: 8.2%
🇷🇴 Bucharest: 7.5%
🇱🇻 Riga: 7.4%
🇮🇹 Milan: 7.2%
🇮🇪 Dublin: 7.0%
🇳🇱 Rotterdam: 6.9%
🇵🇱 Warsaw: 6.8%
Lowest yields:
🇩🇪 Hamburg: 2.4%
🇨🇭 Zurich: 2.5%
🇨🇭 Geneva: 2.6%
🇩🇪 Munich: 2.6%
🇱🇺 Luxembourg City: 2.7%
����🇪 Brugge: 2.9%
🇩🇰 Copenhagen: 2.9%
🇦🇹 Salzburg: 2.9%
🇩🇪 Frankfurt: 3.3%
🇨🇿 Prague: 3.5%
Note: Net rental yields are typically 15%–35% lower than gross rental yields, depending on property taxes, HOA fees, maintenance costs, insurance, vacancy rates, and other ownership expenses. For example, a 6.0% gross yield reduced by 25% results in a 4.5% net yield.
Methodology: Gross rental yields are calculated by dividing the median asking rent by the median asking sale price, using the average of the median asking prices for 1-, 2-, and 3-bedroom apartments in each city.
We just updated our Global Rent Price Index.
In Europe, the strongest rent growth over the past 15 years has been recorded in:
Estonia +208%
Lithuania +192%
Iceland +136%
Hungary +131%
Ireland +123%
Serbia +111%
Montenegro +98%
Poland +92%
Austria +79%
Slovenia +72%
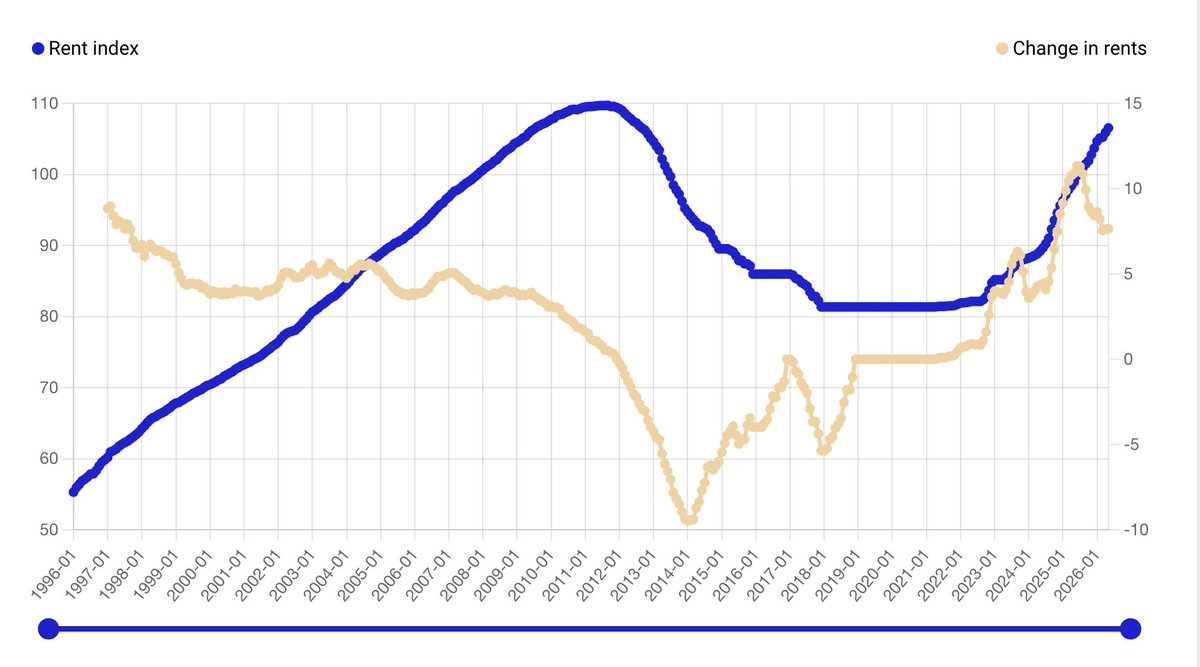
I think you may be overlooking what happened in Greece during and after the financial crisis. Rents in many parts of Greece were actually higher in 2007 than they are today.
The country experienced a severe economic crisis = high unemployment and falling incomes which caused significant correction in both property prices and rents.
We just updated our Global Rent Price Index.
In Europe, the strongest rent growth over the past 15 years has been recorded in:
🇪🇪 Estonia: +208%
🇱🇹 Lithuania: +192%
🇮🇸 Iceland: +136%
🇭🇺 Hungary: +131%
🇮🇪 Ireland: +123%
🇷🇸 Serbia: +111%
🇲🇪 Montenegro: +98%
🇵🇱 Poland: +92%
🇦🇹 Austria: +79%
🇸🇮 Slovenia: +72%
While the total rent increases since 2011 may look dramatic, annualized compound growth over the last 15 years was much lower:
Estonia: 7.8% per year
Lithuania: 7.4% per year
Iceland: 5.9% per year
Hungary: 5.7% per year
Ireland: 5.5% per year
Serbia: 5.0% per year
Montenegro: 4.7% per year
Poland: 4.4% per year
Austria: 4.0% per year
Slovenia: 3.5% per year
Meanwhile, a number of European markets have recorded remarkably weak rent growth over the same period:
🇩🇪 Germany: +26% (1.5% per year)
🇮🇹 Italy: +19% (1.2% per year)
🇨🇭 Switzerland: +18% (1.1% per year)
🇫🇷 France: +17% (1.0% per year)
🇪🇸 Spain: +15% (0.9% per year)
🇨🇾 Cyprus: +14% (0.9% per year)
🇬🇷 Greece: -6.2% (-0.4% per year)
The gap largely reflects differences in wage growth, economic convergence, housing supply, demographics, rent regulation, property taxes, and the stage of the housing cycle each market is currently in.
NOTE: The data is sourced from national statistics offices and other official organizations that publish local rent or housing price indices on a quarterly basis.