Comment "GQ" below and we will send you all the details about the tournament directly.
The Globalex Quant Trading Tournament is open for August. The top five finishers each receive a trading evaluation account. Places six through ten receive 10,000 Globalex Quant EXP points.
All information is in the Discord server linked in our bio.
🛡️ Education only. Trading involves risk of loss.
#globalexquant #tradingtournament #tradereducation #institutionaltrading #trading
A chart shows where price has been. The order book shows what is waiting for it next.
Here is what Level 2 data actually reveals.
THE LAYERS
Level 1 data shows executed market orders: the trades that have already happened. Level 2 is the DOM, the Depth of Market: resting passive limit orders waiting to be filled at every price level above and below current price. The distinction matters because Level 1 is history and Level 2 is intent, with the caveat that intent can be manufactured.
THE DOM
The bid stack sits below current price. The offer stack sits above it. Market makers post on both sides continuously. The first 3 to 4 ticks from current price is where their activity is most visible, and where the book shifts most rapidly in response to incoming order flow.
THE PATTERNS
Spoofing places large visible limit orders with no fill intention. The purpose is to create a false impression of support or resistance, draw retail and HFT participants to one side, and pull the order before any execution occurs. Iceberg orders work in reverse: 10 lots displayed, 200 lots resting behind it, refreshing automatically as each slice fills. Visible size understates actual size by design.
THE IMBALANCE
When bids dominate the book, passive buying exceeds passive selling at current price. Reading book imbalance alongside delta tells you which side is absorbing aggressive order flow at that moment. A delta reading showing aggressive selling into a bid-dominated book is a different signal from the same delta reading into a balanced or offer-dominated book. The context changes the interpretation entirely.
🛡️Educational content only. Not financial advice.
#globalexquant #orderflow #leveltwdata #institutionaltrading #tradereducation
Same chart.
Same levels.
Same loss.
The market is not random. The participants driving it have access to information that never appears on a price chart. Understanding what they read, how they position, and why price moves the way it does is not a trading tip. It is a different starting point entirely.
That is what Globalex Quant is built around.
Find out more. Link in bio.
🛡️ Education only. Trading involves risk of loss.
#globalexquant #institutionaltrading #tradereducation #intermarketanalysis #trading
You can have the right analysis.
The right level.
The right setup.
And still not execute correctly.
That gap is not a knowledge problem. It is a psychology problem. Premature exits, revenge trading, oversizing after a loss, holding too long through hope. None of these come from misreading the market. They come from what open risk does to decision-making in real time.
Mind Over Market is a 4-week program built specifically for that gap. Developed by Rudy, psychology and mindset specialist, it works through the patterns that produce execution errors before they happen, not after.
And every Friday, Rudy runs a free live psychology session on the Globalex Academy Discord, open to every member of the server.
Find out more. Link in bio.
🛡️Education only. Trading involves risk of loss.
#globalexquant #tradingpsychology #mindovermarket #tradereducation #trading
RSI reading 70 tells you price has already moved. It does not tell you where it is going next or how far the current move is statistically likely to extend.
Lagging indicators are calculated from past price data. By the time they signal, the analytical value of that signal has already partially expired. Standard deviation extensions work in the opposite direction.
THE INSTITUTIONAL APPROACH TO PRICE TARGETS
Standard deviation extensions are drawn from recent V-shaped or N-shaped market swings. The swing itself is the anchor. The 1.5, 2.0, and 3.0 SD levels project forward from that anchor as statistically derived zones rather than fixed price points chosen arbitrarily or based on round numbers.
THE 1.5 SD
The first institutional target zone. Price reaches this level on the majority of confirmed directional moves. It is not a reversal signal. It is the first point where the move has statistically delivered its initial expected range and where scaling out begins to make sense structurally.
THE 2.0 SD
The primary profit-taking zone. Institutional participants begin reducing exposure as price approaches this extension because the statistical probability of continuation beyond this point is lower than the probability of the move having been completed. Holding full size past 2.0 SD without additional macro confirmation is holding into diminishing statistical support.
THE 3.0 SD
The extreme extension zone. Price reaches this level only on high-momentum moves where the full macro framework across all three pillars is confirming the same directional bias. When it is reached, the move was exceptional by statistical definition. Most directional trades do not extend here, which is why using 3.0 SD as a default target produces low-probability expectations in normal market conditions.
THE ATR STACK
The 3.0 SD expected move is used to calculate the spacing between limit order layers. Each layer of a stacked position is placed at mathematically defined intervals across the projected range rather than at arbitrary increments. This connects the entry architecture directly to the statistical structure of the move itself.
🛡️Educational content only. Not financial advice.
#globalexquant #orderflow #institutionaltrading #marketstructure #tradereducation
Majority of traders just blend in.
Learn the same courses.
Make the same mistakes.
The difference is not talent. It is framework. Retail analysis treats price action as the primary signal. Trade The Edge starts three layers above that, with macro intermarket relationships, institutional order flow, and the execution logic that sits behind how serious market participants actually position.
Four weeks. Lifetime access. The complete system from market participants to psychology.
If you want to understand why markets move, not just where, the link is in the bio.
🛡️ Education only. Trading involves risk of loss.
#globalexquant #tradetheedge #institutionaltrading #tradereducation #trading
Education at Institutional Level.
One framework.
Three ways to apply it.
The curriculum covers what institutional participants actually read before opening a chart: market participants, intermarket analysis, order flow, and execution logic structured into a transferable system.
The tools bring that same framework to your charts and your execution. Proprietary MT4 algorithms and TradingView indicators built on the same analytical logic Eric teaches, not a separate system layered on top.
The community puts it in motion. 4,000 traders, weekly live sessions, real-time market analysis. The framework being applied, not just studied.
Everything is linked below.
🛡️Education only. Trading involves risk of loss.
#globalexquant #institutionaltrading #tradereducation #trading #globalexacademy
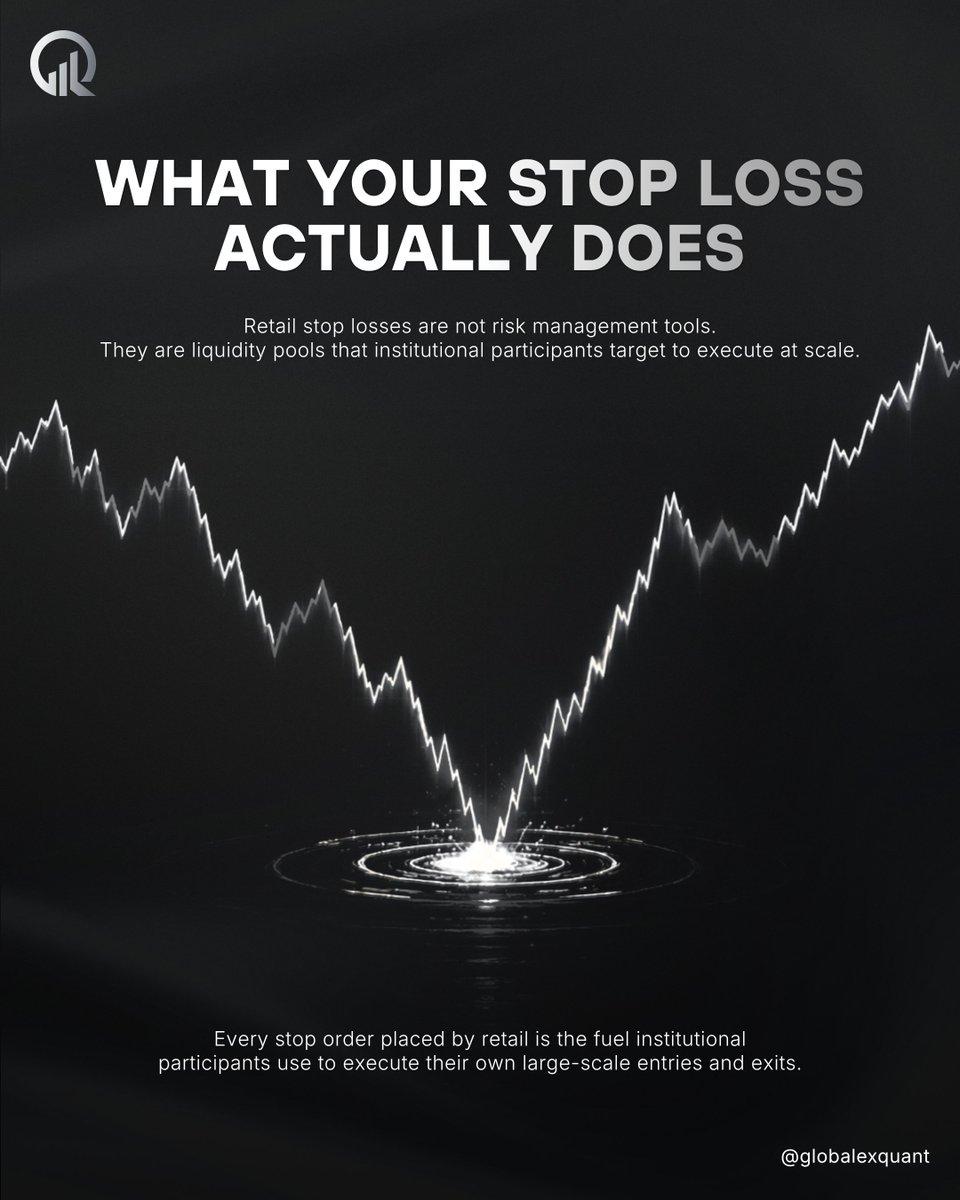
A stop loss placed just below a key level is not hidden. It is predictable.
And predictable order flow is what institutional participants need most.
The reason retail stop clusters are useful to institutional participants has nothing to do with targeting individual traders. It is a scale problem.
Executing a large block order in size requires a significant pool of counterparty liquidity at the same price level. Retail stop orders, concentrated at obvious structural points like session lows, day highs, or round numbers, provide that pool in a predictable location at a predictable moment.
The more universally recognised a level is as support or resistance, the more stop orders accumulate just beyond it, and the more attractive it becomes as a price discovery target. Price discovery in this context is not random volatility.
It is market makers testing whether genuine institutional limit orders are resting at that level by using the retail stop cluster as the fuel to reach it.
Understanding this does not mean removing stop losses. It means placing them at levels that are structurally justified rather than obvious, and sizing positions so that a sweep of a predictable level does not force an exit before the trade thesis has had time to develop.
🛡️Educational content only. Not financial advice.
#globalexquant #orderflow #marketstructure #institutionaltrading #tradereducation
A bullish delta reading and a bullish order book can both be present and still tell an incomplete story.
Ease of flow measures the efficiency of directional pressure, specifically how much participation is required to move price one tick in the prevailing direction. Early in a genuine move, participation is high and price moves efficiently. As the move matures, the same price advance requires progressively less buying participation because aggressive sellers have stepped back and the remaining buyers are meeting less resistance.
When ease of flow begins flattening while price continues higher, it means the move is becoming structurally easier to sustain but less structurally supported. Those are not the same thing.
The distinction between an efficiency warning and a reversal signal is what the post identifies but does not fully expand. An efficiency warning does not tell you the move is ending. It tells you the quality of the move is degrading before the candle pattern has reflected it.
That changes the appropriate response from holding full size and targeting the original level to reducing exposure, tightening the active target, or waiting for a volume confirmation before adding. The move can still continue. The risk profile of continuing to hold it has already changed.
This is why reading delta alone, without the efficiency context, produces entries and exits that are technically correct but structurally late.
🛡️ Educational content only. Not financial advice.
#globalexquant #orderflow #volumeanalysis #institutionaltrading #tradereducation
The July Activity Contest is live on the Globalex Quant Discord server.
The most active members this month get rewarded.
Full prize details and the live leaderboard are in the exp-contest-updates channel.
The server link is in our bio.
🛡️ Education only. Trading involves risk of loss.
#globalexquant #globalexacademy #discordserver #tradingcommunity #trading
Comment "GQ" below and we will send you all the details about the tournament directly.
The Globalex Quant Trading Tournament is open for July. The top five finishers each receive a trading evaluation account. Places six through ten receive 10,000 Globalex Quant EXP points.
All information is in the Discord server linked in our bio.
🛡️ Education only. Trading involves risk of loss.
#globalexquant #tradingtournament #tradereducation #institutionaltrading #trading
Calling a trading mistake an emotional failure implies the fix is more discipline.
Calling it a structural problem implies the fix is a different structure.
Those two framings lead to completely different solutions.
The reason this distinction matters is practical. Discipline is not a renewable resource you can simply decide to have more of under pressure.
It depletes, especially across a trading session where multiple decisions compound. A structural fix does not depend on willpower holding up in the moment.
It removes the condition that creates the pressure in the first place.
FOMO and hope are not separate problems requiring separate solutions. Both originate from the same condition: a position still carrying open risk.
Once that risk is eliminated, typically by moving the stop to break-even as soon as structure allows, the late entry no longer carries the same urgency and the retracement toward break-even no longer carries the same threat.
The two psychological traps do not need to be solved individually because they share a root cause.
This is also why experienced traders are not necessarily traders with stronger willpower.
They are traders who have removed more of the conditions that require willpower to begin with.
🛡️ Educational content only. Not financial advice.
#globalexquant #tradingpsychology #riskmanagement #institutionaltrading #tradereducation
Equity traders watch indices to read growth.
Fixed income desks read the yield curve before the equity market has processed it.
The front-end of the curve, the 2-year and 5-year, is primarily influenced by Federal Reserve policy expectations. It reflects what the market believes the Fed will do with short-term rates. The back-end, the 10-year and 30-year, is traded by banks for volatility and directional profit. It reflects what the market believes about long-term growth and inflation independently of what the Fed is signalling. That distinction is why the TUT spread tells a different story than the NOB spread, even though both use the same underlying instruments.
An inverted curve carries a specific implication that the post frames as growth contraction but does not fully unpack: short-term rates sitting above long-term rates means the market is pricing in future rate cuts, which in turn implies the current rate environment is expected to be unsustainable. That expectation precedes the actual economic deterioration it reflects. Which is why the curve leads equity market repricing rather than following it.
Reading the curve configuration before any directional session tells you which macro environment you are trading in, before price on any individual instrument has shown it.
🛡️ Educational content only. Not financial advice.
#globalexquant #bondmarket #macrotrading #intermarketanalysis #institutionaltrading
Two indicators. Built on the same framework Eric teaches in Trade The Edge.
The TTE Value Indicator monitors up to six correlated markets simultaneously and detects when your primary market moves out of alignment with them. It classifies signals based on correlation breakdown strength and tracks performance using ATR-based targets and stops. The statistical dashboard shows which setups have the highest historical follow-through, so signal quality is visible before any decision is made.
The TTE Liquidity Withdrawal Indicator tracks rejection pattern performance candle by candle in real time. The signal filtering is live, meaning it updates based on actual results on the instrument and timeframe you are trading, not on historical assumptions that may no longer apply.
Both are available on TradingView. Starting from GBP 9.99 per month. Seven-day money-back guarantee. Link in bio.
🛡️ Education only. Trading involves risk of loss.
#globalexquant #tradetheedge #TradingView #institutionaltrading #tradereducation
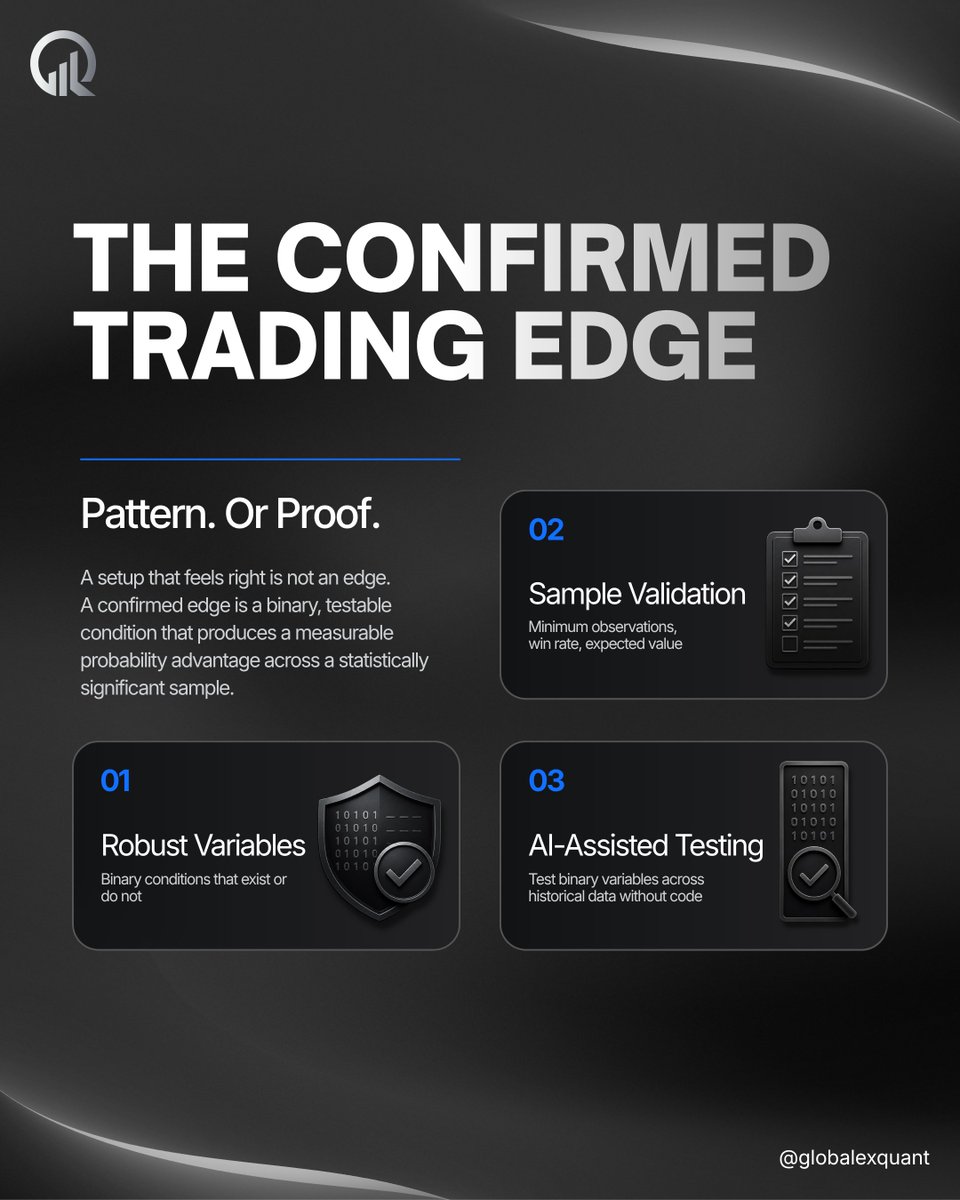
A setup feeling right and a setup being confirmed are two different standards. Most traders never test which one they are actually operating on.
Here is the full framework for confirming whether a setup has a real statistical edge.
ROBUST VARIABLES
A robust variable is a binary condition. Either it exists at the time of entry or it does not. Is price at yesterday's session low? Yes or no. Is the volume profile showing a High Volume Node at this level? Yes or no. Binary variables retain statistical validity in live markets because they cannot be adjusted after the fact. The more conditions required to confirm a setup, the fewer qualifying samples exist and the weaker the statistical foundation becomes.
CURVE FITTING
Curve fitting occurs when a strategy is built around too many confirming conditions. Each added condition narrows the qualifying sample until the data set is no longer statistically meaningful. A model that works perfectly on historical data but fails in live markets has been fitted to the past, not tested against the future. The cost of overfitting is invisible until the strategy is already live and capital is already at risk.
THE TESTING PROCESS
Define the entry condition as a binary question. Is price at the Asia session low? Yes or no. Count every instance where that condition was met across a minimum of 200 historical observations. Record each outcome as a win or a loss. Calculate the win rate across the full sample. Multiply the win rate by the average winner and subtract the loss rate by the average loser. A positive result confirms a measurable edge.
HOW THE FRAMEWORK APPLIES
Once a binary variable is confirmed to have a positive expected value across a sufficient sample, position sizing can be calibrated to the statistical confidence level. A higher win rate on a well-sampled variable justifies a larger weighted position. AI tools can be used to run this counting process across historical data without writing code. The output is the same: a win rate, an average outcome, and a calculated expected value that either confirms or invalidates the variable.
Have you tested your setup? Drop it in the comments.
🛡️ Educational content only. Not financial advice.
#globalexquant #quantitativetrading #tradereducation #institutionaltrading #riskmanagement
Gold and the NASDAQ share a currency. They do not share a cause.
Both are priced in dollars. Both respond to dollar strength. Treating them as the same kind of trade because of that shared pricing currency is a precision error that compounds across every multi-asset analysis built on it.
TANGIBLE ASSETS
Gold belongs to the tangible asset class along with the broader metals and commodities complex. Its value is anchored in physical scarcity and real-world demand that exists independently of any single market's sentiment. The primary driver is inflation expectations and real yield calculations. When inflation rises and real yields compress, holding a non-yielding physical asset becomes comparatively more attractive, which is the actual mechanism behind Gold's price movement. The asset is dollar-priced, but its fundamental driver is the relationship between inflation and yield, not the dollar in isolation.
INTANGIBLE ASSETS
The NASDAQ belongs to the intangible asset class along with broader equity indices. It has no physical form. Its value is a claim on future corporate earnings, discounted by current risk appetite and prevailing interest rates. When earnings expectations strengthen or the discount rate applied to those future earnings eases, the index moves. This driver is structurally distinct from inflation. A rate hike can hurt equities by raising the discount rate on future earnings at the exact same moment that inflation data is doing something completely different.
WHY DOLLAR STRENGTH AFFECTS EACH CLASS DIFFERENTLY
When the dollar strengthens, the transmission mechanism into each asset class runs through a different channel. For Gold, dollar strength often coincides with tightening monetary policy, which raises real yields and makes the opportunity cost of holding a non-yielding asset higher. For the NASDAQ, the same tightening cycle raises the discount rate applied to future corporate earnings, compressing valuations through an entirely separate mechanism. Both assets can fall during the same dollar-strength period, but the price action gives no indication that the underlying cause was identical.
THE ANALYTICAL ERROR
Building a correlation model that uses dollar strength as the single explanatory variable for both Gold and the NASDAQ assumes a shared causal pathway that does not exist. The practical consequence is misreading divergence: when Gold and the NASDAQ move independently of each other despite both being dollar-priced, that is not a breakdown in correlation. It is confirmation that the two assets were never driven by the same mechanism to begin with.
🛡️ Educational content only. Not financial advice.
#globalexquant #intermarketanalysis #gold #NASDAQ #institutionaltrading
Identifying which market is mispriced is only the first half of the problem.
The second half is knowing when the spread has reached maximum divergence before convergence begins. Most traders only solve the first half.
Here is the full sequence.
SPREAD WIDENS. EDGE APPEARS.
When correlated markets diverge, the spread between them widens as the gap grows. Commercial banks track this divergence in real time using the skew line. When the skew line signals maximum extension, the spread is at saturation. That is the exact zone where convergence becomes the higher-probability outcome.
THE SKEW LINE SIGNAL
The skew line measures volatility-adjusted relative positioning between two correlated instruments. When the spread reaches its widest point, the skew line peaks and begins to turn. That turn is the saturation signal. The key detail is that price on the primary instrument may still be rising at this point. The skew line diverging downward while price moves up is what produces the Diamond Formation.
THE DIAMOND FORMATION
The Diamond Formation occurs when both the spread line and the skew line begin falling simultaneously while the primary instrument price is still moving higher. This divergence between price and positioning reflects commercial banks quietly reducing exposure before the retail momentum move exhausts itself. It does not predict direction. It identifies the point where the spread has reached saturation and convergence is the structurally expected next move.
WIDER BUBBLE. LARGER MOVE. LONGER HOLD.
Bubble size refers to the magnitude of spread divergence at saturation. A wider bubble at the point of the Diamond Formation signals a larger macro repositioning event. Wider divergence does not produce a scalp opportunity. It signals a higher timeframe swing trade with a correspondingly longer hold period.
What does your spread tell you right now? Drop it in the comments.
🛡️ Educational content only. Not financial advice.
#globalexquant #spreadtrading #intermarketanalysis #institutionaltrading #tradereducation
When there is no defined target, position sizing has no anchor.
The size of a trade becomes a function of how confident the trader feels at that moment, which is one of the least reliable inputs available. Good analysis does not fix this. A trader can be analytically correct and still overtrade, oversize, or hold past a rational exit because there is no pre-defined point at which the session is done.
The monthly target model changes the relationship between performance and decision-making. When the target is reached, the psychological pressure to continue trading dissolves because the criteria for a successful month are already met. That removal of pressure is not just a comfort. It eliminates one of the structural conditions that produces the worst trading decisions, which is the compulsion to keep going when stopping is the correct action.
The compounding dimension matters for a different reason. A defined percentage target applied consistently produces a curve that is measurable and comparable month to month. Chasing undefined upside produces no comparable baseline at all, which makes it impossible to evaluate whether performance is actually improving or just variable.
🛡️ Educational content only. Not financial advice.
#globalexquant #tradingpsychology #riskmanagement #institutionaltrading #tradereducation
The level being valid is not enough.
The timing of the entry relative to that level is what determines whether the trade has a structural basis or not.
Entering at the first touch feels logical because the level is right there. The problem is that the first touch is not a confirmation. It is a question the market is asking. Is there genuine institutional interest here? The answer only comes from what happens at that level, from the volume data, from the price reaction, from whether absorption is visible or not. None of that information exists yet at the moment of first contact.
The practical cost of entering at the first touch is not just a lower win rate. It is a systematically worse entry position relative to where confirmation would have been, which means wider stops, smaller position size relative to the available move, and a thesis that has not yet been validated by the market itself.
Waiting for the second touch does not mean missing the trade. It means entering after the market has already answered the question the first touch asked.
🛡️ Educational content only. Not financial advice.
#globalexquant #tradeexecution #marketstructure #institutionaltrading #tradereducation