Comment "GQ" below and we will send you all the details about the tournament directly.
The Globalex Quant Trading Tournament is open for June. The top five finishers each receive a trading evaluation account. Places six through ten receive 10,000 Globalex Quant EXP points.
All information is in the Discord server linked in our bio.
🛡️Education only. Trading involves risk of loss.
#globalexquant #tradingtournament #tradereducation #institutionaltrading #trading
The June Activity Contest is live on the Globalex Quant Discord server.
The most active members this month get rewarded.
Full prize details and the live leaderboard are in the exp-contest-updates channel.
The server link is in our bio.
🛡️Education only. Trading involves risk of loss.
#globalexquant #globalexacademy #discordserver #tradingcommunity #trading
Trade The Edge is not built from theory.
Twice a week Eric goes live, not to present pre-prepared content, but to work through the actual market as it is developing.
That is a different thing from a recorded course. The analysis is live, the questions get answered in real time, and the framework gets tested against real conditions every single session.
Over four thousand traders are already inside. The link to join is in the bio.
🛡️ Education only. Trading involves risk of loss.
#globalexquant #globalexacademy #discordserver #institutionaltrading #tradereducation
Reactive trading is expensive. Not just analytically. Psychologically.
When price arrives at a level without a pre-built expectation, the decision has to be made under the exact conditions that produce the worst decisions. The market is moving. The opportunity feels immediate. The pressure to act or miss is real. That combination is where most execution errors originate, not from a lack of knowledge, but from the absence of a framework that was built before any of that pressure existed.
The T-minus approach removes the decision from the moment of price arrival entirely. By the time the level is reached, the analysis is already done, the thesis is already tested, and the only question is whether the conditions that were pre-defined are present or not. That is a structurally different cognitive task from interpreting a moving market in real time.
The practical difference between T-1 and T-2 is not just an extra level mapped. It is an extra layer of the market's structure understood before it becomes relevant. A trader operating at T-2 has already accounted for what happens if the first level does not hold, which means the second scenario does not require a new decision under pressure either.
🛡️ Educational content only. Not financial advice.
#globalexquant #tradingpsychology #institutionaltrading #marketstructure #tradereducation
Directional trading requires being right about where a market is going. Spread trading does not.
Here is how commercial spread trading works from structure to execution.
TRADING WITHOUT PICKING A SIDE
The edge in a commercial spread trade is in convergence, not direction. Two correlated markets diverge. The leading market has extended. The lagging market has not yet repriced. The trade is simultaneously long the lagging market and short the leading one. The profit comes when the spread between them closes, regardless of which direction both markets ultimately move.
LONG THE LAGGING. SHORT THE LEADING.
The opportunity is defined by the gap between two correlated markets, not by a directional view on either. Identifying which market is leading and which is lagging at any given moment is the analytical work. The entry follows from that read, not from a prediction about price direction.
SINGLE LEG VS. DUAL LEG
A one-leg trade enters only one side of the spread. It carries full directional exposure, a single confirmation source, and lower statistical confidence. A two-leg trade enters both sides simultaneously. The structure becomes market-neutral, analytical noise is reduced, and the confirmation requires both correlated markets to align rather than one. That dual confirmation is where statistical confidence is highest.
WHEN BOTH LEGS WORK TOGETHER
When the spread converges, both legs reflect it at the same time. The short leg on the leading market generates profit as it pulls back. The long leg on the lagging market generates profit as it catches up. The combined P&L is the dual convergence outcome, and it is the structural logic of why the two-leg approach carries a different risk profile than any directional trade.
SPREAD SIGNALS AND DIRECTIONAL ENTRY
For traders who cannot execute both legs simultaneously, spread signals still provide directional context before price confirms it on the chart. The process is: identify extreme divergence between correlated markets, wait for mean reversion or structural convergence to begin, then enter directional exposure on the lagging market with spread confirmation behind it.
The full framework is covered inside Trade The Edge. Four weeks. Lifetime access. Link in bio.
🛡️Educational content only. Not financial advice.
#globalexquant #spreadtrading #institutionaltrading #intermarketanalysis #tradereducation
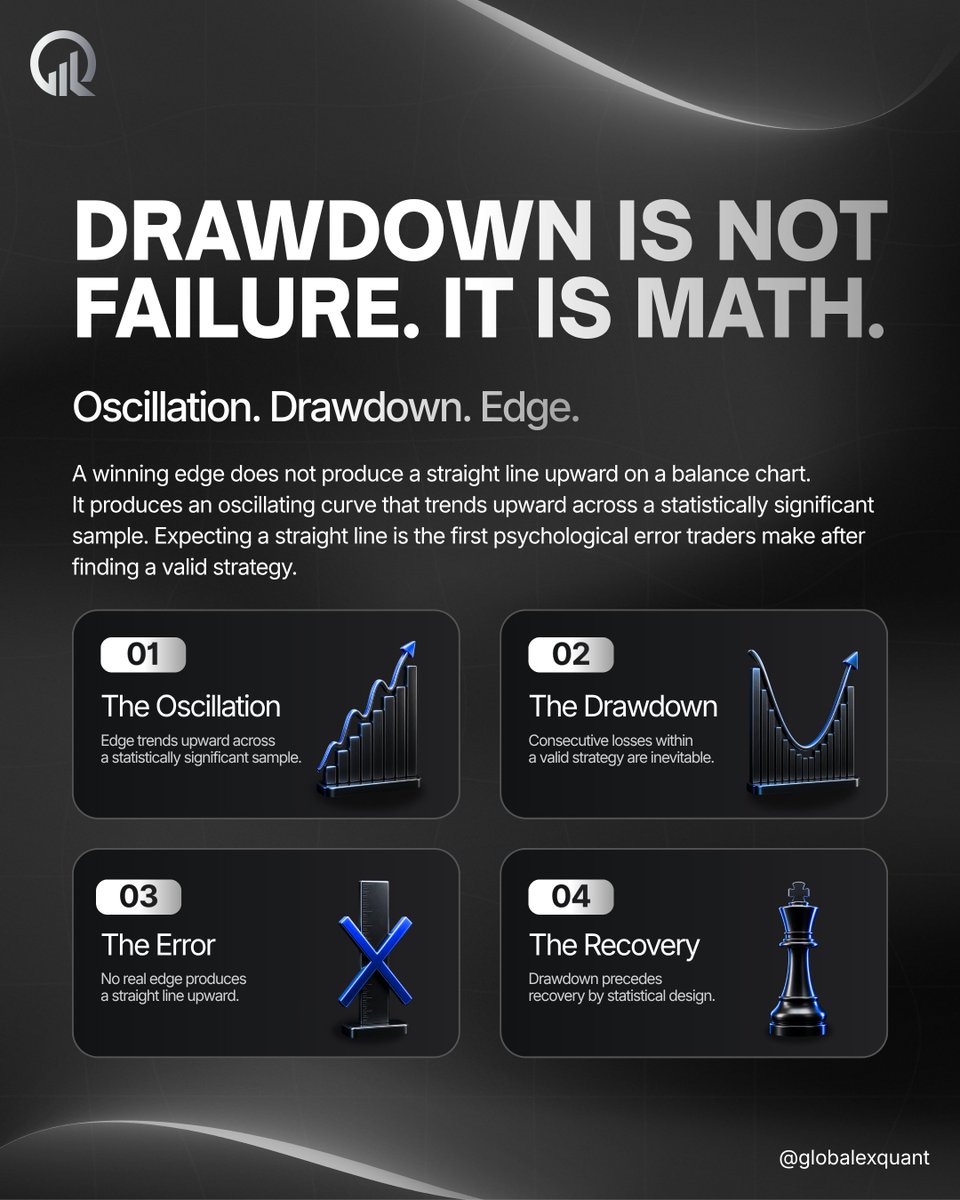
The moment a drawdown starts, most traders begin questioning the strategy.
That response is the actual problem.
A drawdown within a valid edge is not a signal that something has broken. It is the statistical gap between where the last winner closed and where the next one has not yet arrived. The edge has not changed. The sample is just not finished yet. Abandoning a valid strategy during a normal drawdown phase because the balance chart does not look like a straight line is one of the most common and most avoidable ways a real edge gets discarded before it has the chance to express itself.
The psychological difficulty is that drawdown feels indistinguishable from failure while it is happening. There is no moment mid-drawdown where the market signals that this is the normal oscillation rather than the beginning of a genuine breakdown. That uncertainty is what the framework needs to carry, not just the analysis.
Recovery is not a separate event that follows drawdown. It is built into the same statistical structure that made the drawdown inevitable in the first place.
🛡️Educational content only. Not financial advice.
#globalexquant #tradingpsychology #drawdown #institutionaltrading #tradereducation
A lot of traders watch oil and bonds as separate markets.
Institutional desks watch them as one relationship.
The front-end and back-end distinction is worth understanding in more detail. Front-end bonds are stabilization instruments. The Federal Reserve uses them to manage rate expectations. Back-end bonds are where banks actually trade for volatility and profit.
The seesaw that macro traders monitor runs on the back-end, specifically the 30-Year, not across the entire yield curve equally. That distinction changes which bond market you pay attention to when oil makes a significant directional move.
The parallel shift is the condition that most intermarket frameworks do not account for. When it appears, continuing to apply the standard oil-bond directional logic means building a trade on a relationship that is temporarily not functioning.
Recognizing it is not just analytically useful. It is what prevents a well-constructed thesis from being applied at exactly the wrong moment.
🛡️Educational content only. Not financial advice.
#globalexquant #macrotrading #intermarketanalysis #institutionaltrading #tradereducation
Most trading education is something you consume alone and apply later. This is different.
Three times a week, the framework gets worked through live. Eric on Mondays and Wednesdays, covering analytical concepts with members asking questions in real time.
Rudy every Friday, running a live psychology session where traders bring their actual challenges and work through them openly with the community.
Analysis and psychology, covered every single week, free, for every member.
Four thousand traders are already there.
Find the link in our bio.
🛡️ Education only. Trading involves risk of loss.
#globalexquant #globalexacademy #discordserver #tradingcommunity
The same intermarket and order flow logic that Trade The Edge teaches.
Translated into a proprietary MT4 algorithm suite. EUR/USD, GBP/USD, EUR/GBP, USD/CAD. Adjustable risk. Running continuously, without you needing to be there.
What makes it different is what is running under the hood. Live performance data is independently tracked and publicly verified through Myfxbook so you can review exactly how it has performed before making any decision.
🛡️Education only. Trading involves risk of loss.
#globalexquant #edgealgo #algorithmictrading
Globalex Quant Academy is not three separate courses. It is one framework.
Trade The Edge is the analytical foundation. Intermarket analysis, order flow, volume, market structure, and how institutional participants actually read the market. The kind of knowledge that takes years to piece together on your own.
Mind Over Market exists because knowing what to do and actually doing it under real conditions are two completely different things. Through drawdowns, through pressure, through the moments where discipline matters most. That gap is exactly what it is built to close.
And for traders who want direct guidance, Private Mentorship goes one level further. Eight sessions, one-on-one, built around exactly where you want to go.
Find details in our bio.
🛡️ Education only. Trading involves risk of loss.
#globalexquant #tradetheedge #mindovermarket #institutionaltrading #tradereducation
The oil-bond negative correlation is one of the most reliable macro relationships in institutional analysis. Until it is not.
Here is what happens when the correlation breaks, and what the correct response looks like.
OIL UP. BONDS DOWN.
The standard negative correlation runs on yield mathematics. Rising oil signals rising inflation expectations. A fixed bond yield becomes less attractive in real terms when inflation moves against it. Institutional participants sell the back end of the bond market before the move becomes visible on an equity chart. This is the baseline relationship that macro frameworks are built around.
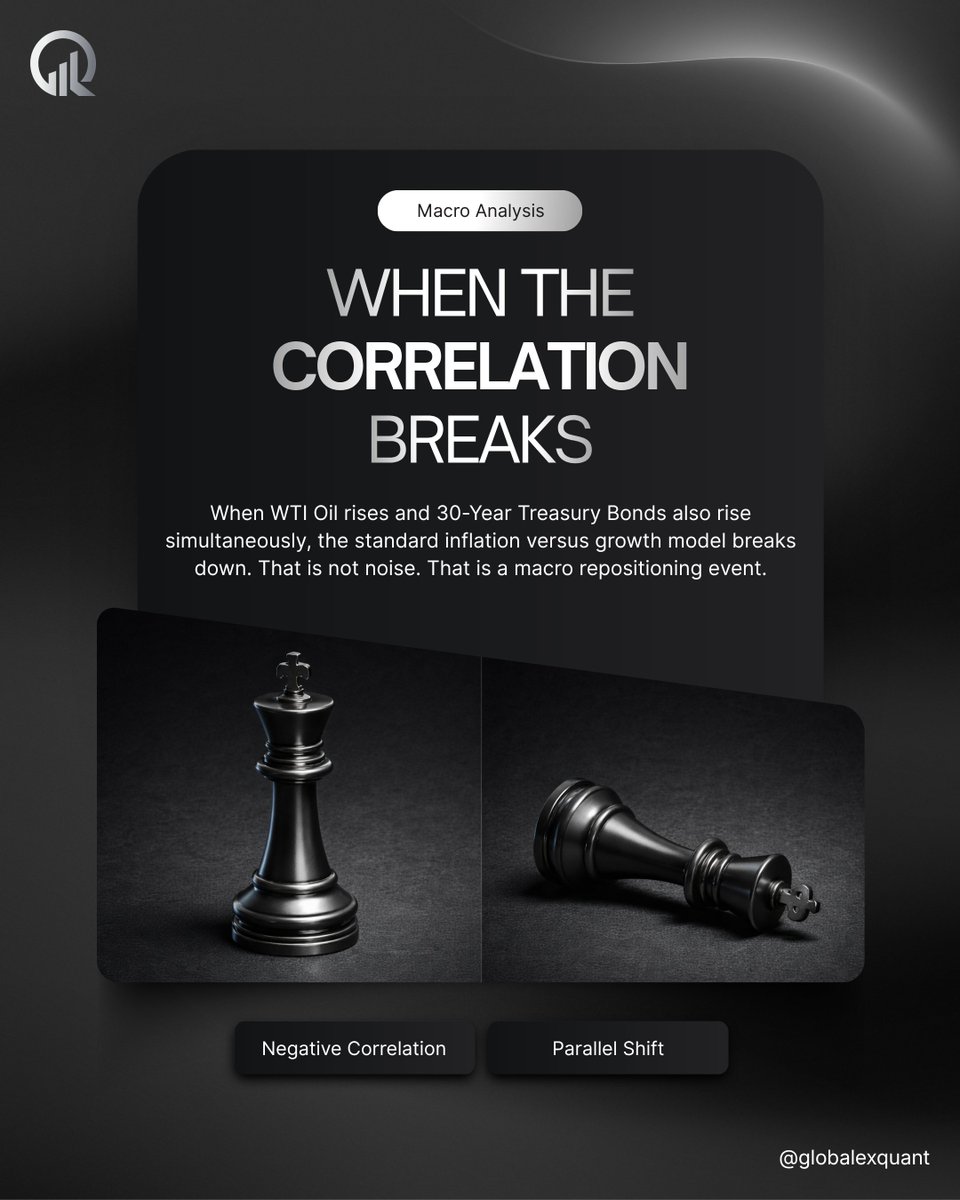
THE PARALLEL SHIFT.
When WTI and 30-Year Treasury Bonds both rise simultaneously, that baseline breaks. Both sides of the negative correlation are moving in the same direction, which means the inflation versus growth model is no longer the dominant force in the market at that moment. Something larger is overriding it.
MACRO REPOSITIONING.
A parallel shift signals institutional repositioning across multiple asset classes at the same time. The inflation versus growth model has not permanently broken. It has been temporarily overridden by a force large enough to move both correlated markets in the same direction. The key distinction is that this is not noise or random divergence. It is a structural event with implications beyond the two markets directly involved.
PAUSE. REASSESS. THEN ACT.
Continuing to apply the standard oil-bond directional framework during a parallel shift means executing against a temporarily broken model. The correct institutional response is not to find an alternative trade within the same framework. It is to step back entirely, reassess the macro narrative from the top, and wait until the standard relationship reasserts itself before any new position is executed.
Which market do you read first? Drop it in the comments.
:shield: Educational content only. Not financial advice.
#globalexquant #macrotrading #intermarketanalysis #institutionaltrading #tradereducation
A strong dollar signal does not mean the same thing across all forex pairs.
It means opposite things depending on which group the pair belongs to.
Most retail analysis treats all major pairs as a single block when a dollar signal appears. The frontend and backend classification changes that entirely.
When DXY makes a significant directional move, both groups are affected simultaneously but in opposite directions. Reading them together reveals which side of the market carries more institutional momentum at that moment, and which pairs within each group are showing the largest relative displacement from fair value.
Dividing any major by the Dollar Index to normalize fair value is not just a theoretical exercise. It is how you identify which pair within a group is most mispriced relative to the dollar move, and therefore where the highest-probability opportunity sits rather than trading the group as a whole.
🛡️ Educational content only. Not financial advice.
#globalexquant #DXY #intermarketanalysis #institutionaltrading
Trade The Edge Master Course.
Structure over pattern.
Framework over feeling.
Execution over impulse.
Many traders have market knowledge. What they lack is a repeatable system for applying it under real conditions, with real risk, in real time.
Inside the course:
+ The analytical framework institutions use before a single chart is opened
+ Intermarket structure, order flow, and volume from an institutional perspective
+ Execution, risk management, and trading psychology built into one cohesive system
Edge is not found. It is built.
The link is in the bio.
🛡️ Education only. Trading involves risk of loss.
#globalexquant #tradetheedge #institutionaltrading #tradereducation #riskmanagement
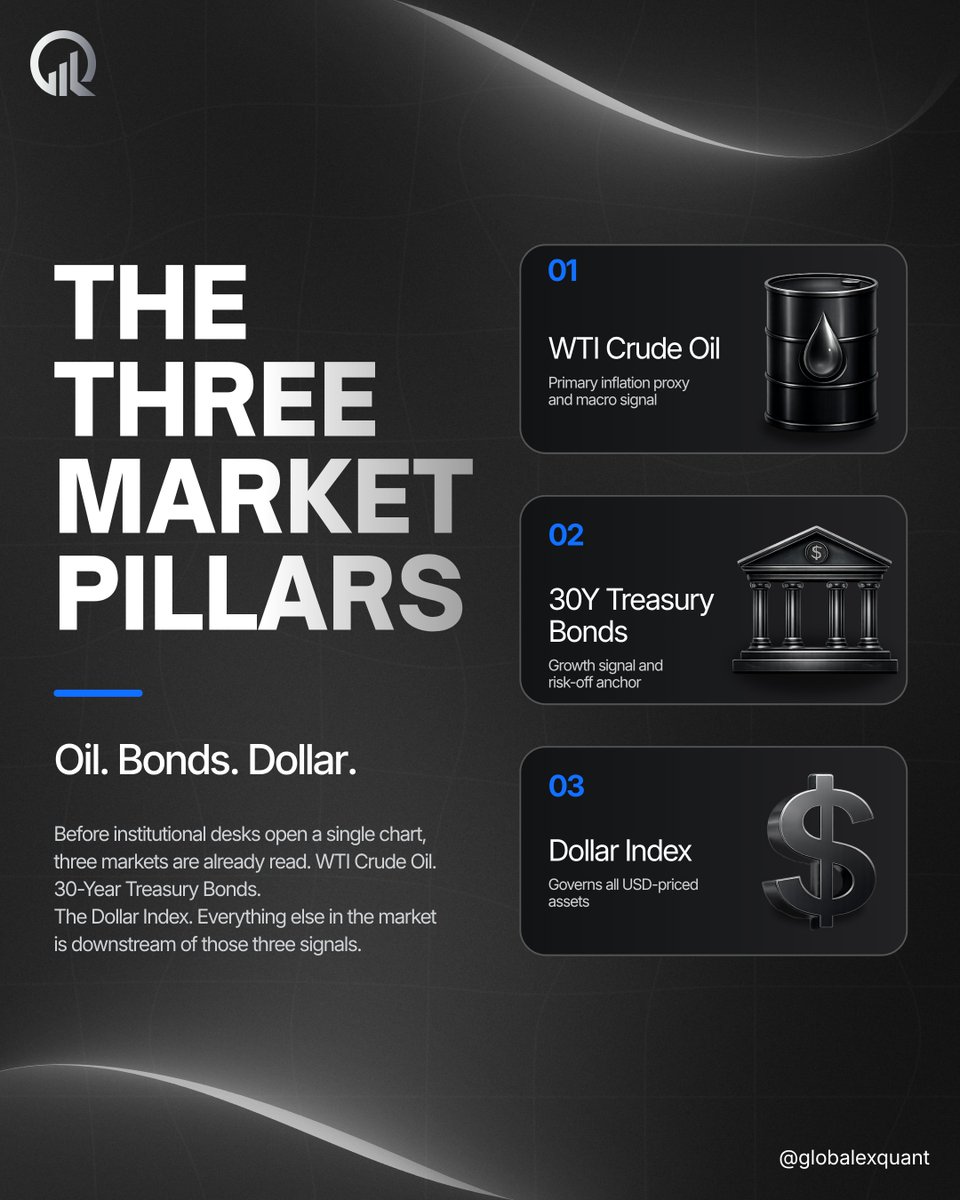
Before a single chart is opened, three markets have already framed the entire session.
Oil. Bonds. Dollar. Here is how the framework works.
WTI CRUDE OIL
WTI is the primary inflation proxy in institutional macro analysis. When crude rises, inflation expectations adjust upward across the board. Institutional desks read oil first because its direction directly determines the bond market response. Rising oil means rising yields. It is not just an energy market. It is the opening signal of the entire macro narrative.
30-YEAR ULTRA TREASURY BOND
The 30-Year is the primary growth signal and risk-off anchor. Its relationship to crude oil is one of the most documented negative correlations in macro markets. When inflation expectations rise through WTI, the fixed yield on a 30-Year Bond becomes less attractive in real terms. Commercials respond by aggressively selling the back end of the bond market. Bond prices fall, yields rise, and the macro narrative shifts toward inflation and away from growth in real time.
DOLLAR INDEX (DXY)
The Dollar Index governs the relative value of every USD-priced asset simultaneously. Gold, Silver, Crude Oil, EUR/USD, GBP/USD. All priced in dollars. All driven by DXY movement. When the dollar strengthens, USD-priced assets fall in relative value. Dividing any market by the dollar index removes dollar distortion from the reading and reveals true fair value. This is how institutions normalize their analysis across all markets at once.
HOW THE THREE PILLARS INTERACT
The sequence runs in one direction. Oil rises, inflation expectations increase, commercials sell 30-Year Bonds, bond prices fall and yields rise. The Dollar Index then determines how that repositioning flows across every USD-priced asset. These three markets together form the complete macro picture that institutions read before placing a single directional trade.
Which pillar do you read first? Tell us below.
🛡️ Educational content only. Not financial advice.
#globalexquant #macrotrading #intermarketanalysis #institutionaltrading #tradereducation
The May Activity Contest is live on the Globalex Quant Discord server.
The most active members this month get rewarded. Activity counts across four areas: engaging in conversations in general chat, sharing setups and charts in chart talk, posting in the memes channel, and helping other members by answering questions and contributing to discussions.
Full prize details and the live leaderboard are in the activity-contest channel. The server link is in our bio.
🛡️ Educational content only. Not financial advice.
#globalexquant #discordserver #tradingcommunity #globalexacademy #trading
Price discovery is a function, not an accident.
Market makers operate by continuously testing where genuine order flow is resting. Retail stop clusters at obvious structural levels, day highs, day lows, session extremes, are among the most predictable concentrations of latent market orders in the entire structure. When price sweeps those levels and immediately reverses, the reversal is the confirmation that the test found what it was looking for, or did not. Either way, the function was served.
The distinction that changes how you read these moves is the difference between a level and a pool. A support or resistance line drawn on a chart implies that price will be defended there. A liquidity pool implies the opposite: it is a concentration of orders that will be consumed when price reaches it. Most retail frameworks are built around the first interpretation. The market operates on the second.
The practical implication is not to avoid placing stop losses. It is to understand that predictable stop placement at obvious structural levels means your exit is visible to the participants who benefit from triggering it. Where a stop is placed relative to the liquidity pool, not just relative to the entry, is what determines whether it survives a sweep or gets taken before the move develops.
🛡️ Educational content only. Not financial advice.
#globalexquant #priceaction #marketstructure #orderflow #institutionaltrading
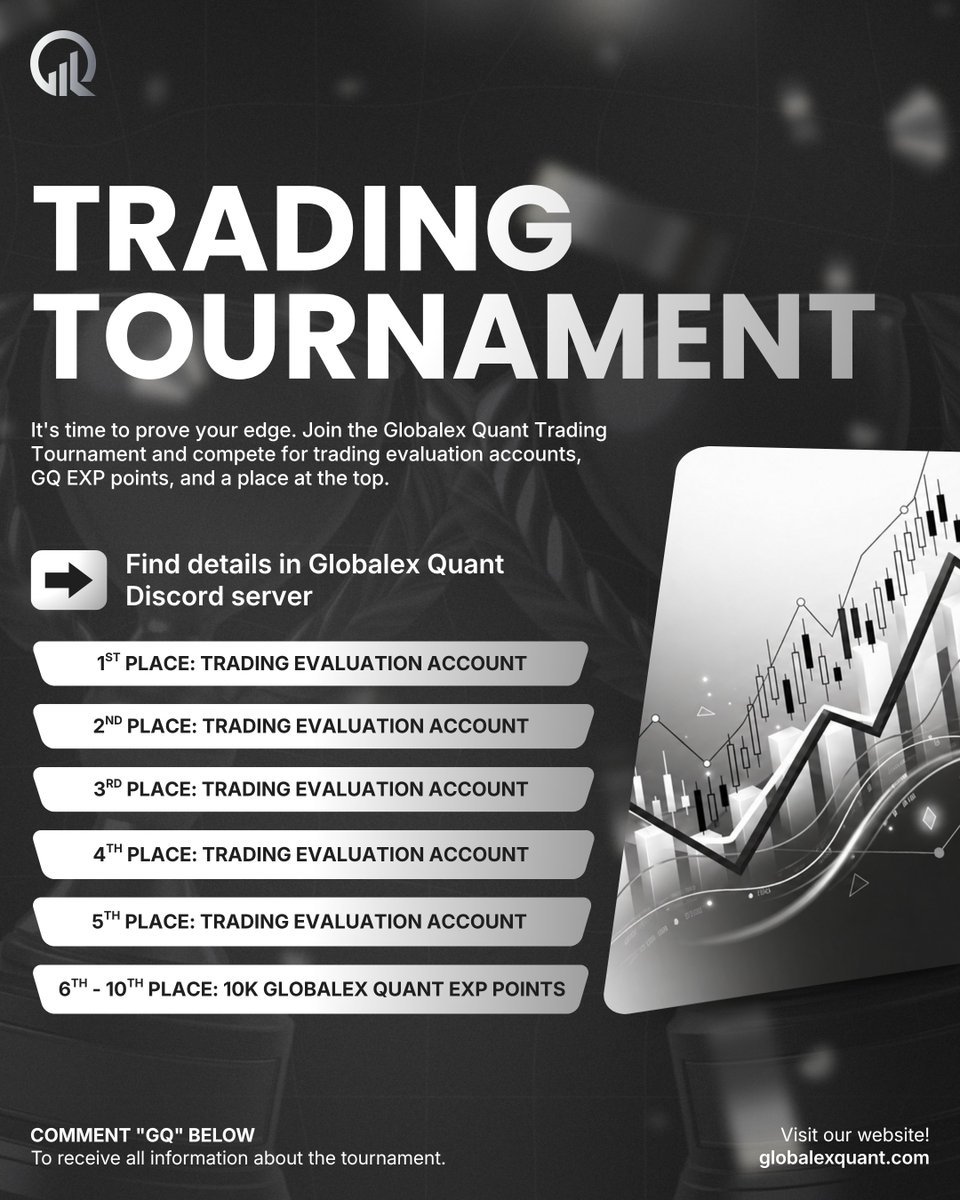
Comment "GQ" below, and we will send you all the details about the tournament directly.
The Globalex Quant Trading Tournament is open. The top five finishers each receive a trading evaluation account. Places six through ten receive 10,000 Globalex Quant EXP points. Full rules, structure, and entry details are available in the Globalex Quant Discord server.
A tournament is one of the few environments where execution under pressure can be tested against real competition rather than a personal benchmark. The leaderboard does not care about your analysis. It reflects what you actually did when the conditions were live.
All information is in the Discord server linked in our bio.
🛡️ Educational content only. Not financial advice.
#globalexquant #tradingtournament #tradereducation #institutionaltrading #trading
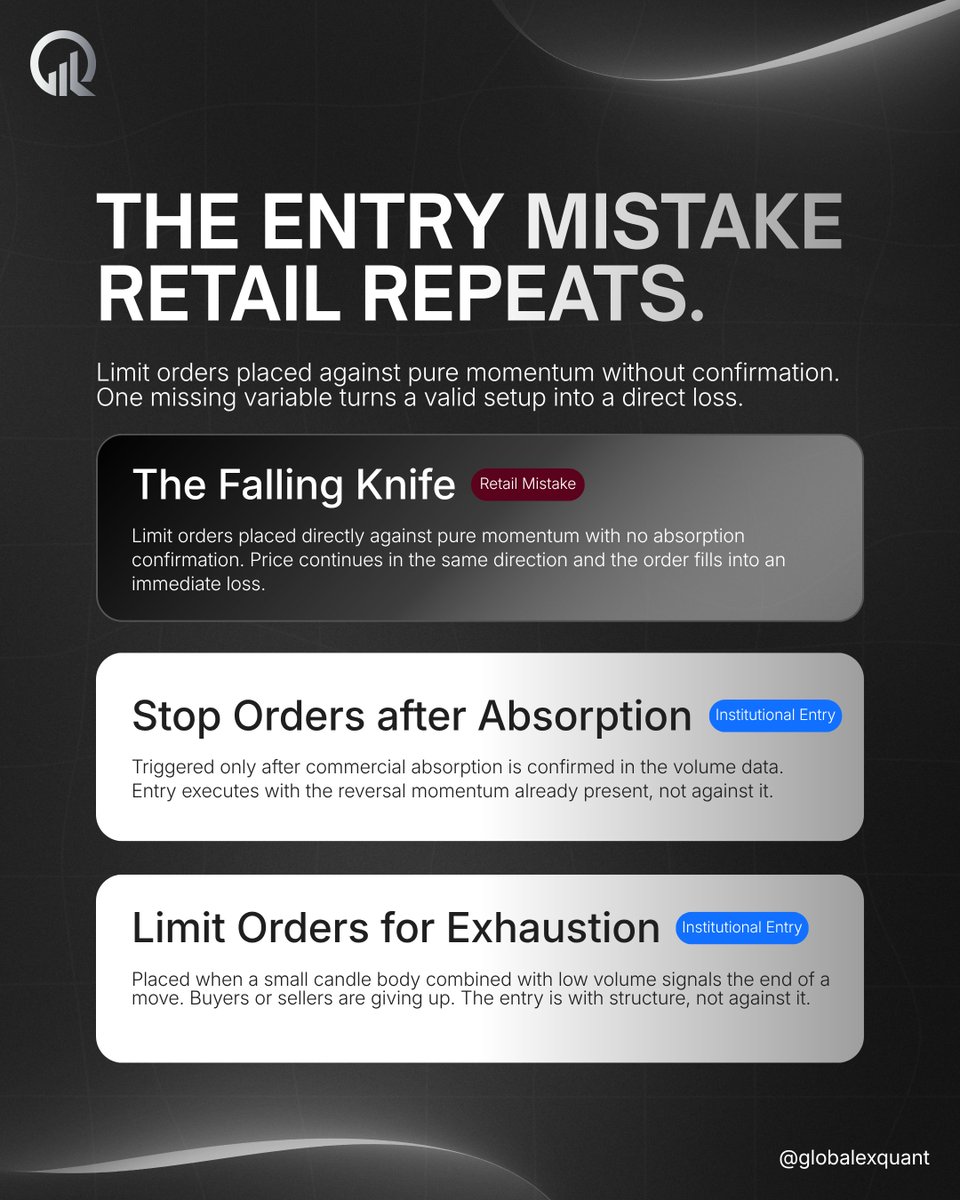
A limit order placed at a technically valid level can still be a structurally incorrect entry. The level is not the problem. The timing is.
The Falling Knife
The core error is treating a price level as sufficient justification for an entry. When a market is in pure directional momentum, the absence of any opposing institutional activity means there is nothing to stop the move. A limit order filling into that environment does not enter a reversal. It enters a continuation. The analysis behind the level may be sound. Without confirmation that commercial participants are actually present and absorbing the flow at that level, the entry has no structural basis for expecting a turn.
Stop Orders after Absorption
The difference between this approach and the falling knife is sequencing. The entry does not anticipate absorption. It waits for it to appear in the volume data first, then triggers in the direction that absorption implies. By that point, the reversal momentum is already present. The stop order does not create the position ahead of confirmation. It captures a move that has already begun showing evidence of institutional participation.
Limit Orders for Exhaustion
Exhaustion carries a different signature than absorption. The signal is not high volume absorbing aggressive flow. It is low volume combined with a small candle body, indicating that directional pressure has simply run out of participation. Buyers or sellers are no longer willing to continue at that price. A limit order placed into that signal is not fading momentum. It is entering at the point where momentum has already ceased, which is a structurally different proposition entirely.
🛡️Educational content only. Not financial advice.
#globalexquant #orderflow #tradeexecution #institutionaltrading #tradereducation