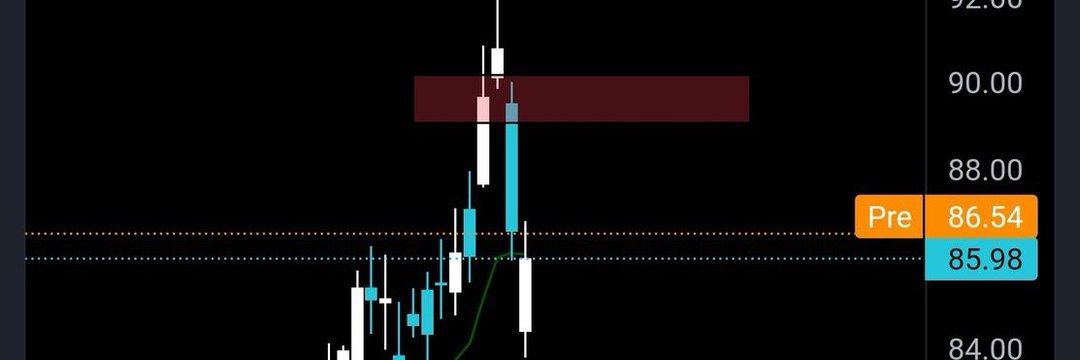
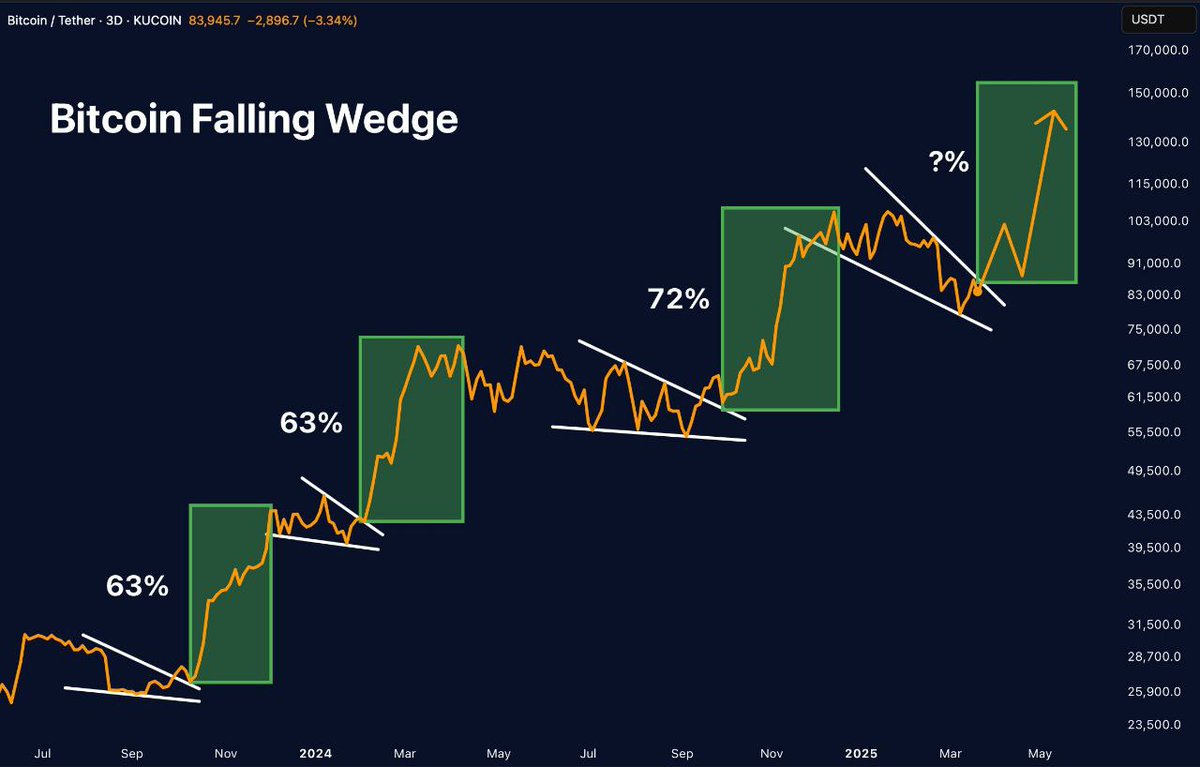
$STI Strong Buy for $STI. The moving averages show a buy signal, with the 50-day MA crossing above the 200-day MA, forming a Golden Cross.
#StopLoss#TakeProfit
3.4 How to identify FVG
I've illustrated the FVGs in Bitcoin in 4H TF.
The Bitcoin price revisits the FVG created in May, bouncing back from $98,250
The FVGs illustrated in the image serve as support for the price.
Price seeks liquidity in FVGs.
NO NEED TO PANIC
$BTC is still in a massive bullish uptrend, bouncing perfectly off the weekly EMA ribbons!
Patience is your best friend in these times.
🚀 $ETH Breakout Alert! 🚀
Ethereum just broke out from a small consolidation on the 4H chart! 📈
If momentum continues, I’m watching these targets: $2017 & $2106 👀
Let’s see if we get a strong rally today! 🔥
With these moving averages capping any upward attempts, Bitcoin appears poised for further downward movement. Keep an eye on the next developments to confirm the trend
#BTC/USDT ANALYSIS
Bitcoin has broken down from the ascending triangle pattern with significant volume, signaling potential bearish momentum. The 21MA and 50MA are now acting as resistance barriers, adding pressure to the price action.
.