Welcome to GBLN TG CHANNEL — your gateway to crypto.
We share the latest insights about Web3 & DeFi, market makers’s navigation, meme updates, DYOR of tokens & digital assets, and market trends for funds, founders and traders.
Our cases 🔜
🦾Stay ahead following us 🔗 https://t.co/yPjZkwKrgq
➡️What is LOOPING in DeFi?⬅️
▪️#Looping is a strategy in #DeFi lending protocols where the trader borrows against his collateral and re-deposit the borrowed funds multiple times. It’s essentially a way to create synthetic leverage like a long with X leverage.
#HYPE#Crypto#Research
🚨 HYPE token analysis: Part 2 is LIVE!
Hey, hype-rs!
As promised, the second part of my deep dive into $HYPE is now published.
In this segment, I'm starting to break down FA, the tokenomics, the team's plans, risks and on-chain metrics from MARKET MAKER’S VISION. This is a work in progress, and I'll be updating the analysis regularly in this NOTION as I uncover more details. Make sure you're subscribed and have post notifications ON so you don't miss the updates as I add them!
🔗 READ THE ANALYSIS HERE: https://t.co/Iseo5oADKg 🔗
🤣Did u think the author vanished faster than a shitcoin's liquidity?
The silence is broken. The alpha is here.
To make it up to you, I didn't just shed a few Satoshi's tears. I went full-on and wrote a deep dive into what really moves $HYPE and the #Hyperliquid platform.
▪️Track 1: A macro force and crypto trends shaping $HYPE.
▶️READ IT: [https://t.co/BhZQvjZCY4…]◀️
Let me know your thoughts
We are ready to announce you about us🦾
Who are we?
MEET US AS MARKET MAKER GOBLIN
No weak hands❗️
Advanced algorithms. Relentless organic liquidity.
Shaping markets across CEX & DEX.
We move faster than markets⚡️
Our main account -> @crypto_gbln
Welcome to our community and stay tuned🚀
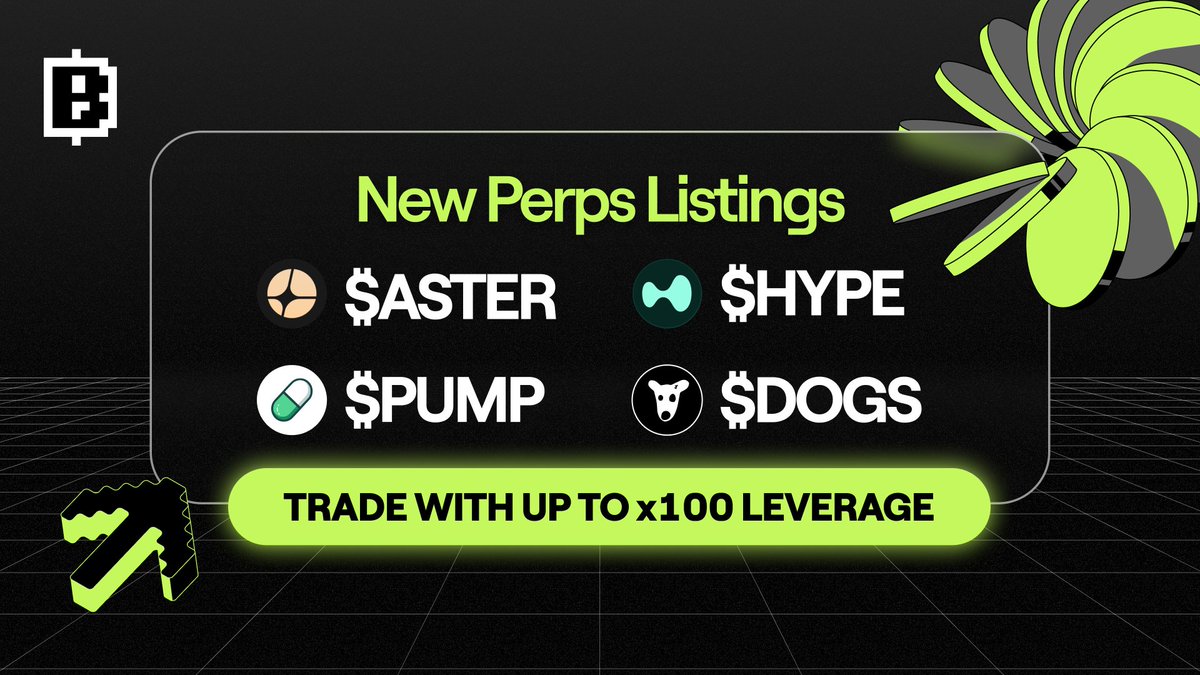
📢 New listings on Blum Perps: $ASTER, $HYPE, $PUMP, $DOGS
Trade these trending tokens as perpetual futures with up to 100x leverage – right inside Telegram.
Your first Perps trade awaits 👉 https://t.co/0dca7FKhaa
-> Market implications
The #market understands this perfectly and is pricing it in. This expectation of imminent rate cuts is the primary buoy keeping asset prices from sinking under their own weight amid deteriorating fundamentals.
Consider this: the main driver of the current bullish sentiment is the expectation of three rate cuts by year's end.
🤓The @federalreserve dilemma: Decoding the meeting macro pic and last macro data
What comes next?
Why it's so significant?
The numbers paint a clear and somewhat startling picture of a cooling #US#economy:
➡️August NFP: A mere 22K jobs added, massively missing the 75K forecast. Crucially, the weak July numbers were not revised upwards, confirming the softening #trend isn't a one-off blip.
➡️PPI for august: It unexpectedly went negative at -0.1% vs. a +0.3% forecast. This is a powerful leading indicator. It suggests weakening demand is causing producers to lower prices, a deflationary signal that often precedes broader economic slowdowns.
➡️CPI: Headline year-over-year came in at 2.9% (as forecast), with core #CPI at 3.1% (also as forecast).
It's becoming a sticky lagging indicator in this context.
The broad pic: A soft landing?
The evidence points toward a noticeable economic slowdown without a preceding inflationary spike. The labor market is braking hard, and negative PPI indicates a substantial drop in downstream demand.
The focus is now shifting away from current CPI. Here’s a key observation many are missing: the upcoming 12-month rolling window will drop three months of high inflation data (November, December, and January 2023, totaling ~1.2%). This mechanical effect alone will powerfully pull the headline CPI number down toward the Fed's 2% target, likely by early 2025.
The recession risk is no longer a distant speck on the horizon; it's becoming visible in the rearview mirror. The market is now convinced the Fed is not just ready to cut in the next months, but to do so actively.
Just remember that we took data for the last year only, as there is no early data for new projects (e.g., HYPE's listing in Nov, 2024).
@coingecko in its Q1 report wrote that the correlation btwn S&P500 and BTC reaches 0.85, which is possible with a longer historical dataset allowing for smoothing out average price volatility.
Source: https://t.co/Ym3kAArG2W
⤵️Why these patterns arise
▫️Market leaders set sentiment & liquidity direction ($BTC & $ETH).
▫️Platform tokens are exposed to similar on-chain demand and #speculative flows.
▫️S&P500 is driven by #macro/economic fundamentals; cryptos are primarily sentiment/liquidity driven — hence only partial co-movement except during global risk events.
💡Why it matters
🧐Correlations reveal systemic risk — if everything moves in sync, diversification disappears.
🤔Spotting lower-correlation assets helps design stronger portfolios.
When coins start moving in sync, it’s not just vibe — it’s liquidity at work.
⚡️ Outlier coins:
-> $HYPE, $TRX and $XRP still show weaker links (0.3–0.5) compared to most, likely because of idiosyncratic news, @federalreserve policy and narrative-driven trading.
Niche and native tokens could show low correlation with both #BTC and S&P500, indicating idiosyncratic drivers (protocol announcements, tokenomics changes (unlocks), listings) dominate their returns.
KEY OBSERVATIONS
📈 High internal crypto correlations
Most altcoins move together (0.6–0.8).
Especially: LINK–AVAX (0.84), SEI–AVAX (0.79), ETH–SOL (0.77).
$BTC as the benchmark
#BTC correlates well with alts (0.62–0.73) but less than they do with each other.
→ BTC still acts like a #CRYPTO INDEX setting the tone for business cycles.
🔸Weak ties with S&P500
Correlations with equities are tiny (~0.05–0.15).
→ #Crypto still behaves as a separate risk universe, not just “tech stocks 2.0”. They are still substantially driven by crypto-specific factors; only during macro risk events (rate news, liquidity shocks) the cross-market coupling rises.
📊 CRYPTO vs STOCK MARKET — CORRELATION INSIGHTS (2024–2025)
Methodology:
To understand how #crypto assets move relative to each other and to the traditional #finance, we:
▪️Collected 1D closing prices for S&P500 (from @Yahoo) and for major crypto assets (from @coingecko)
▪️Used the same one-year time window (2024-09-19 to 2025-09-19) for all assets
▪️Aligned dates: #S&P500 data has no weekend entries, so we matched crypto data to business days only
▪️Removed extreme outliers to reduce noise
▪️Converted prices into daily log-returns (log differences), which makes the data less #volatile and statistically cleaner for our #correlation analysis
🙎♂️ When the author of this channel finally dusts off the Python terminal…
Fam, I finally cracked open my #Python console and started running my own research instead of just scrolling through random charts on X or TG.
Time to bring you some data-driven #analytics and useful content 💻
Welcome to GBLN TG CHANNEL — your gateway to crypto.
We share the latest insights about Web3 & DeFi, market makers’s navigation, meme updates, DYOR of tokens & digital assets, and market trends for funds, founders and traders.
Our cases 🔜
🦾Stay ahead following us 🔗 https://t.co/yPjZkwKrgq


![Goblin_TechDev's tweet photo. 🤣Did u think the author vanished faster than a shitcoin's liquidity?
The silence is broken. The alpha is here.
To make it up to you, I didn't just shed a few Satoshi's tears. I went full-on and wrote a deep dive into what really moves $HYPE and the #Hyperliquid platform.
▪️Track 1: A macro force and crypto trends shaping $HYPE.
▶️READ IT: [https://t.co/BhZQvjZCY4…]◀️
Let me know your thoughts](https://pbs.twimg.com/media/G0VsSycWoAAC82-.jpg)