#giveaway $BTC
Dropping 0.000865 $BTC to 2 winners ❤️
TO ENTER:
✅ Follow me + RT this
✅ Like 3 previous posts
✅ Drop $BTC wallet
Proof from last round 🧾 in replies
If you want to learn how I predict $BTC tops & bottoms & the strategies I use...
I am opening up a Trading Academy for 3 months. DM me for more info.
I will not run another one of these until 2026.
Beware of scammers. My only handle is @KillaXBT
Listen...
When the market is in a clear bullish trend, majority of traders often perceive the move as overextended. That perception triggers a COGNITIVE bias
Many traders are acustom to — longing "Support" and shorting "Resistance" purely based on the assumption that price is due for a corrective phase.
Yes, the statistical probability of a retracement increases after an extended impulse leg — but that doesn’t validate fading the trend. You’re still positioning against directional flow, structure, and momentum.
Just because a setup aligns with historical probability doesn’t mean it aligns with current market context or intent. A favorable R:R or textbook entry at a key level is irrelevant if it’s disconnected from the broader narrative.
In short: probability without context is noise. A setup that looks favorable in isolation is often invalid when viewed through the lens of trend continuity, market structure, and liquidity dynamics.
So next time you’re about to short an impulsive leg or long a corrective wave, ask yourself:
Am I trading based on the market’s actual structure and momentum — or am I letting the bias “too high means correction, too low means pump” cloud my judgment and force me into a premature trade?
Master your mind. $BTC
HUGE SHOUTOUT TO THE BEST TRADING GROUP IN THE GAME @ScalpXOfficial 🔥📈🔥
Appreciate The Support On Fight Night Absolute LEGENDS‼️
Join The Discord and Learn How To Trade Like The Pros! - https://t.co/mfha5LhDru
🚀 2025 $ETH Market Analysis
______________________________________________________
📉 Support Levels: Key zones to watch
📈 2025 ATH Levels: (THIS WILL HAPPEN!)
📊 Strategies Covered:
- TD 9 Sequential
- Wave Count
- Order Blocks
- Candle Imbalance/Magnets
🎥 FULL Video Tutorials inside our Academy
🗣️ Setup Discussions happening inside trading-tournament
🙏 Thank you for your support! Have an amazing start to your week!
🎥 Tap in below 👇
#Trading #Crypto #MarketUpdate
Bitcoin Market Structure Overview | $BTC #BTC
Eliminating directional bias will save you alot of money in range bound market.
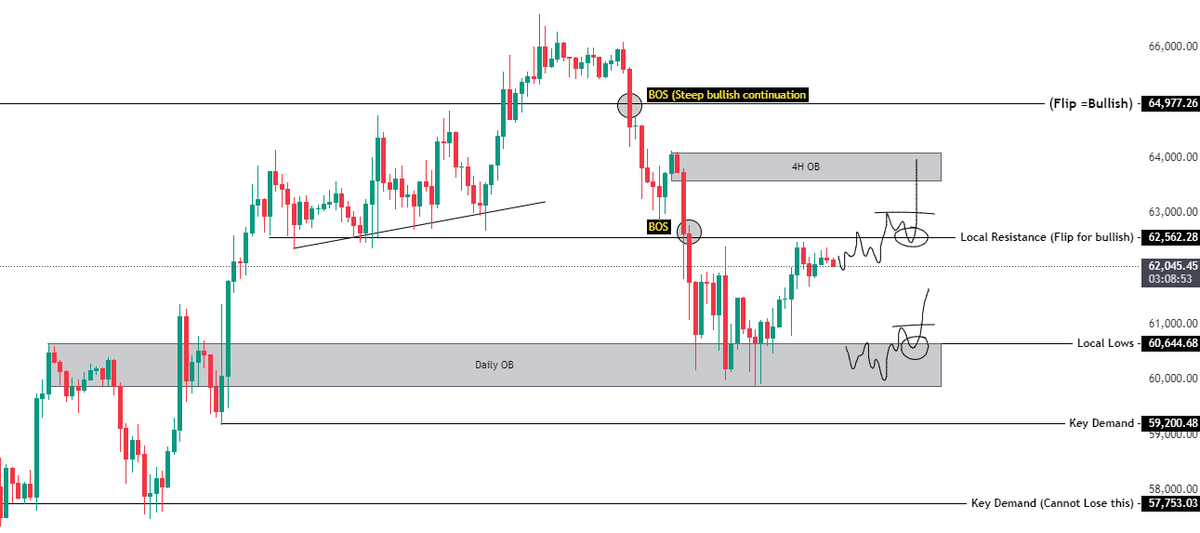
Bitcoin has had a significant mark upwards from the 59.3K lows. We have two different liquidity zones. One of those liquidation zones are at 63.7K-64K. If Bitcoin is unable to flip this area of resistance, It is likely that 63.7-64K forms a local top validating shorts. If we tap into the first liquidation zone & are unable to maintain bullish structure for the next leg, this likely results in testing lower levels.
We have a small LTF area of support at 61.8K which if we hold above validates a push towards the liquidations above. However, if 61.8K lost = 61.2K (Breaker Block) is tested next. Lose the breaker block & the Daily EQLs are after.
Overall, We have liquidations around 64K. If we are unable to hold bullish structure, it would invalidate a sweep of $65K+ liquidations. A loss of $60K range lows would trigger a long liquidation cascade all the way down to 57.5K.
Bitcoin - Market Structure Overview | $BTC #BTC
Bitcoin sweeping $64.9K (Prior daily resistance) was very bullish at the time. We created a HH. However - Its important to note that we retraced back downwards & formed a LTF lower high at $64k.This rejection indicates that we are still range bound. The moment we had acceptance below $64.9K on the daily...that was the sign to flip bias/market positioning.
Bearish Outlook🔴
As of now based of the HTF $60.4K-$60.7K serves as a very important area. Creating a LH at $64K and then breaking below $60K would validate that we can trend lower. If $60K is lost, Your next POI for longs sits around $57.4K on the daily timeframe. This needs to hold as its a HL on the daily. Lose it = CME gap at $53-$54K
Bullish Outlook 🟢
If Bitcoin is able to reclaim $62.5K & then create a HH above $64K previous high, this would validate a structure shift. Meaning that HLs are expected & to look for longs on pullbacks. Unable to create a HH above $64K will result in the Bearish thesis above. If in the next few weeks Bitcoin can break above $65K & hold with bullish structure, We are looking at price discovery above $67-$68K.
Remember to always analyze market structure! Hopefully this helps!
Bitcoin - Market Structure Overview | $BTC #BTC
As of this post, BTC is sandwiched between 62.5K & 60.6K. Both serve as important support/resistance zones on the HTF & LTF. Our objective is to identify market structure & whats next:
If BTC manages to flip 62.5K local resistance & close above. We can make a extension towards the 4H OB at 64K. Failure to flip 62.5K with force will result in a retest in LTF levels such as 61.4K & If that is lost the 1D OB at 60.6K is next. Its important to note that if we form another lower high at 62.5K, revisiting the 60.6K 1D OB will become a saturated level and have a increased chance of snapping on revisit.
If the bearish thesis plays out, we can expect revisits below 60K at either 59.3K or 57.7K. However, if we are able to consolidate & flip 65K this would confirm that we are maintaining bullish structure & we are likely headed for 70K next.
I hope these structural contents help!
Bitcoin - Market Structure (Cheat Codes) | #BTC $BTC
The market operates like a living simulation, fueled by human behaviour,, algorithms, and data. News acts as a catalyst, disrupting this flow by transforming fear into frenzy or igniting euphoria. Significant economic events send shockwaves through the system, causing reactions to ripple across markets in both directions. It is your job to utilize this information in the best way possible.
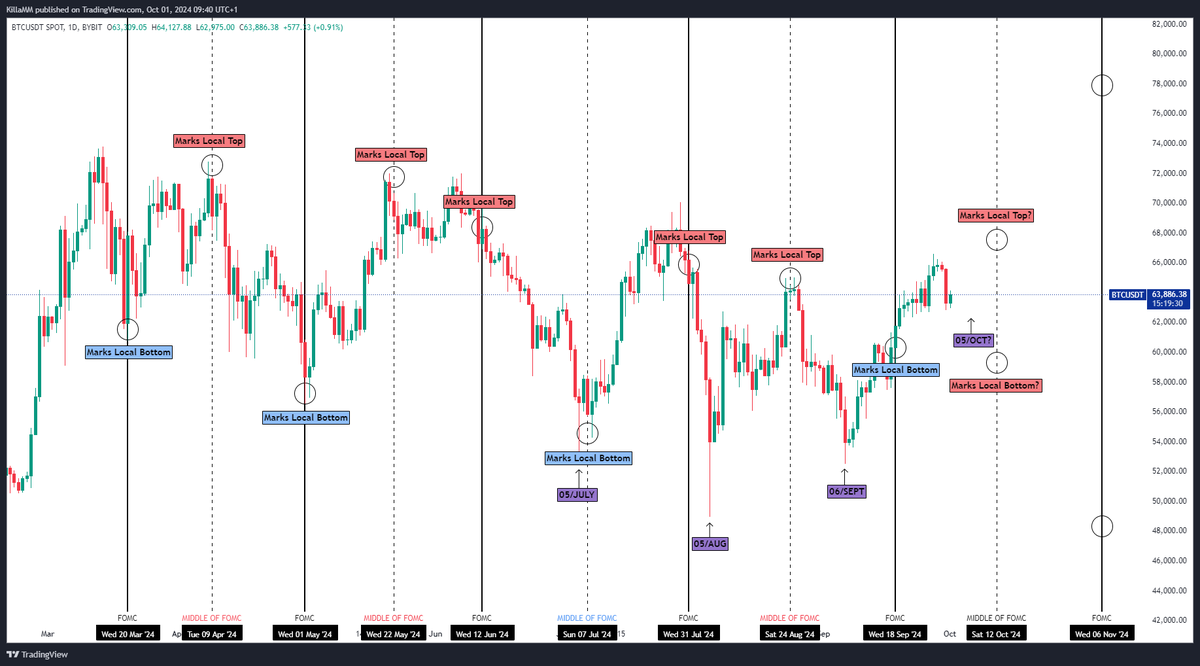
A common pattern I have recognized is that each Local Top/Local Bottom is usually formed around FOMC or between fomc dates. Through the chart I have created, You can see a reference of this data showcased visually with Bitcoins price action.
The next FOMC date is November the 6th but we are not focused on that date as of yet. We are focused on the "Middle of FOMC" illustrated on the chart. Typically the market develops a false narrative leading upto these dates. So if we are pumping/dumping upto these key psychological dates, we expect a inverse movement.
The 12th of October is one of these key dates. If we are dumping/Pumping upto this date, we can expect it to mark a local top/bottom based on market structure. (Open high, Possible top, Open low, Possible bottom). Your objective is to analyse and pay attention to these dates as they act as key pivotable points. Referencing historical price action/Data can help analyse what scenario is more likely than the other.
Another common pattern I have recognized is since july, around the 5th-6th (Purple box) at the start of the month, it has recently been marking us a bottom. As said above, if we dump aggressively upto this date, we can speculate the possibility of marking a local bottom before continuation.
I hope you guys are able to recognize these patterns I have shared & utilize them. The market moves in waves with priced in news being the real market manipulator.
P.S - If I go missing, I shared too much 😉
BTC: Short Setup -🌸
------------------
Entry: 67206.0
SL: 67620.0
Note:
Ideal risk is 1R. TP is dynamic. Ideal TP levels are mentioned on the charts
#BTC#ETH $BTC $ETH $SOL #Altcoins